Trade ideas

Recent Selloff May Provide Good Entry11-days ago we suggested short position with target price 250 still that remains valid but 170/163 also provide strong rebound back to 194 before earning. Now if u are in this trade you are sitting on 10% and good to protect the gain and flip the trade. Real-time alerts go www.2waytrading.com

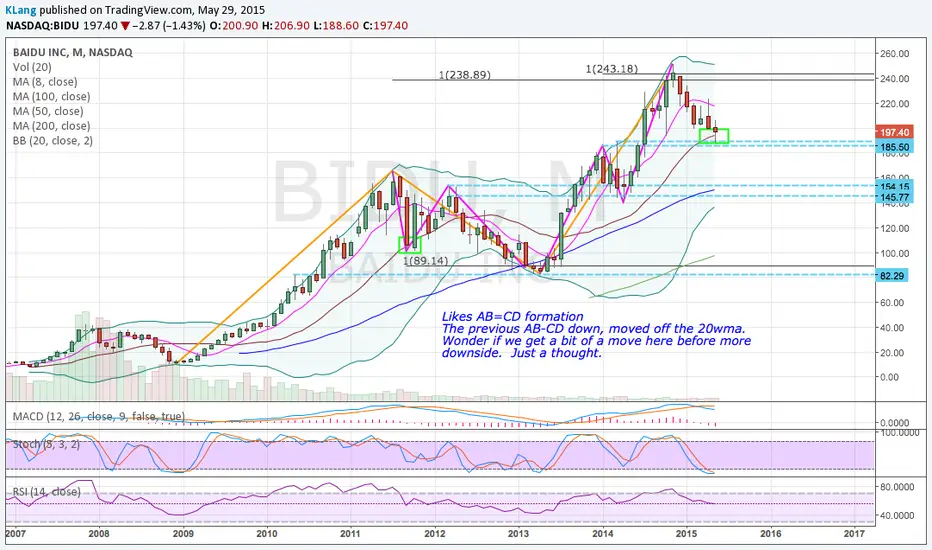
Daily short in BIDUAfter gapping and holding below 2 earnings levels, I will take this 2R short.
3 primary reasons I'm bearish:
1. RgMov is in a downtrend, with 5/13 MA clearly bearish
2. Price is expanding range lower on both a daily and weekly scale
3. Price is right below two key earnings levels that will act as resistance
GL!


Time to Go Short $BIDU?Price did bounce from support line 188.60 but still weak. This unique pattern may suggest a possible downside target $150 but at the same time push above 200 will suggest upside target price of $230 Real-time alerts try us www.2waytrading.com

$SPY $BIDU - Bounce or tank?Interesting here. Looking at weekly, macd rolling over. I can see sow before UTAD to create the apex with support found a the 61.8. Tough, that could be UTAD with LPSY set for FTI or Sow about tag UTAD. CMF virtually flat. My bias has a hard time being long this market. Short term, can it rip to new highs? Yes, possible, I would be waiting there short.


BIDU Bearish SignalTF Day on uptrend, but after hit 52 weeks high, candle stick indicated bearish pattern. If the price break out the SL @ $200 and not pull back within 3 days, potentially to reverse to down trend, then open PUT. If price spike up break out $213.6, its trend may be back to up trend, close PUT position and consider to open LONG.


Strong Earning Expect Strong Price ActionLast recommendation was to enter $140 if price holds and it did indeed. Though price appreciated a lot before earnings, the good news was more of expected and they delivered now. First, price overcame $154 level and gaped up with good news last week. We expect now price to enter next few sessions or weeks into the second profit zone. Try www.2waytrading.com

Hate too much drawing but close to crucial levelToday is very strong but price was stopped right where many will have their DTS and new SS will show up for a bet and should have given you enough tools to take or book some of the profit from $140 entry for second time. Next level to watch if we break $17 is $188 that only will happen if ER is strong. Real time alerts www.2waytrading.com

Is $BIDU a Buy Candidate?Though today's above average volume is a concern, still price is above recent entry point $140. Watch at that level for second chance to take out recent solid wall at and around 153.5 area with target price 183 level this can take a few months to achieve. It's 30% upside move if price holds $140. www.2waytrading.com

BIDU bearish – Posts new 14-month lows, eyes 148.16 next BIDU continues to weaken, posting new 14-month lows towards the 148.16 area (near 61.8% of the 83.27/251.99 rise). Below lies the 140.66 key support (April 7, 2014 weekly low). The 179.06 resistance should cap near-term bounces.
Outlook:
Short term: bearish
Long term: bearish

BIDU - Scary out the week hands and turn north again?Context:
monthly uptrendig intact
natural PB to lower extreme
Swings
seems that major pendulum swing has fullfilled its job, since the sinus wave looks completed
also the minor sin. wave completed
Price Action
orderly former flow to the downside
pressing - major fish in the pond wants cheaper price to fill his bag
create panic - whale create panic to collect it all from the week hands
price stops right at a center of a reaction line, and within the center box, where former accumulation was
Outlook
potential support in the range of 150/160
as sinus boxes often get washed, it's a good idea to start small and add to the position later
Trade Idea (Position Trade)
stopp needs to be below the box, plus some
start small between expected support range and build on further confirmation
profit a) at the upper MLH (P5), just little below the sliding
Trade Management
move B/E when Risk/Reward is @1.5
trail below real structure, or if price explode to the north, trail below wide range bars (see Jul. 14 and Jul. 15)

Bye, Bye, BaiduChina's stockmarket crash coupled with mixed earnings results put pressure on Baidu (BIDU). The company reported profit for the second quarter of 3.66 billion yuan ($591 million), up slightly from 3.55 billion yuan in the same quarter a year earlier. EPS stands at $1,81, which is below analysts' estimate of $1,84. Baidu's revenues rose 38 percent from a year earlier to 16.57 billion yuan, which is in line with expectations. The guidance for Q3 is below consensus.
Baidu ended the formal trading day down 4.16%. The sell-off continued in after-market trading. We expect more selling pressure to come. There's a reversal pattern on the weekly chart, and the trend is clearly down. 167 area is seen as an appropriate target.

Bears trying to make a statement hereChannel operator, touched the top, now trying to head down to the 188 level.

$BIDU H & S and downtrend$BIDU has a classic bearish H & S. It has now broken down from its trendline of the retracement (around $190 - $212) 1st target at 0.5 fib retracement hit today. Ultimately, traditional technical analysis would suggest an ultimate Price Target of close to $172. Let's wait and see. If you have any comments or queries, do get in touch... Happy Trading!

Look for high probability trades.You don't have to trade every tick.. Look for high probability trades and jump on them.