Value stock. Bic.Bic has a p/e ratio of 6.5. 4.7% dividend yield.
Has been down trending since 2015 and is now range bound with a high of 64.9 and a low of 38.5.
Printing a falling wedge which is a bullish reversal pattern.
RSI struggling with breaking into bullish territory at the 50 level.
AO showing bullish d
2.33 USD
229.33 M USD
2.38 B USD
82.41 M
About Societe BIC SA
Sector
Industry
CEO
Rob Versloot
Website
Headquarters
Clichy
Founded
1953
ISIN
US0887361030
FIGI
BBG000NTRT16
Société BIC SA engages in the manufacture and distribution of stationery products, lighters, and shavers. It operates through the following segments: Stationery, Lighters, Shavers, and Other Products. The Stationery segment include pens, pencils, markers, coloring, and correction products. The Lighters segment offers various lighters such as classics, electronics, decorated, lighter cases, and multi-purpose. The Shavers segment consists shavers for men and women. The Other Products segment includes strategic and tactical activities. The company was founded by Marcel Bich and Édouard Buffard on March 3, 1953 and is headquartered in Clichy, France.
Related stocks
Société BIC a 'forgotten' value stock!There is a famous saying among portfolio managers ''The best stocks to invest in while the economy is plunged in a recession tend to be boring, get-the-job-done companies.''
Anyone knows that when the economy declines, many investors begin to load their portfolios with defensive stocks or stock fund
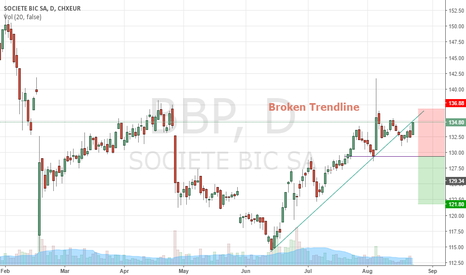
Broken Trendline: Waiting for reversalBBP should soon see a reversal from this day closing point and if closes down the horizontal trend line it will continue a downtrend. Else it may become a strong support. My opinion is till confirmation we should wait and see.
Disclaimer: This is purely an personal idea and you must enter a trade o
See all ideas
Summarizing what the indicators are suggesting.
Oscillators
Neutral
SellBuy
Strong sellStrong buy
Strong sellSellNeutralBuyStrong buy
Oscillators
Neutral
SellBuy
Strong sellStrong buy
Strong sellSellNeutralBuyStrong buy
Summary
Neutral
SellBuy
Strong sellStrong buy
Strong sellSellNeutralBuyStrong buy
Summary
Neutral
SellBuy
Strong sellStrong buy
Strong sellSellNeutralBuyStrong buy
Summary
Neutral
SellBuy
Strong sellStrong buy
Strong sellSellNeutralBuyStrong buy
Moving Averages
Neutral
SellBuy
Strong sellStrong buy
Strong sellSellNeutralBuyStrong buy
Moving Averages
Neutral
SellBuy
Strong sellStrong buy
Strong sellSellNeutralBuyStrong buy
Displays a symbol's price movements over previous years to identify recurring trends.


