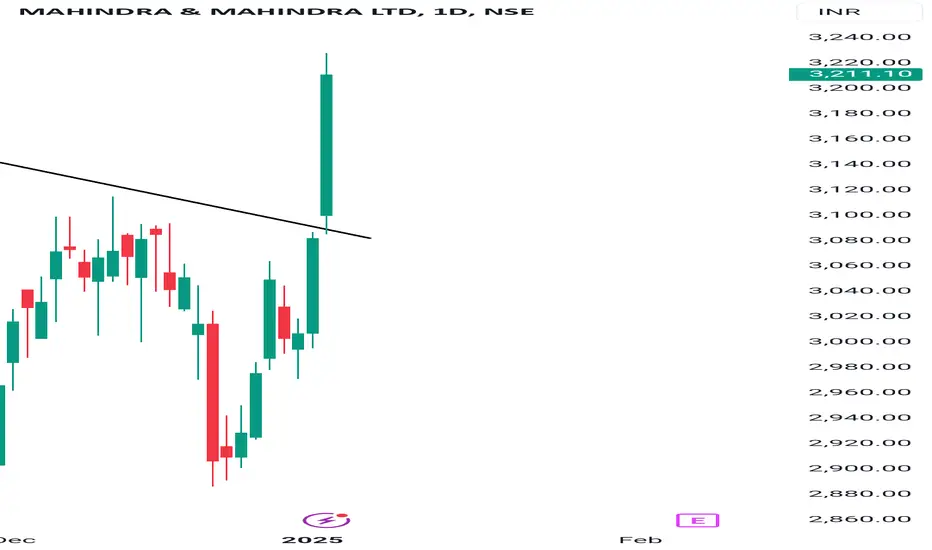
Amazing breakout on Weekly / Daily Timeframe - M&MCheckout an amazing breakout happened in the stock in Weekly timeframe, macroscopically seen in Daily timeframe. Having a great favor that the stock might be bullish expecting a staggering returns of minimum 25% TGT. IMPORTANT BREAKOUT LEVELS ARE ALWAYS RESPECTED!
NOTE for learners: Place the breakout levels as per the chart shared and track it yourself to get amazed!!
#No complicated chart patterns
#No big big indicators
#No Excel sheet or number magics
TRADE IDEA: WAIT FOR THE STOCK TO BREAKOUT IN WEEKLY TIMEFRAME ABOVE THIS LEVEL.
Checkout an amazing breakout happened in the stock in Weekly timeframe.
Breakouts happening in longer timeframe is way more powerful than the breakouts seen in Daily timeframe. You can blindly invest once the weekly candle closes above the breakout line and stay invested forever. Also these stocks breakouts are lifelong predictions, it means technically these breakouts happen giving more returns in the longer runs. Hence, even when the scrip makes a loss of 10% / 20% / 30% / 50%, the stock will regain and turn around. Once they again enter the same breakout level, they will flyyyyyyyyyyyy like a ROCKET if held in the portfolio in the longer run.
Time makes money, GREEDY & EGO will not make money.
Also, magically these breakouts tend to prove that the companies turn around and fundamentally becoming strong. Also the magic happens when more diversification is done in various sectors under various scripts with equal money invested in each N500 scripts.
The real deal is when to purchase and where to purchase the stock. That is where Breakout study comes into play.
LET'S PUMP IN SOME MONEY AND REVOLUTIONIZE THE NATION'S ECONOMY!
Trade ideas

M&M at a Breakout Crossroad! Will the Bulls Take Charge?Mahindra & Mahindra Ltd (M&M) is gearing up for its next big move as it consolidates within a symmetrical triangle pattern. With the stock trading well above its 200-day moving average, the long-term uptrend is intact. Will M&M break above ₹3,100 and rally to new highs, or will bears push it below ₹2,950?
👉 Resistance: ₹3,100
📢 Keep an eye on the volume—it will reveal the winner in this battle! Let us know your thoughts in the comments below. Are you bullish or bearish on M&M? 🚦


BUY M&M NOW FOR TARGET OF 1180 SL 899BUY M&M NOW FOR TARGET OF 1180 SL 899 . FLAG Breakout has done. Stock looks bullish.

M&M | Buy | Target Price: Rs 990 InidaSun Storm Investment Trading Desk & NexGen Wealth Management Service Present's: SSITD & NexGen Portfolio of the Week Series
Focus: Worldwide Everyday
For more Company Chart and Informational Analysis Please Visit: www.tradingview.com
By Sun Storm Investment Research & NexGen Wealth Management Service
A Profit & Solutions Strategy & Research | @profitsolutions
Sun Storm Investment | www.sunstorminvestment.tk | @sunstorminvestment
NexGen | www.nexfinserve.com | @nexfinserve | info@nexfinserve.com
Trading | Investment | Stocks | ETF | Mutual Funds | Crypto | Bonds | Options | Dividend | Futures |
USA | Canada | UK | Germany | France | Italy | Rest of Europe | Mexico | India
Disclaimer: Sun Storm Investment and NexGen are not registered financial advisors, so please do your own research before trading & investing anything. This is information is for only research purposes not for actual trading & investing decision.
#debadipb #profitsolutions


R-0196 Short Term Cash Buy M&M @642.25-645.25 SL 630.7 TGT 667Short Term Cash Buy M&M @642.25-645.25 SL 630.7 TGT 667
Above VWAP and bearish reversal pattern so we expect more upside also followed by MACD cross over.

M&M IF THE PRICE RISES AND FALLS AT 629 THEN IT WILL MOVE DOWNWIF THE PRICE RISES AND FALLS AT 629
THEN IT WILL MOVE DOWNWARDS UP TO 623.


Time to book profits in M&MAt weekly resistance. Time to book profits.
one can short with stop loss 520.
Expecting good returns though risky.

complicated TA doesn't work. keep technical analysis as simple as possible. today i missed this bounce, from support.

this post only for whom, who invest for long term. it's also interesting for learning. once jessie livermore said - investor are bigger gambler than traders.


Mahindra & MahindraOn a monthly chart M&M seems to reached to previous congestion zone and it look like strong support on long term chart. The worst draw down seems to 10% from hereon but upside seems to be decent as MACD histogram is reversing. Seems to be good entry point for long term indicator.
Disclaimer: I am not SEBI registered analyst. This is not a buy or sell recommendation but it is for educational purpose only.


M&MThird attempt to cross resistance and failed. Down can be seen 700 with sl 820. I may Be 100% wrong.
Simple charts, easy money
Chart for study purpose only

Mahindra ranging in Symmetrical Triangle of Wave 4It is correcting Wave 4 of Wave C in a consolidated triangle pattern, which is a continuation pattern. The break shall take the prices down to complete Wave 5. Kindly find the below attached chart to look for targets.
