0.71 USD
3.46 B USD
7.63 B USD
About PT Bank Central Asia Tbk
Sector
Industry
CEO
Gregory Hendra Lembong
Website
Headquarters
Jakarta
Founded
1955
ISIN
US69368G1058
FIGI
BBG000HH0351
PT Bank Central Asia Tbk provides commercial banking and other financial services. It operates through the following segments: Loans, Treasury, and Others. The firm offers deposits account, transaction banking, electronic banking, cash management, credit cards, bank assurance, credit facilities, bank guarantees, export-import facilities, foreign exchange facilities, and investment products. The company was founded on August 10, 1955 and is headquartered in Jakarta, Indonesia.
Related stocks
Stock BBCA Hi all,
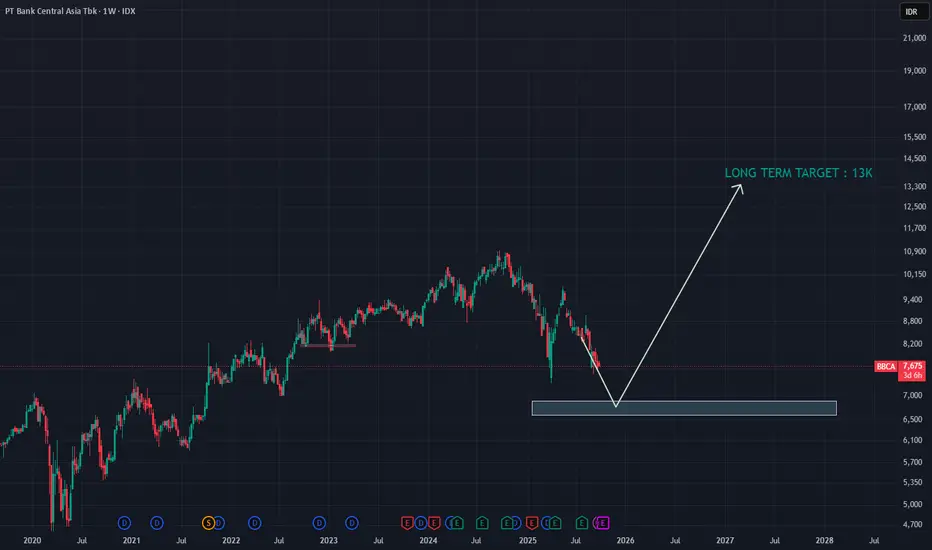
Just an idea..
for BBCA sangkuters & longterm holders..
Maybe if you have extra cash, can make entry to strong support around 6.6-7k..
Then you can hold for another 2-3 years..
your extra longterm target would be 13k..
Have a nice day..
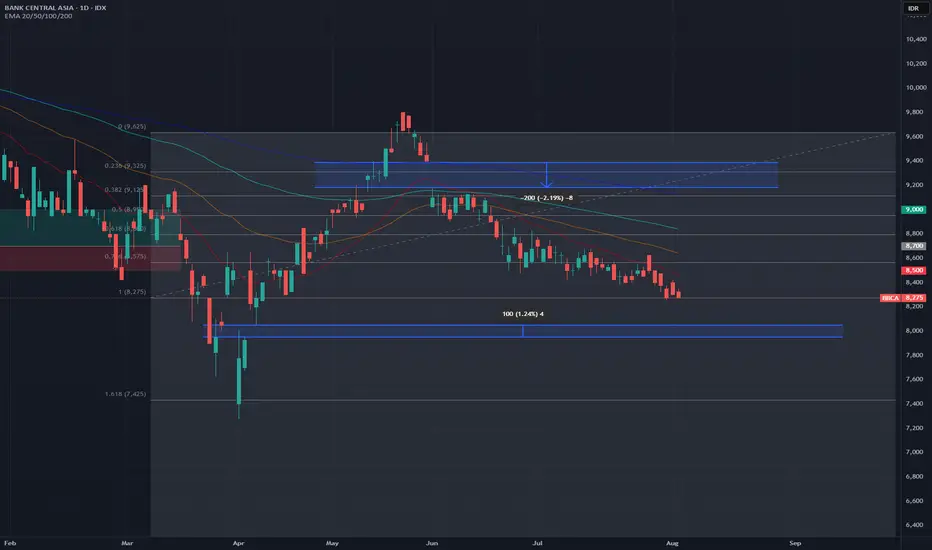
BBCAShort Term: There is a chance of a rebound to the 8,400 – 8,600 area if the 7,800 support holds.
Medium Term: As long as the price has not broken through and remains above 9,000, the trend is still likely to decline.
Important Levels:
Support: 7,800 – 7,600
Resistance: 8,600, then 9,600 – 10,000
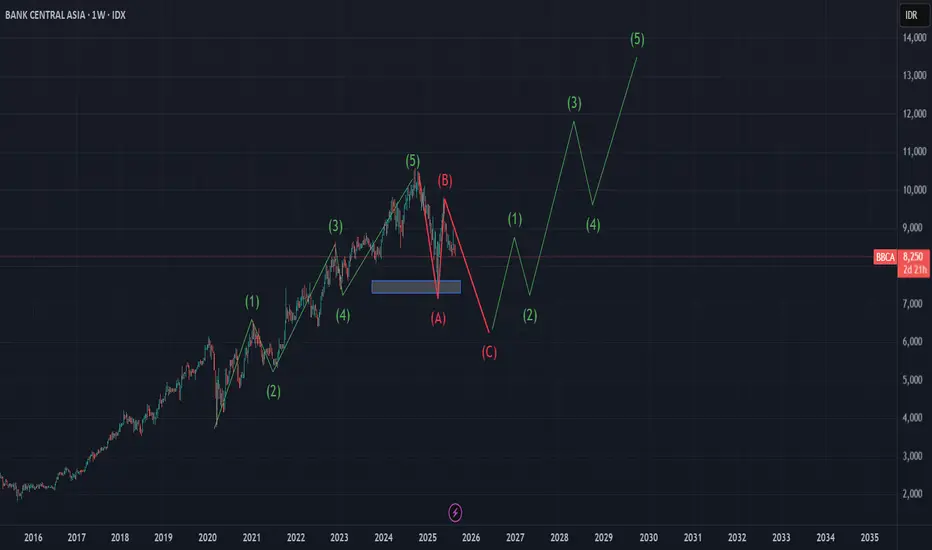
BBCA Elliott Wave Analysis: A Potential C-Wave Correction BeforeBased on a technical analysis using Elliott Wave Theory on the weekly timeframe, BBCA stock appears to have completed a significant 5-wave impulsive cycle (a major bullish run) since its 2020 lows. Currently, the price is in an A-B-C corrective phase, which is a natural occurrence after a strong upt
BBCA - Strong weekly candleBBCA finish this week with strong bullish candle and nice inflow with accumulation.
This week BBCA will face Daily key level at 9900 and potentially BBCA will turn back to Weekly key level at 9300 then bounce back to next Weekly key level 10400.
Other scenario is BBCA will break Daily Key level 9

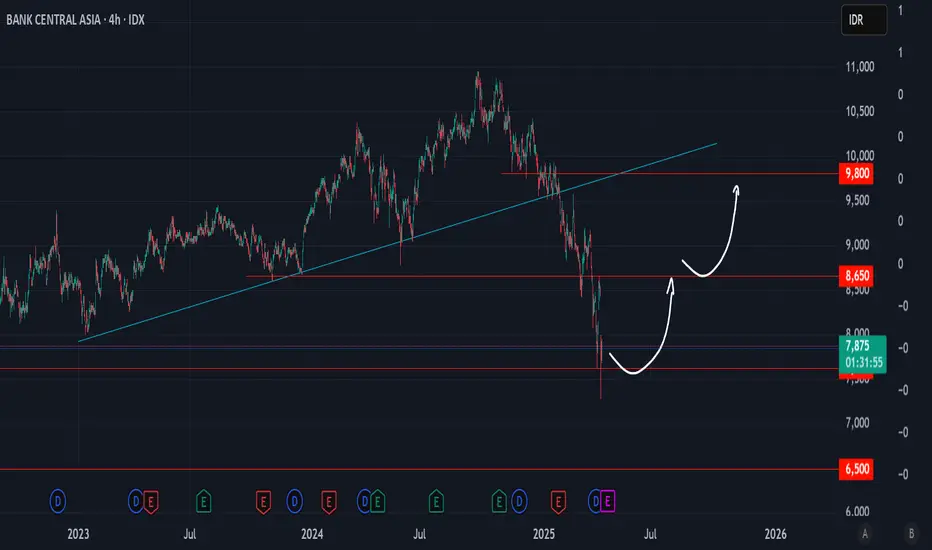
BBCA One of the best timesOne of the best times to buy blue chip stocks from Indonesia which is currently discounted 30% from ATH
Quite simple, if it breaks and closes below 7600 then the bearish trend will continue and maybe we will meet 6500, but if 7600 is strong then we will likely push up with the first target at 8600 t
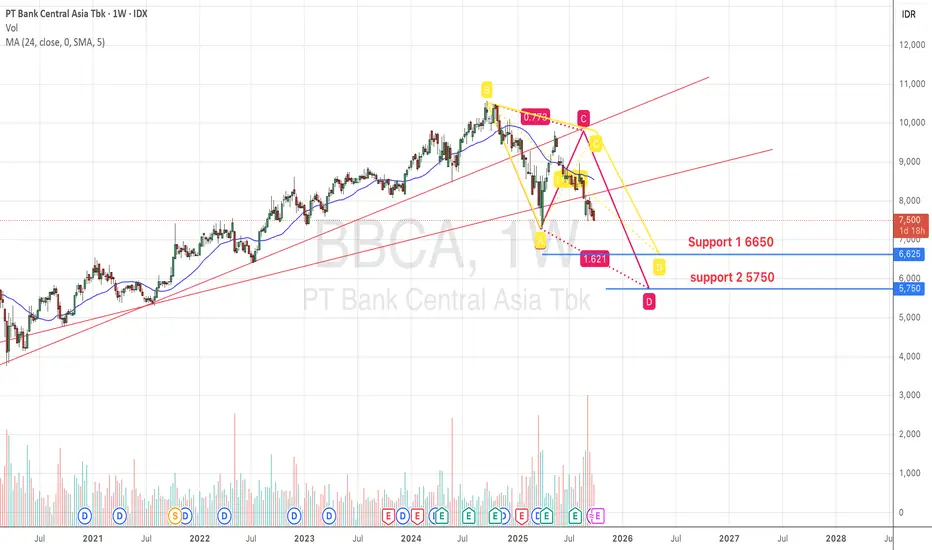
BBCACurrently BBCA still in bullish trend, I see BBCA will potential correction. If BBCA correction will going to :
support 1 6500
support 2 5500

BBCA My Personal Investment LevelIndonesan BBCA share, personally I'll only start to look for buy while price below 8775. Below 8775 would be ideal for investment.

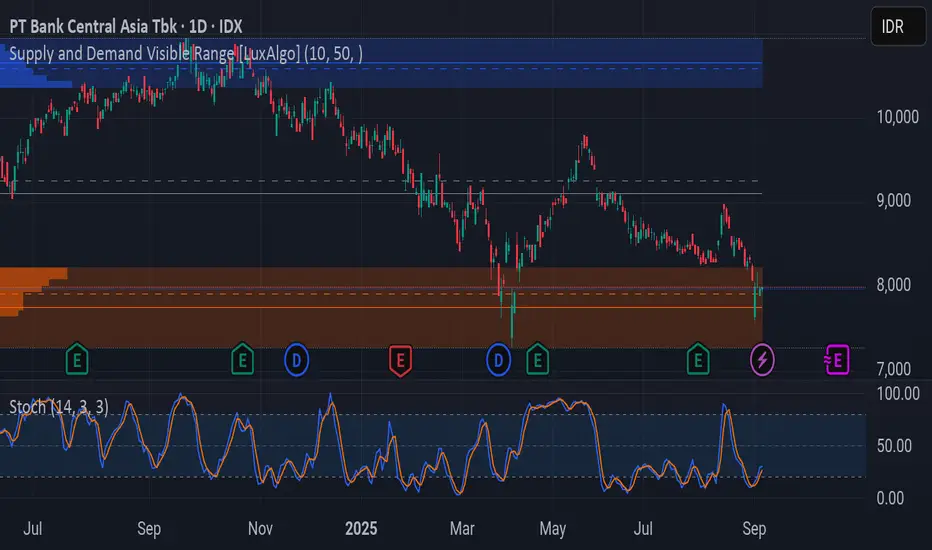
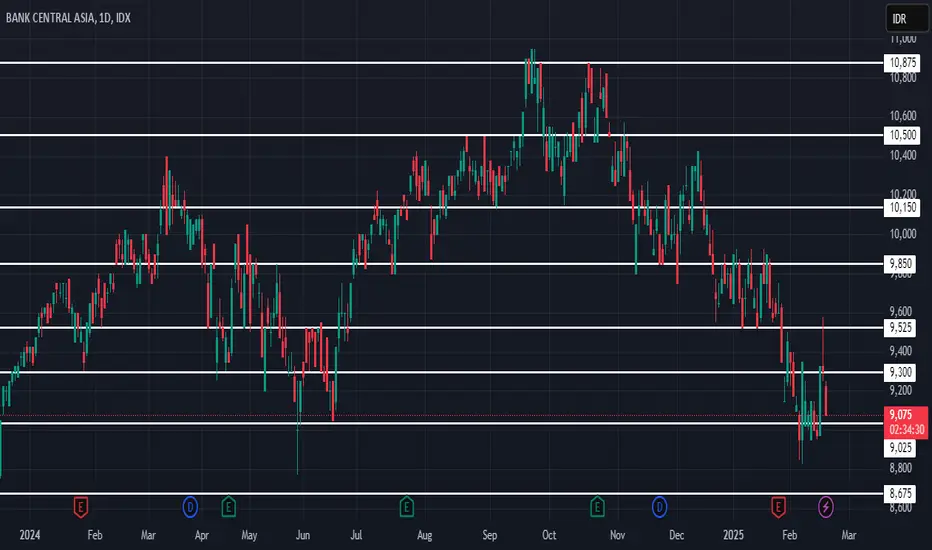
Technical Analysis BBCASupport Levels:
8,675 (Major Support)
9,025 (Minor Support, currently being tested)
Resistance Levels:
9,300 (Nearest Resistance)
9,525 (Next Resistance)
9,850 (Main Resistance in the Short Term)
Trading Plan
1. Buy Area (Entry Point):
Aggressive Buy: 9,025 – 9,100 with a target of 9,300 – 9,525.
C
See all ideas
Summarizing what the indicators are suggesting.
Oscillators
Neutral
SellBuy
Strong sellStrong buy
Strong sellSellNeutralBuyStrong buy
Oscillators
Neutral
SellBuy
Strong sellStrong buy
Strong sellSellNeutralBuyStrong buy
Summary
Neutral
SellBuy
Strong sellStrong buy
Strong sellSellNeutralBuyStrong buy
Summary
Neutral
SellBuy
Strong sellStrong buy
Strong sellSellNeutralBuyStrong buy
Summary
Neutral
SellBuy
Strong sellStrong buy
Strong sellSellNeutralBuyStrong buy
Moving Averages
Neutral
SellBuy
Strong sellStrong buy
Strong sellSellNeutralBuyStrong buy
Moving Averages
Neutral
SellBuy
Strong sellStrong buy
Strong sellSellNeutralBuyStrong buy
Displays a symbol's price movements over previous years to identify recurring trends.