Rolls-Royce is Going to the Moon (Literally)Its Friday night and here I am with nothing better to do than write an article on what I think is one of the most interesting companies on the market. I am absolutely enamored by Rolls-Royce for reasons I am going to explain in depth. I don't want my idea to be long and boring so I'm going to get straight to the point and explain as best as I can in a few paragraphs. There's a lot of information I want to share with you about this company so I will break the idea up into sections for an easier and more enjoyable reading experience.
Normally I would start my idea writing about the intrinsic value, I'm going to skip that because this company is incredibly overvalued as per the numbers I ran. By the end of this idea hopefully you might learn something new or find value in my writing, I am writing this idea for educational and entertainment purposes. In no way does this idea constitute financial advice but rather provide you with the all the information required to make intelligent and rational financial decisions based on facts, I am not one to be speculating about the market, I prefer to have good reasons to make investments.
As a capitalist, one of the most important things I think about before making a financial decision, is how does the company I am interested in make financial decisions. In this section I will write about how Rolls-Royce uses capital primarily to fund long-term strategic investments in R&D, advanced manufacturing, and new technologies (e.g., SMRs, electric systems), and for efficient working capital management to support day-to-day operations and a strong balance sheet.
A significant portion of capital is invested in R&D to maintain a competitive advantage and innovate. This includes developing new engine technologies (like the UltraFan and the Pearl engine family), improving engine efficiency and durability ("time on wing"), and exploring lower-carbon solutions such as sustainable aviation fuels (SAF), hybrid-electric propulsion, and small modular nuclear reactors (SMRs).
Rolls-Royce invests in property, plant, and equipment. Recent examples include investments in its manufacturing facilities (such as the £300 million investment at the Goodwood facility) to enhance capabilities for bespoke projects and improve operational efficiency.
The company focuses on the efficient management of short-term assets and liabilities to ensure robust liquidity and the ability to meet day-to-day expenses. Key aspects include:
- Inventory management: Balancing stock levels to support production and MRO (Maintenance, Repair, and Overhaul) services while avoiding excess inventory.
- Receivables collection and payables management: Optimizing cash flow by managing customer relations and supplier payments strategically. The business model for civil aerospace, where revenue comes from engine servicing based on flying hours (Long-Term Service Agreements), heavily influences its working capital dynamics and provides a stable cash flow stream.
Rolls-Royce makes strategic portfolio choices, using capital for acquisitions in key growth areas (e.g., a yacht automation business) and using proceeds from divestitures of non-core activities to reallocate resources to higher-return segments.
A primary goal is maintaining a strong balance sheet with an investment-grade profile. Once this strength is assured, capital is used for shareholder distributions, including reinstating and growing dividends and engaging in share buybacks (e.g., a £1 billion share buyback announced for 2025).
Rolls-Royce is currently executing a share buyback program to return up to £1 billion to shareholders. The program was announced on February 27, 2025, and is expected to be completed no later than December 31, 2025.
The buyback aims to repurchase up to £1 billion worth of shares by the end of 2025. As of July 31, 2025, £0.4 billion (£400 million) had been completed. The purpose is to reduce share capital and fulfill obligations from employee share plans, which should increase earnings per share. UBS AG London Branch is managing the purchases on the London Stock Exchange and other exchanges, operating under the authority granted at the 2024 Annual General Meeting. This share buyback is part of a larger capital return strategy, including a reinstated dividend, reflecting the company's financial turnaround.
Now I will write about what I find interesting to me about Rolls-Royce;
Rolls-Royce has a partnership with NASA and the UK Space Agency to develop micro-nuclear reactors for lunar habitation and exploration. While a full reactor is not yet built, the collaboration is focused on design, development, and testing phases to have a functional system ready for the Moon by the early 2030s.
Key details about the partnership include;
To provide a reliable, continuous, and powerful energy source for a future human lunar base, especially in permanently shadowed regions of the lunar South Pole where sunlight is scarce or non-existent. Rolls-Royce is developing a small, lightweight nuclear fission micro-reactor that measures about 1 meter wide and 3 meters long. This system would produce around 40 kilowatts (kW) of power, enough for a lunar outpost's life support, communications, and scientific experiments.
Roles in the lunar program;
Rolls-Royce: Responsible for the design and development of the reactor concept itself, leveraging its expertise from decades of building nuclear power plants for the UK's submarine fleet.
NASA: Leads the overall Fission Surface Power project and has awarded separate contracts to multiple industry partners (including Rolls-Royce North American Technologies, General Electric, and Brayton Energy) to develop specific components, such as power converters that turn the reactor's heat into electricity.
UK Space Agency: Provides significant funding to Rolls-Royce for research and development, aiming to get a demonstration model on the Moon by 2029 or the early 2030s.
A conceptual model of the micro-reactor has been unveiled. The focus is currently on detailed design stages and developing power conversion technology, with an open solicitation planned for Phase 2 of the project in 2025. The technology is seen as a crucial stepping stone not only for the Moon but also for powering human missions to Mars and for potential commercial and defense applications on Earth, such as providing clean energy to remote locations.
Under CEO Tufan Erginbilgiç, the company has undergone a "miraculous" transformation from a "burning platform" to a robust, cash-generating business. This has resulted in soaring profits, strong free cash flow, and a significantly strengthened balance sheet.
Rolls-Royce operates in industries with high barriers to entry due to the specialized technology, safety regulations, and huge capital requirements involved. Its large, established base of engines ensures a stable stream of aftermarket revenue.
Management has a history of setting conservative forecasts and then outperforming them, which suggests potential for future positive surprises for investors.
In summary, Rolls-Royce offers a compelling investment case for growth oriented investors willing to pay a premium for a high-quality company with a strong competitive position and clear catalysts for future growth.
Rolls Royce Holdings plc
No trades
Trade ideas

Rolls Royce Bullish biasTechnical Structure
Trend: Overall bullish structure — higher highs and higher lows.
Support zone: Around $14.80–$15.00, aligned with the lower Quarter VWAP band.
Resistance zone: Around $16.50–$17.00, near previous swing highs.
Momentum: Stabilizing after a pullback; candles show smaller ranges, hinting at reduced volatility before a potential breakout.
Forecast (Blue Projection)
The blue arrows in your chart outline two possible bullish continuation scenarios:
Primary Scenario – Gradual Recovery and Breakout
Price may retest support near $15.00, forming a higher low.
Then a rebound toward $16.00–$16.50 could occur.
If momentum builds and volume increases, the price might break above $17.00, continuing the long-term uptrend.
Alternative Scenario – Extended Consolidation
If price remains capped below $15.80, a sideways phase between $15.00–$16.00 could develop before another breakout attempt later.
Summary
Trend: Bullish bias
Short-term view: Consolidation near VWAP support
Medium-term target: $16.50–$17.00
Key support: $14.80–$15.00
Risk: Breakdown below $14.80 would invalidate the bullish setup

When will RYCEY see $20.00?Based on lows and highs the latest you can see $20 is April 2026.
If we keep the current trend you can see $20.00 around New Years.
If bullish news hits You can see $20.00 any day.
RSI can trend up to 85% without questioning anything.

ROLLS ROYCE WAS AN ABSOLUTE BUY AT 100 PSYCHOLOGICAL AREA Rolls Royce was an absolute buy at 100 psychologycal area last week,and in fact it reacted with an epic bounce.
By the way, looks like other juicy targets are still available for long term investors.
After a massive collapse in price started on january 2014, the price seems to have found a bottom last week.
Actually, we are still at prices seen even 15 years ago in 1996, so for investors who truly believe in the company, this looks like a great oppurtunity to accumulate some positions, without looking too much to the possible turbolences that we could see on next months.
In case the world would come close to an end(lol),there is also the support in green, that was the absolute bottom of the whole company history in 2003.

Rolls Royce PLC Macro Swing Short - Elliot Wave CountLooking for this impulsive wave 3 to end around 1189 and above. Once target zone is hit look for short setups. This could potentially be a year long swing short back down to previous ATH/400. Where again you could be looking for a potential swing long back up to ATH. Note Wave 3 are usually the most extended and impulsive wave. A wave 4 correction should be at least 1/3rd the length of Wave 3.

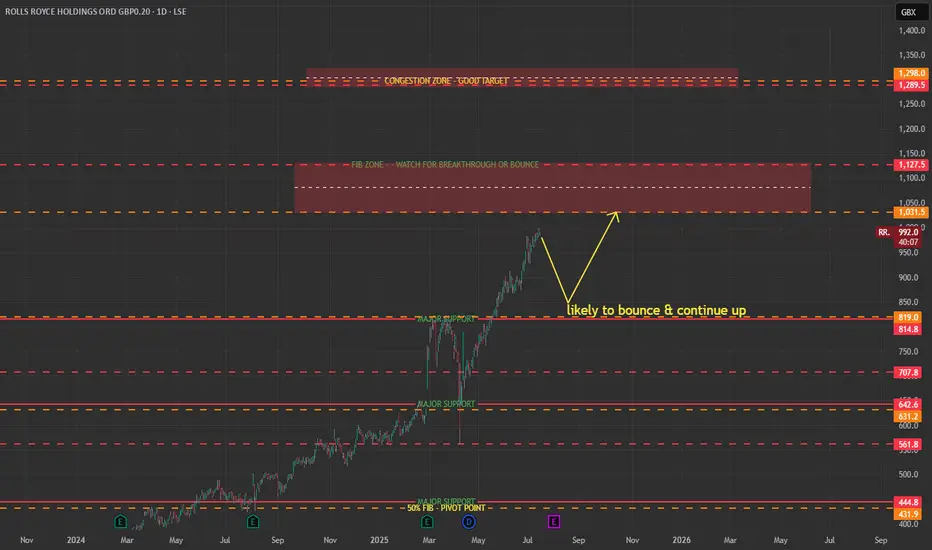
Rolls-Royce Wave Analysis – 29 August 2025
- Rolls-Royce reversed from round support level 1000.00
- Likely to rise to resistance level 1100.00
Rolls-Royce recently reversed from the support zone between the round support level 1000.00 (former resistance from July), support trendline of the daily up channel from May, lower daily Bollinger Band and the 50% Fibonacci correction of the upward impulse from July.
The upward reversal from this support zone stopped the earlier short-term ABC correction (ii).
Given the clear daily uptrend, Rolls-Royce can be expected to rise to the next resistance level 1100.00 (which stopped the earlier impulse wave i).

Rolls Royce on a MONSTER of a run.Shares are up roughly 1500% since November 2022 and my first thought was who is buying all these cars, but quickly realised that it was all the "other" engines and equipment that they produce and especially defense contracts that are powering this whopper of a rally.
Either way a truly monster run that might be about to continue after its recent pullback.
Worth a watch.

Market Watch: Rolls Royce📈 Since April, the stock has almost doubled, running in a very strong bull trend. Right now though, it looks like that move is pausing:
• Current resistance around 1111.5 vs. the previous high of 1109 → clear consolidation zone
• Loss of upside momentum with the daily RSI flattening
• Key support sits at 1051, with a notable gap between 1008–1037 (exhaustion gap or measuring gap?).
On the weekly chart, the trend is still very extended, underpinned by the 55-week moving average. We’ve often seen mean reversion back to the 20-week MA, which currently sits at 903.
🔎 Bottom line:
• This market remains in a bull trend above the 55-week MA
• A corrective dip lower is possible, but not necessarily a reversal
• A pullback to the moving average could actually be healthy.
👉 Watching closely for whether this is just consolidation — or the start of a bigger correction.
Disclaimer:
The information posted on Trading View is for informative purposes and is not intended to constitute advice in any form, including but not limited to investment, accounting, tax, legal or regulatory advice. The information therefore has no regard to the specific investment objectives, financial situation or particular needs of any specific recipient. Opinions expressed are our current opinions as of the date appearing on Trading View only. All illustrations, forecasts or hypothetical data are for illustrative purposes only. The Society of Technical Analysts Ltd does not make representation that the information provided is appropriate for use in all jurisdictions or by all Investors or other potential Investors. Parties are therefore responsible for compliance with applicable local laws and regulations. The Society of Technical Analysts will not be held liable for any loss or damage resulting directly or indirectly from the use of any information on this site.


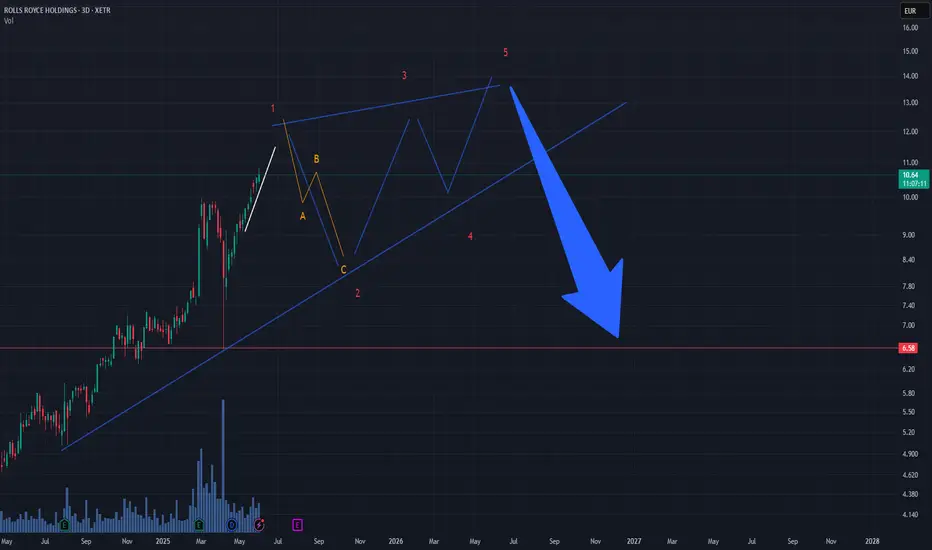
Rolls-Royce – Alarm Bells Ringing: Ending Diagonal Risk3-Day Chart
PATTERN
• The rise from 6.58 € is unfolding as a corrective wave,
sketching a classic five-leg **Ending Diagonal**.
• Overlapping candles, slowing momentum and converging
trendlines confirm the terminal nature of the move.
KEY GUIDELINES
1. **White rising trendline** = last line of bullish defence.
2. A clean break of that line can launch a volatile,
stop-hunting **B-wave**—often beginning with either
a gap or a single long bar.
3. Precise prices on the sketch are **place-holders**;
the diagram shows structure only, not actionable levels.
TRADER NOTES
• While the trendline holds, the diagonal may extend a bit
higher, but reward-to-risk shrinks fast.
• Once support snaps, expect sharp whipsaws before any
sustained decline; size down and avoid heavy leverage
in this zone.
RR > Gate Closed >Recent price action suggests a potential double-bottom formation near the prior resistance level at the current low of circa 530's. A failure to break above this level could lead to further downside pressure, with the next support level anticipated around the psychological level of 500.😍

Rolls Royce ShortFrom my previous post, I have now opened shorts with targets around 250~ partials taken along the way.

Rolls Royce about to peak? Expecting a sell opportunity at the 4.236 Fib Extension. Eye's on £555, my target is around £210.

Will Rolls Royce print 60% correction to 180p?Since the long idea (linked below) price action has melted up 600% in only 21 months. Astonishing. A plethora of long ideas are now published, including on this platform.
The Motley Fool, July 11th - recommended buy
“Rolls-Royce’s share price looks very undervalued to me, with strong business growth prospects, and an investment-grade rating adding to the firm’s allure.”
People actually pay money for this rag. This analysis from WW is free.
Businessinsider, June 26th - According to TipRanks, RR stock has received a Strong Buy
“Deutsche Bank Stays Bullish on Rolls-Royce (RR) Amid Industry Headwinds”
It goes on..
“Menard is a five-star-rated analyst as per the TipRanks Star Ranking tool. Through this tool, TipRanks monitors the performance of many financial experts, ranking them based on their success rate, average returns, and statistical significance.”
It is fascinating to see so many turn bullish at this time. It is a reminder why so few traders (and hedge funds) succeed. Greed.
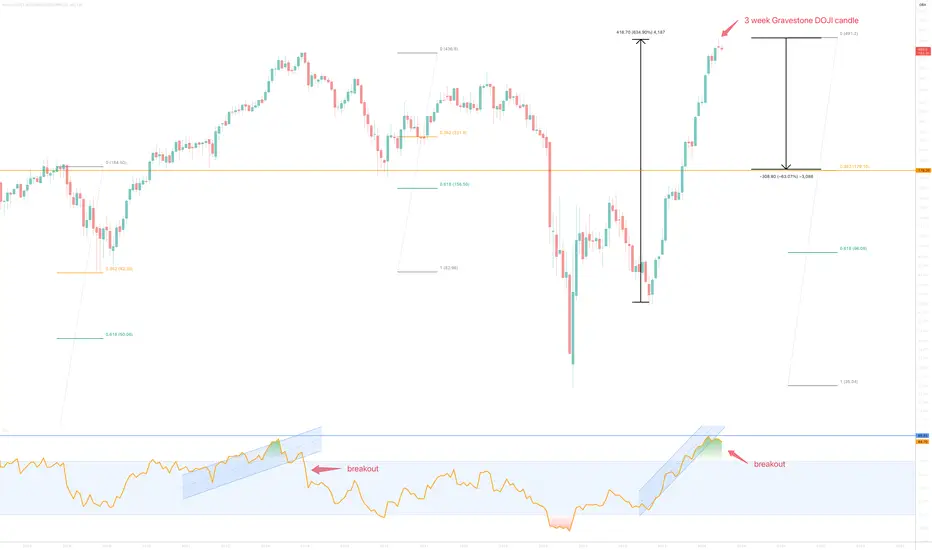
** The Technical Analysis **
On the above 3 week chart we have:
1) RSI touches 89.3 (blue line), it has never been at this level in the entire history of the business. I remind you this is a 3 week chart. The entire history is shown below. These are bubble levels of strength recorded on the RSI index.
2) RSI support prints breakout. Look left.
3) The Gravestone DOJI candlestick prints across multiple timeframes, including this chart.
4) Why 60% correction? Significant market corrections in the stock were always arrested at the same levels when looking left.
4a) Annual support (yearly candles).
4b) The Fibonacci 0.382. In 2016 the correction was even further, down to the 0.618
The orange line is where both those conditions 1st confirm.
Is it possible price action continues up like the financial rags claim? Sure.
Is it probable? 100% no.
Ww
RSI big picture 3 week
ROLLS-ROYCE HOLDINGS PLC*safe investment opportunity - low risk*
Each candle on the above chart represents 6-months of price action. You can be sure not many people are studying this time frame.
A new candle was printed at the close of 2020 following an astonishing 80% correction since mid-2014. We can see previous price action resistance from dot.com bubble is now winning strong support during the ‘everything bubble’ resulting in the printing of a Dragonfly DOJI candle. Cleary buyers were keen to get exposure to this oversold stock.
An ‘incredible buy’ opportunity is now indicated on the 10-day chart below following an oversold condition (orange column). Price action currently finds support in the bullish half of the Bollinger Band as volume increases.
A buy from 66-100p is amazing if you can get it.

The RR tea leaves confirm take-off from gate 435 The RR tea leaves confirm take-off from gate 435 with a cup with a handle printed and an initial target suggesting a potential up-target move of some 9-10% i.e. onward flight path upwards into the 470's zone. Meanwhile, the cup with handle also unfolded on the SP500 after breaking out of the clouds on the daily time frames on May 10 and its trading range above 5250 and is now heading north towards high 5's 5555 - IMOO DYOR GLA

Bull Put Rolls Royce (London) Bull Put 440/520 for 15 Nov'24
Sell Put 520
Buy Put 440
Risk Reward 1.6.

RYCEY - potential C&HRYCEY seems to have complete a 5-count EW cycle and is due for a correction. This correction would create the handle of the C&H pattern, fulfillment of the pattern would launch RYCEY into another 5-count EW cycle potentially returning it to pre-COVID share prices.

Rolls Royce is facing a long-term resistance lineWeekly chart, the stock is facing a long-term resistance line (started Jan 2014, dashed grey-colored line); so it needs strong bullish power to beat.
After crossing this resistance, the target will be 615
Technical indicators: MACD is positive, RSI is showing over-bought - which indicates tendency to have some correction.

RYCEY to continue north towards $3.50 areaLooking for RYCEY after 5 months of consolidation to continue to move to the upside with a target of $3.50.
This is a long term hold for me, but looking for 100% gains at the very least.

Trade the News: Part 1 - StocksTrading newsflow isn't an exclusive privilege reserved for professional traders with access to extensive teams of analysts.
With a bit of preparation and a dose of discipline, any trader can tap into the added volume and volatility that news injects into the market.
In this two-part series, we present a 3-step template for trading scheduled news events in both the stock and forex markets. Let's dive in and explore the fast-paced world of news-driven trading.
Stock Market News: Volume & Volatility
The Beauty of Being a Short-Term Trader:
Short-term traders thrive on nimbleness and the ability to navigate both sides of the market dynamically. This approach values volume and price volatility—two factors that flourish with newsflow, the release of new information into the market.
Scheduled and Unscheduled Newsflow:
Scheduled Newsflow:
Events with set release dates and times, including earnings reports, economic indicators, and planned corporate announcements. Traders can prepare, analyse expectations, and strategize for these events.
Unscheduled Newsflow:
Unforeseen events that can occur at any time, such as surprise takeover bids, unexpected geopolitical developments, or unscheduled profit warnings. While unscheduled events often have the most significant impact on stock prices, they are less predictable and require considerable experience to navigate effectively.
Finding the Sweet Spot:
While we appreciate the volume and volatility that news brings, preparation is key. The sweet spot is a news event that can be planned for but has the potential to bring substantial volume and price volatility. This series will specifically focus on how to trade scheduled newsflow.
3-Step Method for Trading a Scheduled News Event: E.R.T.
Step 1: Expectation:
This step involves doing background work to set the scene. Understand the exact time and nature of the event, along with both theoretical and real-world expectations.
Theoretical Expectations: Analyst forecasts provide a benchmark, and CEO comments from prior updates may offer insights.
Real-World Expectations: Reading the market and making judgments on price action leading up to an event help gauge real-world expectations.
Step 2: Reaction:
The market’s reaction to the newsflow is crucial. Three types of reactions include:
The Damp Firework: A tepid reaction, indicating that the news was in line with real-world expectations.
The Grower: A mild reaction backed by a strong beat on theoretical expectations, creating intra-day trends.
The Shock: A clear and obvious reaction, involving an opening gap and potential for powerful trading setups.
Step 3: Trade:
This step involves combining the news-based catalyst with a technical catalyst. There are many ways to do this (check out our Power Patterns series – link at bottom of the page), but the best place to start is by trading breakouts from key levels.
What is a key level? This is a support or resistance level that is clearly visible on the daily candle chart and across multiple timeframes.
How do I enter? Traders may enter on the first pullback on the hourly candle chart following the breakout. This will ensure that you’re not chasing the market and should assist you in keeping calm during the intense heat of a news-driven breakout.
How do I manage my risk? Stops can be placed below the swing low of the first pullback (above if trading a bearish breakout). A simple 2:1 reward ratio is a robust method for taking breakout profits. More sophisticated methods can be refined over time, such as taking partial profits on the first sign of exhaustion and trailing stops on the remainder of the position below hourly swing lows.
Case Studies:
Experian Half Year Results
1. Expectation
Theoretical expectations were set by Experian’s board prior to the Half Year Results – 5% organic revenue growth and benchmark EPS of $0.70.
Real world expectations looked mildly negative with prices carving out a broad series of lower swing highs. Prices were not oversold heading into the publication of the Half Year Results.
EXPN Daily Candle Chart
Past performance is not a reliable indicator of future results
2. Reaction
The initial reaction on the hourly chart was clearly bullish with prices gapping higher and maintaining their gains during the opening rotation.
Experian had comfortably beaten both theoretical and real-world expectations – we have confirmation that a news-based catalyst is in place.
EXPN Hourly Candle Chart
Past performance is not a reliable indicator of future results
3. Trade
There were two opportunities to buy pullbacks on the hourly candle chart following the news-driven breakout. Timing your entry into pullbacks can be refined by drawing a simple trendline which tracks the pullback – a close above the pullback trendline can trigger your entry.
EXPN Hourly Candle Chart
Past performance is not a reliable indicator of future results
Rolls Royce Capital Markets Day
1. Expectation
A Capital Markets Day is a chance for the CEO to sell the company’s strategy to shareholders. Real world expectations were high with the shares locked in a powerful uptrend. However, it’s important to note that prices did not look overbought heading into the event.
RR. Daily Candle Chart
Past performance is not a reliable indicator of future results
2. Reaction
The markets’ reaction was decisively bullish with prices breaking well clear of resistance during the opening rotation. This gave traders clear evidence that there was a news-based catalyst supporting the stock.
RR. Hourly Candle Chart
Past performance is not a reliable indicator of future results
3. Trade
Following the initial breakout move prices puled back within a low volatility flag formation – creating the ideal point of entry with a stop below the flag lows. This example clearly demonstrates the power of combining new-based and technical catalysts to create strong trade setups.
RR. Hourly Candle Chart
Past performance is not a reliable indicator of future results
Disclaimer: This is for information and learning purposes only. The information provided does not constitute investment advice nor take into account the individual financial circumstances or objectives of any investor. Any information that may be provided relating to past performance is not a reliable indicator of future results or performance. Social media channels are not relevant for UK residents.
Spread bets and CFDs are complex instruments and come with a high risk of losing money rapidly due to leverage. 84.01% of retail investor accounts lose money when trading spread bets and CFDs with this provider. You should consider whether you understand how spread bets and CFDs work and whether you can afford to take the high risk of losing your money.

Rolls-RoyceFounded in 1904, Rolls-Royce plays a significant role in the global economy up to date. The company operates in different economic sectors and serves a broad market:
Civil Aerospace:
1. Major airlines: They supply engines to leading airlines worldwide, including Emirates, Singapore Airlines, Lufthansa, and American Airlines.
2. Aircraft manufacturers: They work closely with Airbus and Boeing, providing engines for their commercial aircraft models.
3. Leasing companies: Leasing companies like GE Capital Aviation Services (GECAS) and AerCap are also customers, acquiring Rolls-Royce engines for their fleets.
Defense:
1. Governments and Armed Forces: They supply jet engines and propulsion systems for military aircraft used by air forces and navies around the globe.
2. Defense contractors: Major defense contractors like Lockheed Martin, Northrop Grumman, and BAE Systems rely on Rolls-Royce engines for their aircraft programs.
Power Systems:
1. Shipbuilders and ship owners: They provide engines and propulsion systems for various types of ships, including cruise ships, container ships, and offshore vessels.
2. Industrial companies: Industrial users like power generation companies, mining operations, and data centers utilize Rolls-Royce engines for power generation and other applications.
3. Railroad operators: Locomotive manufacturers and rail operators purchase Rolls-Royce engines for their trains.
Electrical Aviation:
1. Aerospace companies and startups: As they develop electric and hybrid-electric aircraft, these companies look to Rolls-Royce for expertise and potentially, propulsion systems.
2. Governments and regulatory bodies: Collaboration with these stakeholders is crucial for shaping the future of sustainable aviation and integrating new technologies.
We will be looking at adding Rolls-Royce to our portfolio as the company strives to shape the future of energy and mobility.
