LOVING THIS INSTRUMENT This instrument has been really kind to me and I thought I'd share it with others. This may run to 780 by the end of the year. Keep an eye on it!!!
Trade ideas

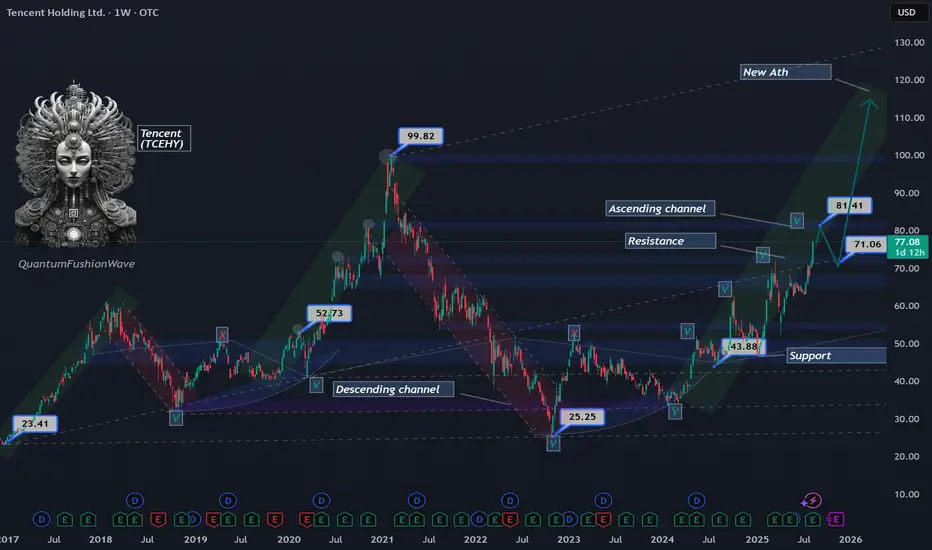
Tencent at $77: Breakout or Fakeout at $81?Tencent Holdings Ltd. (TCEHY) is trading around $77 and approaching a critical resistance zone at $81. A clean breakout above $81 would open the path for price to challenge its previous all-time highs, signaling strong continuation within its bullish structure.
However, $81 also aligns with a key historical resistance from November 2020, making it a level to watch for potential rejection. If price fails to break through, a retracement toward the $71 support zone could unfold, providing a healthy reset within the broader uptrend.
Should the $71 area hold as support and buying momentum resume, Tencent could mount a rally toward the $100 mark, reinforcing its longer-term bullish channel.
Key levels to watch:
Resistance: $81 (critical breakout level)
Support: $71 (retracement target)
Upside target: $100 if bullish momentum continues
Tencent Holdings – Potential Wave Count and ForecastAs current price action unfolds, a Wave 5 (gray) forming as an ending diagonal appears to be the most likely scenario. However, the micro count remains open to interpretation and may differ slightly. Continued observation should eventually provide clarity and confirmation at the lower degrees.This ending diagonal seems to be approaching completion. A sudden reversal could suggest that Wave 4 (pink) within the diagonal is not yet finished, as the recent downward move resembles a single impulse rather than a full ABC correction. That said, this alternative is less probable given that, by the rules of a contracting ending diagonal, Wave 4 (pink) should be shorter than Wave 2 (pink). Structurally, the current labeling still fits well with Wave 4 (pink) already being completed.For now, the focus should shift to the upside, watching for a developing ABC structure within Wave 5 (pink), which would complete both the ending diagonal and the larger-degree Wave 5 (gray). Upon completion, we should anticipate a significant correction. Based on current wave dynamics, this gray Wave 5 is likely to end in a truncation or produce only a marginal new all-time high.
Disclaimer: This analysis is for informational and educational purposes only and should not be considered financial or investment advice. All trading involves risk, and you should perform your own due diligence before making any trading decisions. The author is not responsible for any losses that may arise from reliance on this content. Always trade at your own risk.

Tencent Holdings back to 700 price level In Feb 2021, that was the peak of Tencent Holdings at 700+ price level.
Currently, we have cleared the resistance at 483.20 and I expect it to break above the 522 price level within the next few months. Once this level is broken up, it should head towards the 700+ price level.
It won't be a straight line up as it was in 2020/2021 so patience is much needed here. With the Chinese government paying a lot of attention to AI, this tech giant is certain to receive incentives/grants to further its plans in AI, cloud infrastructure ,etc.
Any retracement to me is a good accumulation point.

Tencent: Searching for Wave A’s LowTencent’s corrective A-B-C structure is struggling to finish wave A. Our primary scenario calls for a drop toward support at HK$364.80, where wave A should bottom. That should open the door for wave B, followed by a deeper leg down in wave C—into the magenta Long Target Zone between HK$325.60 and HK$229.00. This zone should mark the completion of wave (2), setting up a long-term bullish reversal in wave (3), which may eventually target resistance at HK$715. However, if price breaks below HK$188.60, our wave alt. scenario will take over (36% probability), signaling an even deeper low before the next bullish impulse.
📈 Over 190 precise analyses, clear entry points, and defined Target Zones - that's what we do.

Tencent: Significant Decline!Tencent's stock took a significant hit, creating a noticeable gap in the chart. Nevertheless, for now, our primary assumption remains that the price is currently working on the turquoise wave 3 and will soon move toward the resistance at HK$715. Afterward, a corrective movement should follow during wave 4. However, if the stock falls below the support at HK$364.80, downward pressure will mount significantly and make it increasingly likely that the price will drop to new lows below the nearest marks at HK$261 and HK$188.60 to develop a new low of the large wave alt. in green (probability: 36%).

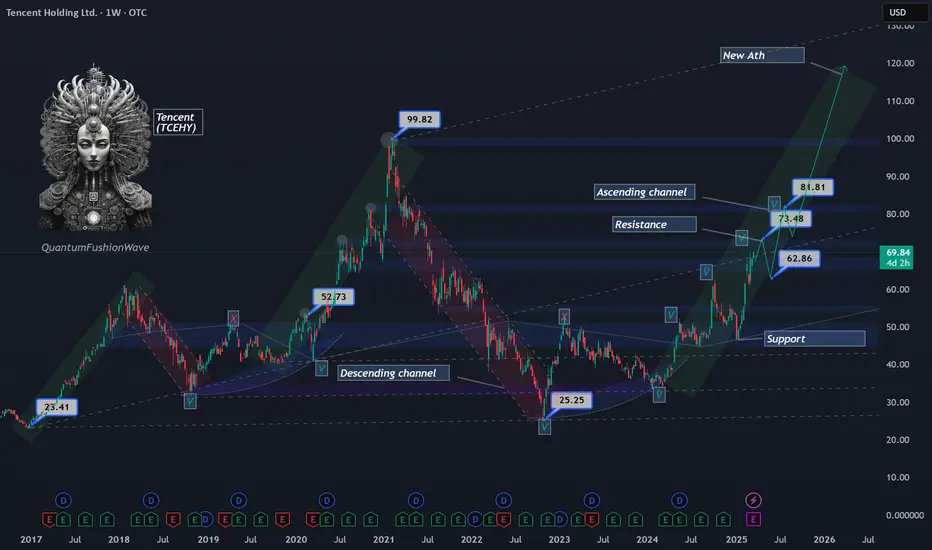
Tencent Holdings (TCEHY) – Technical & Fundamental OutlookTencent Holdings Limited (TCEHY) is currently trading between $62–$64, maintaining structure within a well-defined ascending channel. After testing the $73 resistance level—a key price from 2020—the stock faced rejection, triggering a retracement phase and a shift into a daily consolidation range.
This range now appears to be forming a short-term descending pullback channel, potentially continuing into June–July. Based on historical price action, the next key demand zone sits between $55–$60, a level that served as multi-year support and resistance from 2018 to 2024. A revisit of this zone would likely draw strong buying interest, making it a high-probability long opportunity.
Technical Levels to Watch:
Buy Zone: $55–$59 (long-term structural support)
Mid-Term Resistance: $73 (tested and rejected, but weak)
Breakout Target: $80–$81 (resistance from 2020)
Major Upside Level: $99 (2021 all-time high)
From a macro perspective, Tencent is strongly positioned in China’s growing tech ecosystem, with diversified operations across gaming, artificial intelligence, and quantum technologies. These sectors remain critical to the country's long-term innovation strategy.
If Tencent successfully holds the $55–$60 support zone and regains momentum, a move toward $80–$81 by September becomes plausible. A confirmed breakout above that range would put $99 back on the map, opening the door for new all-time highs into late 2025.
Conclusion:
Current market structure suggests we may be entering a healthy retracement phase within a larger bullish trend. The $55–$59 zone offers a favorable risk-reward area for long-term positions, with strong upside potential as Tencent continues to align with China’s tech-driven growth narrative.

Tencent Holdings LtdIs Tencent Stock a Buy Now?
Tencent posted its third quarter earnings report on Nov. 16. The Chinese tech giant's revenue fell 2% year over year to 140.1 billion yuan ($19.8 billion), which represented its second consecutive quarter of declining revenue since its IPO in 2004. Its net profit rose 1% to 39.9 billion yuan ($5.6 billion). On an adjusted basis, which excludes its investments and other one-time items, its net profit grew 2% to 32.3 billion yuan ($4.5 billion). Those growth rates seem anemic, but Tencent's stock had already been cut in half over the past two years amid concerns about China's tightening regulations, slowing economic growth, and COVID19 lockdowns. So is it the right time to take the contrarian view and buy Tencent as a turnaround play? Let's review its core businesses and valuations to decide.
Tencent generated 31% of its third quarter revenue from its video game business. Domestic games, which include its blockbuster game Honor of Kings, accounted for 73% of that total. The remaining 27% came from overseas hits like League of Legends, Valorant, and PUBG Mobile.Its domestic gaming revenue fell 7% year over year, representing its third consecutive quarter of shrinking revenue, as it grappled with tighter playtime restrictions for minors in China over the past year. Those restrictions also coincided with a temporary suspension on new video game approvals in China, which started last July and ended this April.Its international gaming revenue rose 3% year over year, accelerating from its 1% decline in the second quarter, as new games like Tower of Fantasy and Goddess of Victory: Nikke attracted new players. Unfortunately, its overseas growth still couldn't offset its declining domestic revenue.
As a result, Tencent's total VAS (value-added service) revenue which includes its gaming divisions, social media platforms, and streaming media subscriptions -- declined by 3% in the third quarter but still accounted for more than half of its top line. This core business might gradually stabilize as Tencent expands its international gaming business, but it will likely remain under intense pressure as long as the Chinese government continues to scrutinize the gaming industry.
200$ was one of the biggest support and great opportunity to buying the dip. 300-320$ is a big resistance level for tencent and if bulls win that battle then 350$ is next but
can we back 250 or even 200$ again? YES

Tencent Holdings (TCEHY) Poised for a Breakout Toward New HighsTencent Holdings Limited (TCEHY) is currently trading within a well-defined ascending channel, with price action averaging $68–$69. The key resistance level at $73—a price last seen in 2020—appears weak and could be easily broken, given the company’s strong positioning in China’s expanding economy.
With Tencent’s involvement in gaming, artificial intelligence, and quantum technologies, its growth prospects remain robust. If the $73 resistance is cleared, the next major target is $81. A decisive move beyond this level would set the stage for a potential retest of its 2021 high of $99, with the possibility of surpassing it as Tencent continues to capitalize on new technological advancements.
Given these factors, Tencent could be on track to reach new all-time highs by the end of 2025, making it a key stock to watch in the evolving global tech landscape.
Stock Trading, a more 'calmer' way to tradeFind a trend and stay on trend, take profit when you can and when happy.

TENCENT Buy signal at the bottom of the Channel Up.Tencent Holding (TCEHY) has been trading within a Channel Up since the November 15 2023 High and on Monday it made contact with the pattern's bottom (Higher Lows trend-line). As the 1D RSI turned oversold and rebounded, we believe that this is the best buy opportunity in almost 1 year.
Technically we should see the new Bullish Leg emerge now and a break above the 1D MA50 (blue trend-line) would confirm that, as it did on March 11 2024, which was only broken under again after the new Higher High was priced.
We are targeting a little below the 1.618 Fibonacci extension at $73.00.
-------------------------------------------------------------------------------
** Please LIKE 👍, FOLLOW ✅, SHARE 🙌 and COMMENT ✍ if you enjoy this idea! Also share your ideas and charts in the comments section below! This is best way to keep it relevant, support us, keep the content here free and allow the idea to reach as many people as possible. **
-------------------------------------------------------------------------------
💸💸💸💸💸💸
👇 👇 👇 👇 👇 👇


What catalyst can drives Tencent shares ?Nov 16 2022 will be its Q3 earning report. You can choose to buy before or after depending on how comfortable you are with this company.
The China Tech stocks have been badly bashed due to the regulation clamp down. But, the business model remains strong. Let's be patient as the 20th CPC National Congress will end this week and we can expect to hear some positive news about where they are going to put their focus on moving forward.
I believe the digital economy has a lot of potential in China and more room to grow given the support of the Chinese government.
Please DYODD.

FOMO : Should we chase or not chase ?Using one of my favourite stock as an example, we can see from the weekly chart that price has gone up by 42% from the low of 190.6 which was the first buy zone.
Second buy zone was at 264 price level and the third price was at 348. We can witness the 4th buy zone soon after it breaks above the resistance at 458. As it is a week long holidays in China, the market remain closed. What will happen after a week? I think the FOMO will continue as consumers are not gaining confidence from the government stimulus in both property and stock purchase.
It could also retrace to the 400+ price level , afterall it has rallied continuously for a few consecutive days. A pull back is good !
Don't beat yourself up for missing the lowest price level at buy zone 1 ,it is fine so long as you ride the trend at buy zone 2 and/or 3.

Tencent Holdings (TCEHY) Analysis Company Overview: Tencent Holdings OTC:TCEHY is poised for growth as the regulatory environment in China becomes more favorable, particularly in the gaming sector. The resumption of gaming license approvals has revitalized the market, allowing Tencent to launch new titles that resonate with consumers.
Key Catalysts:
Regulatory Recovery: The easing of regulatory scrutiny around gaming licenses has set the stage for Tencent to reinvigorate its gaming portfolio.
Success of Dungeon & Fighter Mobile: The release of Dungeon & Fighter Mobile has been a standout success, generating $270 million in iOS revenue within the first 30 days. This performance highlights strong consumer demand and effective marketing strategies.
Future Revenue Potential: Analysts forecast that Dungeon & Fighter Mobile could generate between RMB 15-18 billion in 2024, positioning it as Tencent’s most commercially successful game in five years, which bodes well for the company's overall revenue growth.
Investment Outlook: Bullish Outlook: We are bullish on Tencent above $47.00-$48.00, reflecting confidence in its ability to capitalize on the resurgent gaming market. Upside Potential: Our target for TCEHY is $70.00-$72.00, driven by the anticipated success of new game launches and a healthier regulatory landscape.
🚀 TCEHY—Unlocking Growth in Gaming and Beyond. #Gaming #Tencent #MarketRecovery

longer term for Tencent is BullishReferring to the weekly chart, we can see a strong bullish candle piercing above the resistance line at 396.6. With the strong government measures benefitting all sectors (not Banks) , I expect the rally in Tencent to continue with more sales revenues coming in for Labour Day (1st Oct ) and Singles Day......
Let's wait for a good pullback and add more to this amazing company....

0700 Tencent - breaking out to the upside, will it sustain? Tencent breaking out to the upside and moving averages confirms the breakout with 50SMA crossing the 150SMA, both MA are sloping upwards.

Tencent: Gathering StrengthTencent is currently moving sideways. We believe that the price is currently building up momentum and should continue to rise soon. Finally, we expect the magenta wave (3) to end above the HK$416.60 resistance.

ICT Long setup of a Hong Kong stock: Tencent (700)👋Hello Traders,
Our 🖥️ AI system detected that there is an H1 or higher timeframe ICT Long setup in Hong Kong stock : 700 for Swing trade.
Please refer to the details Stop loss, FVG(Buy Zone),open for take profit.
For more ideas, you are welcome to visit our profile in tradingview.
Have a good day!
Please give this post a like if you like this kind of simple idea, your feedback will bring our signal to next better level, thanks for support!

Tencent 0700 - will this breakout be sustained or smashed again?Strong breakout for tencent, to watch over next 6 mths if it sustains or once again gets smashed by the Chinese govt

How about Tencent now ?From the weekly chart, we see a bearish engulfing candle closed for the week. With the negative PMI results and if no positive news next week to prop up the market, then it is likely to go further south towards 310.80. There, I will wait for bullish signal before buying more.

Tencent Holdings updateAfter falling from the peak at 416 on Jan 2023 to a low of 260, it has since recovered by more than 10%. We can see the price level has broke out of the descending wedge and an important support at 295.80 must hold else it will falls back into the channel.
I will be monitoring closely before adding more.....
Please DYODD

TENCENT Weekly Bull FlagLooks like a bull flag is in play. Dips to support could be buying opportunities
