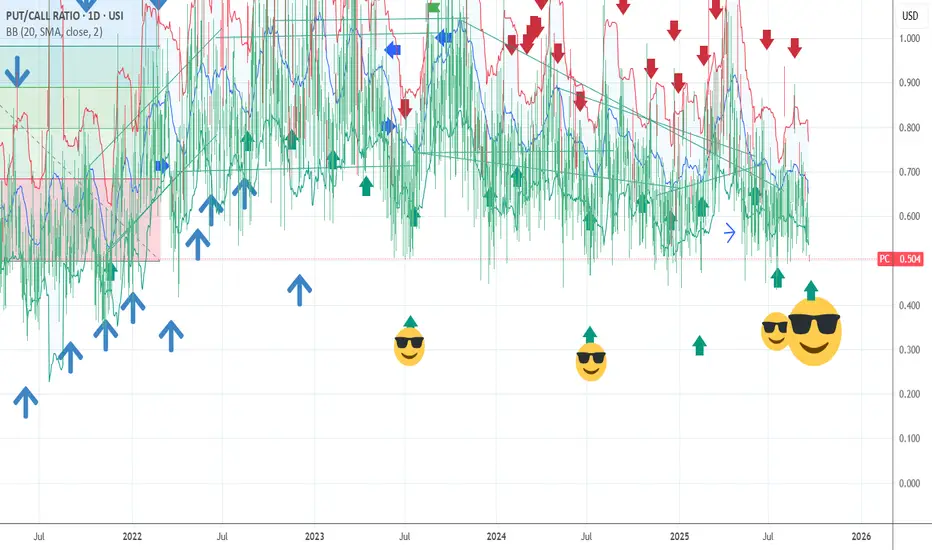
PUT CALL BUY SIGNAL IS NOW GIVEN AGAIN The chart is my work in put/call model I use to take positions . We are now into a level of heavy put buying once again which in MOST not All cases have lead to rally phase . I have taken a 25 % long again after missing the rally on monday but the rally in rsp means they are shifting away from
Related indices

PUT CALL BUY SIGNAL NEW SP HIGHS BY11/19The chart posted is my put call buy and sell model . I moved to a 90 % net long spy qqq smh at and near the lows at which time I moved to add longs to 90 % position .My forecast is calling for the I.T. Top and likely The top from 4/7 low . I have a protection of 6954 to 7031 by 11/19 peak .

PUT/Call sell signal is now been given ! I am now 75% short spy The 5 and 10 day put to call is now in mind blowing zone the 5 day as reached 55% and the 10day is selling up we are now reaching a level based on the options market to see the decline appear into the low due 10/10 to10/20th I have major spirals turn next week and we are into fib relationship on
The put call buy signal wave 5 in short squeeze phase top 9.3The chat is one of my models the other day we help .786 and had a nice ABC down the low is now wave 2 of 5 and we have started in early stage wave 3 of 5 of 5 of 5 next week should be more upside . I will be posting more in detail next week
PUT /CALL SELL SIGNAL IS CONFIRMED The chart posted is my PUT/CALL model based on a 4 hr system I have used in the past to trigger buy and sell signals . I am now stating for the record IT IS NOW SET for and I.T. and long term SELL into the SPIRALS and VIX and BB Bands and we under GANN work I stated time n price july 5 to th

PUT CALL GAVE A BUY SIGNAL TODAY I am looking for 6177/6183 The put/call model has given a buy signal that gives me a New record highsp500 and qqq how it has formed I am long calls at 50 % and 75 short OIL today best of trades WAVETIMER

PUT/CALL MODEL is setup see trend line REACTION TIME I have posted this chart a few times for a reason now based on DSI in QQQ and NDX at record highs the last three TD I thought some may want to learn > best of trades WAVETIMER

PUT CALL MODEL SELL SIGNAL is Been given The chart is my own model Take notice of the green arrows and that trend line Notice anything ??? I do hope so . The trend is your friend till the End Time to hold my Beer ! best of trades WAVETIMER 85 % long puts waiting and hoping for a final POP .

PUT CALL SELL SIGNAL IS NOW IN PLACE I am 100% short The chart posted is the put/call model We popped thru the bb bands I have now moved to a 100 % puts in the money dec 26 on qqq and spy I will add if the qqq can print 494 or the Spy can print and new high The cycle top was due 5/12 is a minor n MAJOR Best of trades Wavetimer

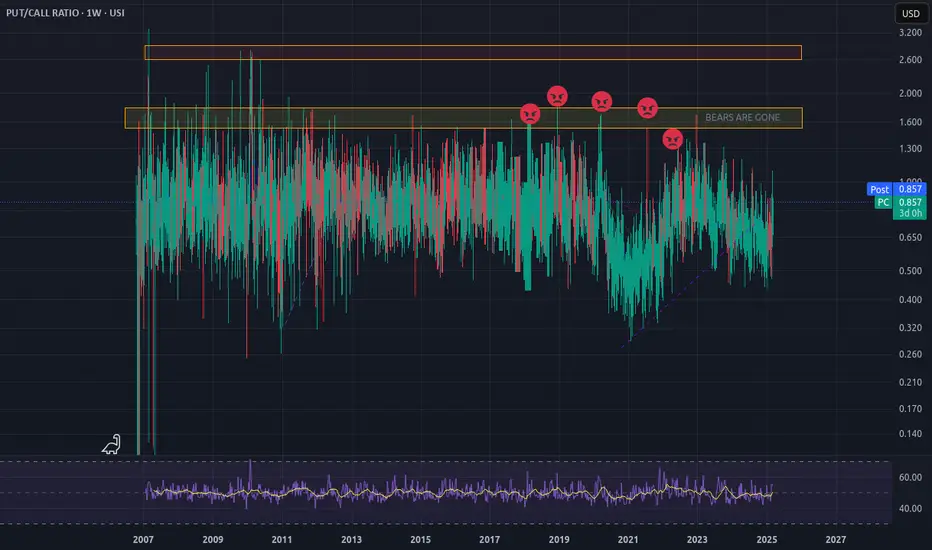
Bears are in oblivionThis chart shows that bears have literally been obliterated off the face of this market over the past 5 years. I'm talking about bears who actually take action, not the ones just sitting on the sidelines, blabbing. Even the 2022 bear leg barely pushed up the p/c ratio. Compare to market behaviour pr
See all ideas
Displays a symbol's value movements over previous years to identify recurring trends.