Pendle Weekly Setup: Spot Buy Zone, Low Leverage OnlyPendle is showing a slant W on the 1-week timeframe, looks like a solid setup. Best to buy on spot for the long term. If using leverage, keep it light (2–5x max). This is a long play, just a matter of time before the move. Not financial advice — trade at your own risk

PENDLEUSD Bullish Continuation Setup!BINANCE:PENDLEUSDT has surged approximately 20,000% from its bottom, showing exceptional long-term strength. The price is now approaching a major horizontal resistance zone on the weekly chart. If the price breaks the parallel channel resistance, we can expect a bullish continuation with a psycholo
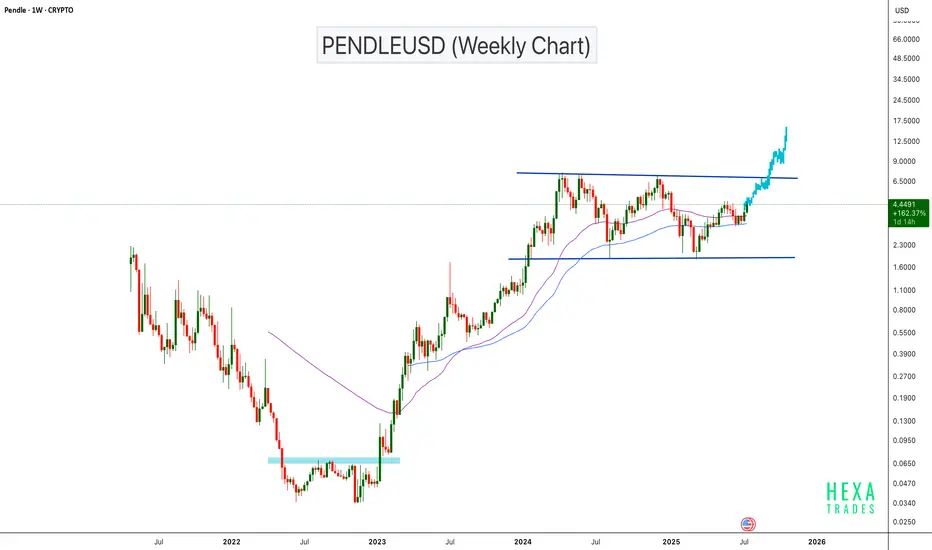
The bulls have left the building—time for the bears to party.PENDLE currently at strong support zone on weekly timeframe.
Break of this support could trigger a massive fall downwards. Chart is self explanatory.
Note: This is not Buy/Sell Recommendation. DYOR always & always.

PENDLE RWA Bullish Chart prediction 2025Pendle has been excellent in 2024. The project is delivering and moving to the Top 50 is possible.
Given its market cap to be sitting around $600M only, means it can have the same upside as AAVE as PENDLE is RWA and tokenization for LINK and Axelar. If you don’t hold PENDLE in your portfolio, you

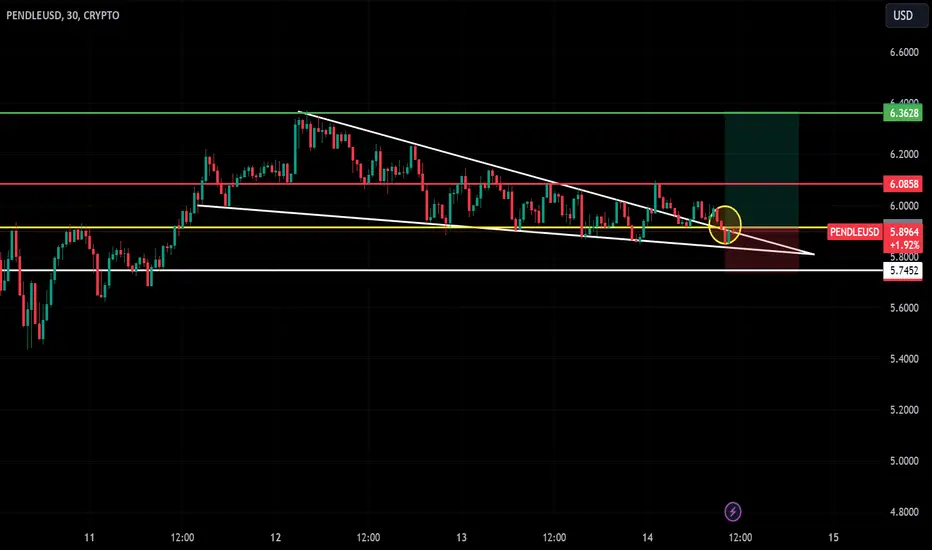
Descending Triangle Breakout on PENDLEUSD - Trade.The PENDLEUSD chart shows a descending triangle breakout on the 30-minute timeframe. Key levels to watch:
Entry Point: Near the breakout zone, confirming bullish momentum.
Stop Loss: Set below the triangle support at 5.7452 for risk management.
Take Profit: Targeting 6.3628, aligning with the next
CTRL+ALT+DELETEIts time to put the power back in the peoples hands.
#BUY #BUY #BUY
**USE PROPER RISK MANAGEMENT**

PENDLE "most active in Russia" Pendle is most active in Russia at 20%. Data from crunchbase powered by semrush.

Pendle is looking to launch to $28Undoubtedly one of the winners of the cycle.
Already done hundred's of X's
YET
consolidating near it's high's in a #HVF continuation pattern @TheCryptoSniper
With the larger projection over a 4X from here.

Bidding Pendle BreakoutIt seems like our favourite (is this how you spell it) RWA coin is attempting a breakout again.
I had initially planned to wait for the 4th test on resistance. However after waiting a few more days it looks like Pendle is ready to run this time.
There has been significant accumulation throughout


See all ideas
Summarizing what the indicators are suggesting.
Oscillators
Neutral
SellBuy
Strong sellStrong buy
Strong sellSellNeutralBuyStrong buy
Oscillators
Neutral
SellBuy
Strong sellStrong buy
Strong sellSellNeutralBuyStrong buy
Summary
Neutral
SellBuy
Strong sellStrong buy
Strong sellSellNeutralBuyStrong buy
Summary
Neutral
SellBuy
Strong sellStrong buy
Strong sellSellNeutralBuyStrong buy
Summary
Neutral
SellBuy
Strong sellStrong buy
Strong sellSellNeutralBuyStrong buy
Moving Averages
Neutral
SellBuy
Strong sellStrong buy
Strong sellSellNeutralBuyStrong buy
Moving Averages
Neutral
SellBuy
Strong sellStrong buy
Strong sellSellNeutralBuyStrong buy
Displays a symbol's price movements over previous years to identify recurring trends.