pendleusdtGiven the current situation, it might be worth taking a risk. Let's manage risk, as we also have NFP on Friday

PENDLEUSDT Bullish Flag Points to $6.8–$7 BreakoutPENDLEUSDT has formed a bullish flag pattern on the chart — a consolidation structure that often precedes continuation to the upside.
Once price breaks out of this flag, a move toward the $6.8–$7 zone is expected. This range represents the next resistance area and potential profit target.

PENDLE Buy Prices For a DCA Strategy & Fib Take Profit TargetsPENDLE is a great coin for this Bull run, which I think can easily push up to $10 - $20.
In this video, I cover where I'm placing limit buy orders below to dollar cost average in and build a bigger position, while lowering my overall cost.
Then we'll look at a few reasons why, showing that PENDLE

PENDLE Market Update📉 CRYPTOCAP:PENDLE Market Update
CRYPTOCAP:PENDLE is currently testing the blue support level 🔵
If this level breaks down, sellers could take control and drive price lower ❌
⚠️ Reminder: A confirmed breakdown of support often leads to sharper bearish momentum — stay cautious and always wait fo
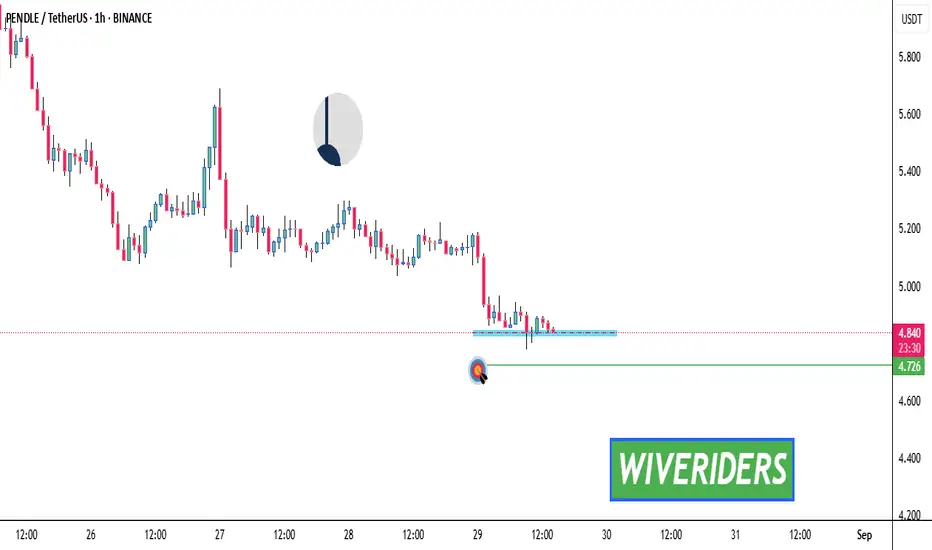
PENDLE is now testing an important green support level📉 CRYPTOCAP:PENDLE Market Update
CRYPTOCAP:PENDLE is now testing an important green support level 🟢
If this zone breaks down, sellers could take control and push price lower ❌
⚠️ Key reminder: Support breakdowns often trigger stronger bearish momentum. Stay cautious and wait for confirmation b

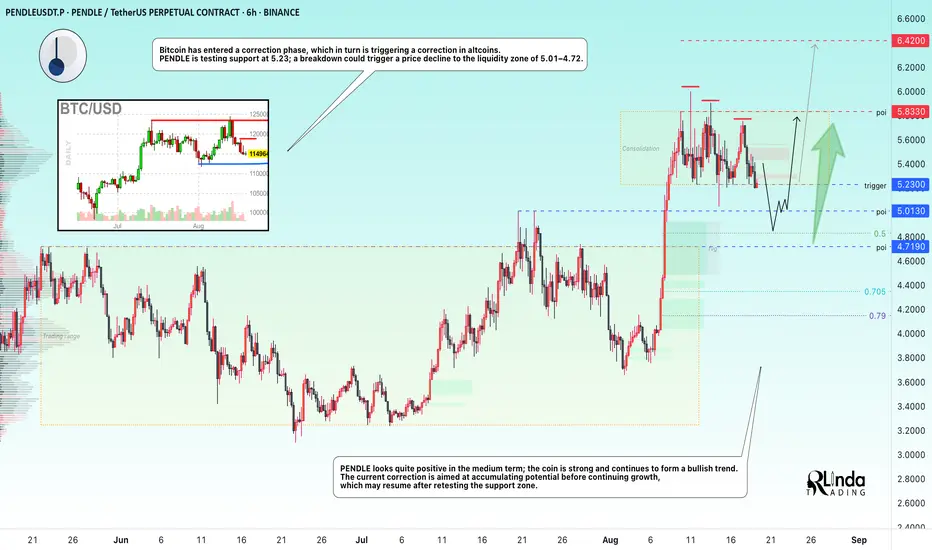
PENDLEUSDT → Retest of the 5.0 liquidity zone before rising to 7BINANCE:PENDLEUSDT is still consolidating, but is preparing to enter a correction phase, which could be triggered by a breakdown the 5.23 support level. Correction is a vital stage for further growth.
Bitcoin has entered a correction phase, which in turn is triggering a correction in altcoins.
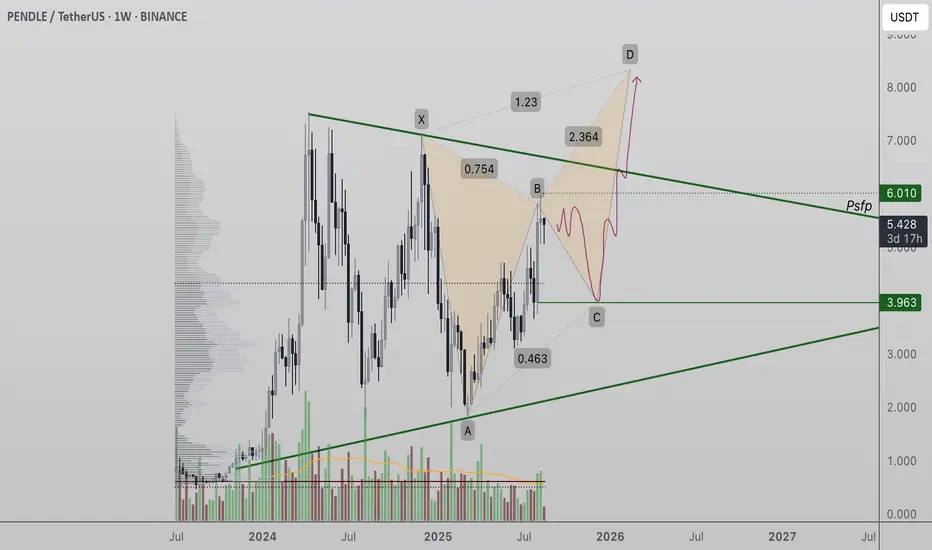
Pendle Consolidates in Weekly Equilibrium as Bulls Eye BreakoutPendle (PENDLE) is trading in a large equilibrium structure on the weekly time frame, with price action forming a potential bullish harmonic pattern. A sustained breakout could open the path toward $8 and higher.
Pendle’s weekly chart shows a market consolidating within a broad equilibrium zone, wh
PENDLE Breakout Alert! 🚨 CRYPTOCAP:PENDLE Breakout Alert! 🚨
CRYPTOCAP:PENDLE is currently testing the red resistance zone 🔴
If price breaks out, the first target will be the green line level 🎯
A confirmed breakout here would signal bullish continuation and open the way for further upside ✅

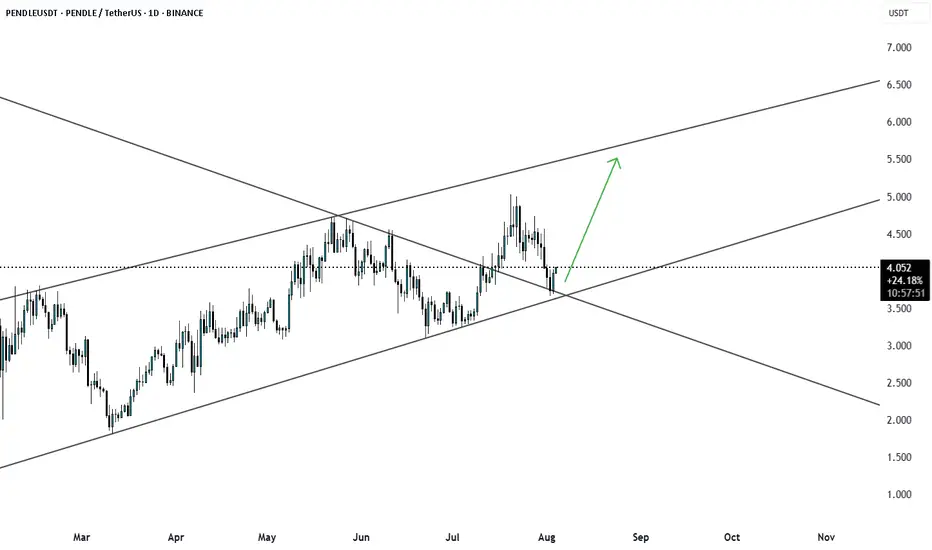
PENDLEUSDT Eyes Breakout Toward $7PENDLEUSDT is trending within a channel and has now reached the channel’s resistance, signaling a potential breakout toward the $7 level. Despite the recent BTC drop, PENDLE recovered fully — a sign of strong buyer interest.
A good risk-to-reward trade setup is possible here, with a stop-loss aroun

PENDLEUSDT at Channel SupportPENDLEUSDT is currently trading within an upward channel. Yesterday, the price pulled back to the channel support and formed a bullish engulfing candle, indicating potential continuation of the uptrend. A move toward the channel resistance appears likely.
A long trade can be considered with a stop-
See all ideas
Summarizing what the indicators are suggesting.
Oscillators
Neutral
SellBuy
Strong sellStrong buy
Strong sellSellNeutralBuyStrong buy
Oscillators
Neutral
SellBuy
Strong sellStrong buy
Strong sellSellNeutralBuyStrong buy
Summary
Neutral
SellBuy
Strong sellStrong buy
Strong sellSellNeutralBuyStrong buy
Summary
Neutral
SellBuy
Strong sellStrong buy
Strong sellSellNeutralBuyStrong buy
Summary
Neutral
SellBuy
Strong sellStrong buy
Strong sellSellNeutralBuyStrong buy
Moving Averages
Neutral
SellBuy
Strong sellStrong buy
Strong sellSellNeutralBuyStrong buy
Moving Averages
Neutral
SellBuy
Strong sellStrong buy
Strong sellSellNeutralBuyStrong buy
Displays a symbol's price movements over previous years to identify recurring trends.