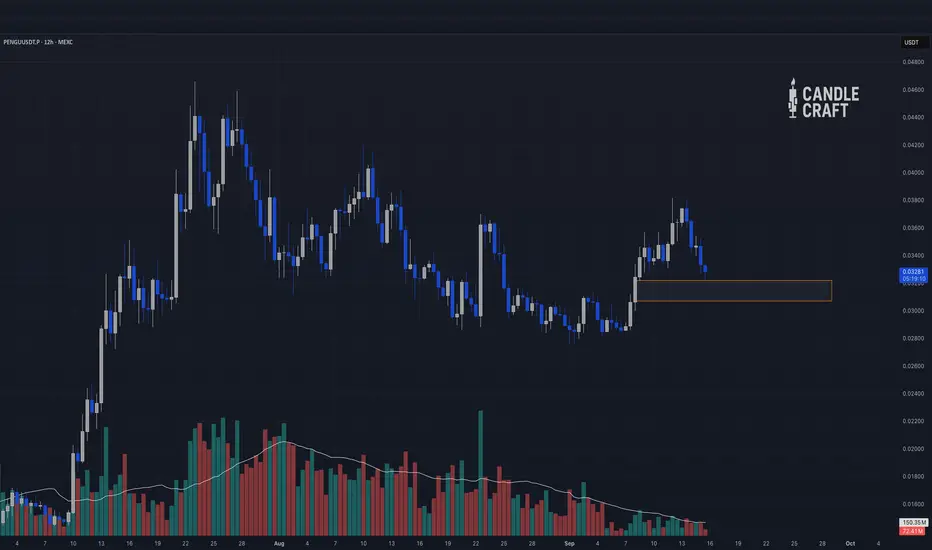
$PENGU is consolidating: long opportunityThe market is expected to cool down a bit after the recent CRYPTOCAP:BTC rally — that’s our chance to catch a solid long setup. Check the green box for the entry zone!
Entry in the green box, the lowest possible
🎯 Target: $0.035, $0.038, 0.040
If CRYPTOCAP:BTC corrects to around $120,000, it could drag altcoins lower, giving us a perfect opportunity for a juicy long position.
Always DYOR! 💪 #Crypto #Altcoins #BTC #Trading #TechnicalAnalysis #MarketUpdate #DYOR
Trade ideas

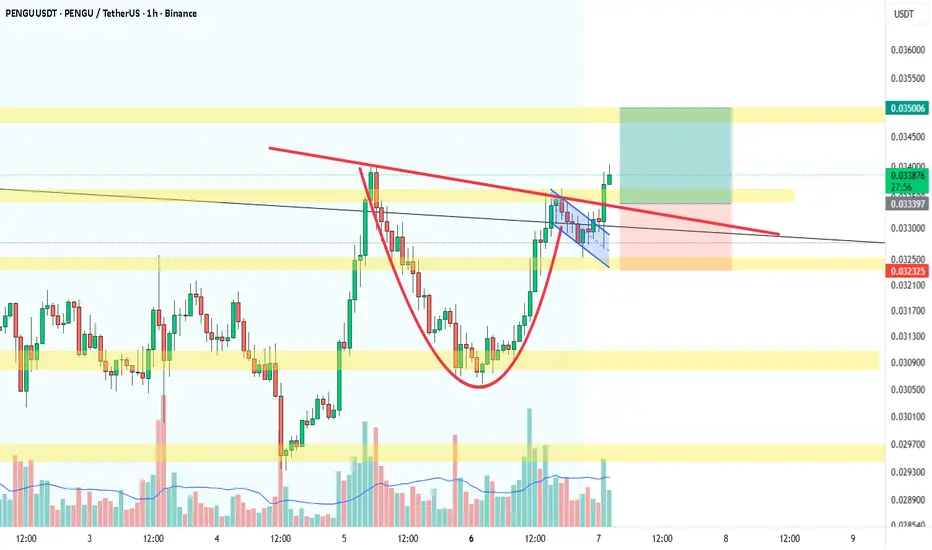
Cup and Handle PatternHello! I see this formation on the chart. Based on the previous uptrend, I think Pengu should continue to rise, perhaps reaching its previous high.
What do you think? :)
PENGU - continues to look bullishTalked about this on todays Live Stream
Broke out of side ways accumulation
and is now currently just retraced after
a nice move upward
Would like to see a retracement
( about the mid-line of the zone )
before upward continuation
Instructions on chart
NFA - Not Financial Advice
Join the Streams for Free Mentorship

Pengu set to 10x plus I don’t like to share much crypto these days, especially altcoins. My spidey senses tell me pengu is the runner this season. They have a product and brand and revenues through NFT feed and plushies etc. I had tokens before this setup but doubled my position here. The risk to reward is there.
Momentum channnel up, volume up, contracting wedge into volatility reset.
$PUDGY: Watching for Flag Breakout
The CSECY:PENGU is still contained within the flag pattern, following a strong rally. While there’s upward momentum, the breakout hasn’t fully occurred yet.
Key points:
Resistance: Watch the 0.032 area as the flag's upper boundary. A breakout here could confirm a continuation of the bullish trend.
Support: The 0.026 support zone remains crucial. If price holds here, it could set up for another push higher.
For now, the price is stuck in the flag pattern, with the breakout above resistance being the next key move.
Follow us and stay tuned for more updates.
#PEACE
DYOR, NFA

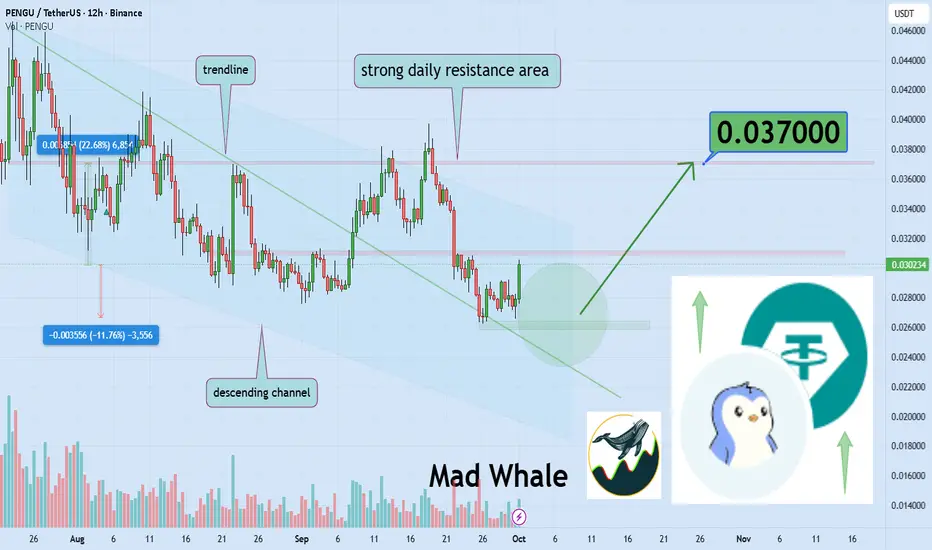
Pudgy Penguins setup hints at potential 22% surge to 0.037Hello✌️
Let’s analyze Pudgy Penguin’s price action both technically and fundamentally 📈.
🔍Fundamental analysis:
Pudgy Party launches Oct 2025 on Apple/Google stores, aiming for casual gamers. New toy and merch deals expand reach, but play-to-earn features are still untested.🎮🐧
📊Technical analysis:
BINANCE:PENGUUSDT is trading within a descending channel, approaching a key daily trendline 📉; holding this level and breaking nearby resistance could trigger a potential 22% upside toward 0.037 🚀.
📈Using My Analysis to Open Your Position:
You can use my fundamental and technical insights along with the chart. The red and green arrows on the left help you set entry, take-profit, and stop-loss levels, serving as clear signals for your trades.⚡️ Also, please review the TradingView disclaimer carefully.🛡
✨We put love into every post!
Your support inspires us 💛 Drop a comment we’d love to hear from you! Thanks, Mad Whale
Long trade
📌 Trade Journal Entry – PENGUUSDT
Trade Type: Buyside
Date/Time: Tuesday, 30th Sept 2025 – 12:30 PM
Session: LND to NY Session Overlap AM
Pair: PENGUUSDT Perpetual (15m timeframe)
🔑 Trade Details
Entry: 0.02759
Profit Level (TP): 0.03372 (+22.26%)
Stop Level (SL): 0.02659 (-0.60%)
Risk–Reward Ratio (RR): 36.94
📊 Technical Structure
Consolidation Phase: Price compressed around 0.02670 before the breakout.
Liquidity Sweep: Below 0.02672, flushing late longs and triggering demand.
Demand Zone (15m): Confirmed around 0.02650–0.02700; price launched from here.
FVGs: Bullish fair value gaps supported continuation on impulse move.
Fib Retracements: Key alignment with 0.236–0.382 retracement zones, offering confluence targets.
Break of Structure (BOS): Strong shift in market structure after sweep, confirming bullish narrative.
🏦 Narrative
Textbook Wyckoff accumulation:
Price completed a spring action (final liquidity sweep at 0.02670).
Demand confirmed by immediate displacement and BOS.
Rapid momentum expansion through untested FVGs confirmed strength.
Target aligned with 0.5 Fib retracement at 0.03372.

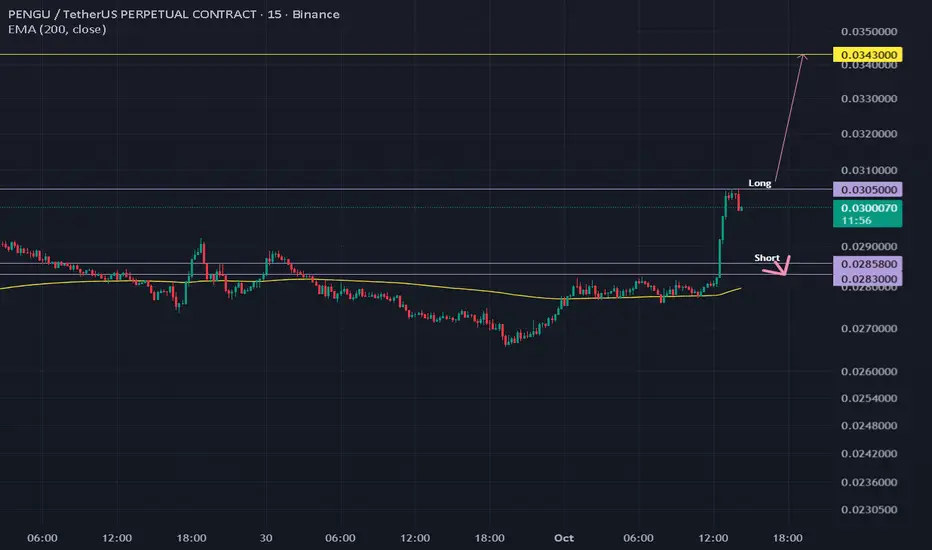
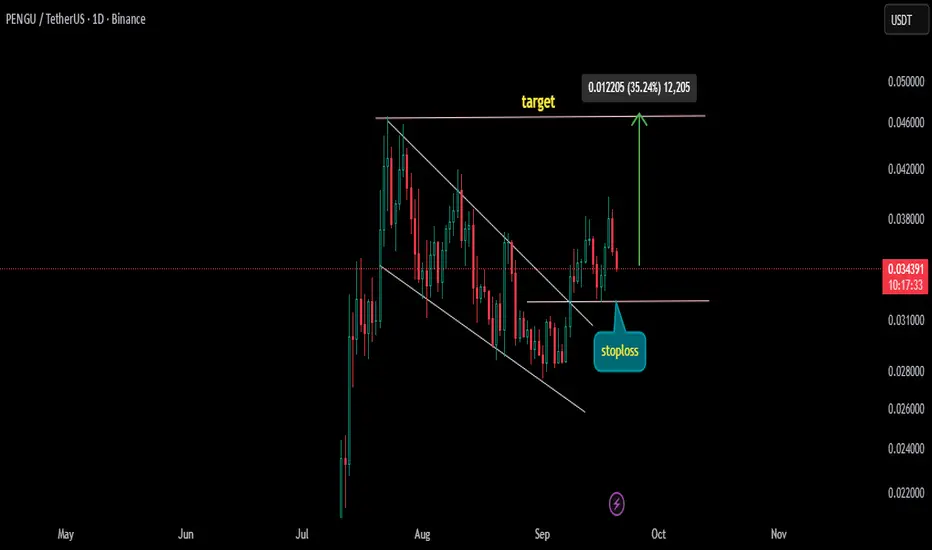
Scalp PenguusdtHi
This trade exploits the current breakout, aiming for the next major structural resistance.
Entry Price $0.03050 Momentum Entry: Enter on a confirmed close above the current resistance but slightly above the immediate price to confirm stability.
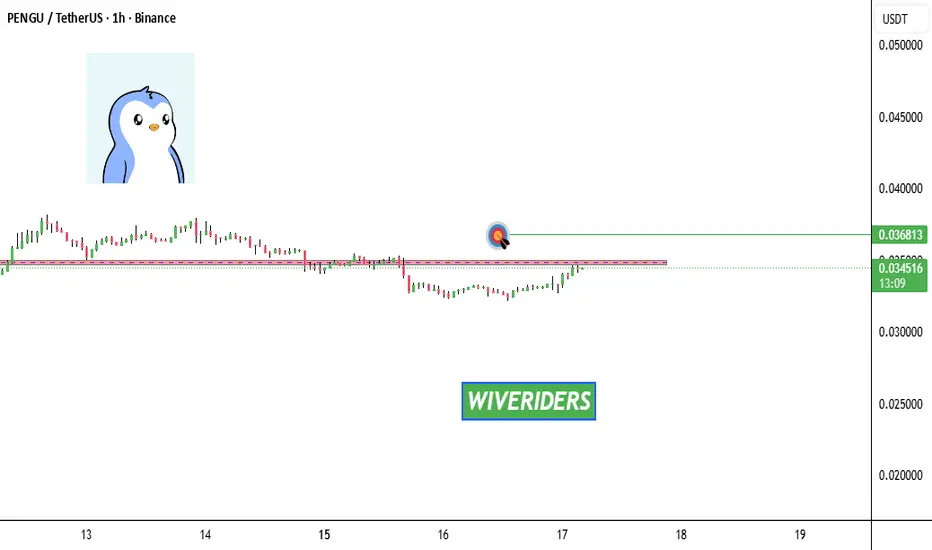
Take Profit (TP) $0.03430 A ≈12.5% move, targeting the Daily Structural High (visible on Image
2) at $0.0343149. This is the highest visible resistance cluster.
Stop Loss (SL) $0.02980 Placed just below the $0.0300 pivot point. A drop below here means the breakout was a massive failure/trap.
Risk/Reward ≈1:5.4 (Risk: $0.0007 / Reward: $0.0038) - Exceptional R:R for a competition-level trade.
Short
This is a backup trade only if the breakout fails dramatically.
Entry Price $0.02980 Sell the Failure: Entry on a confirmed close back below the major $0.0300 pivot and the SL for the Long trade.
Take Profit (TP) $0.02800 A ≈6.0% move, targeting the structural support/EMA 200 re-test zone.
Stop Loss (SL) $0.03050 Placed just above the initial short entry and the long entry trigger to ensure tight risk control.
Risk/Reward ≈1:2.5 (Risk: $0.0007 / Reward: $0.0018) - Good R:R for a quick reversal scalp.
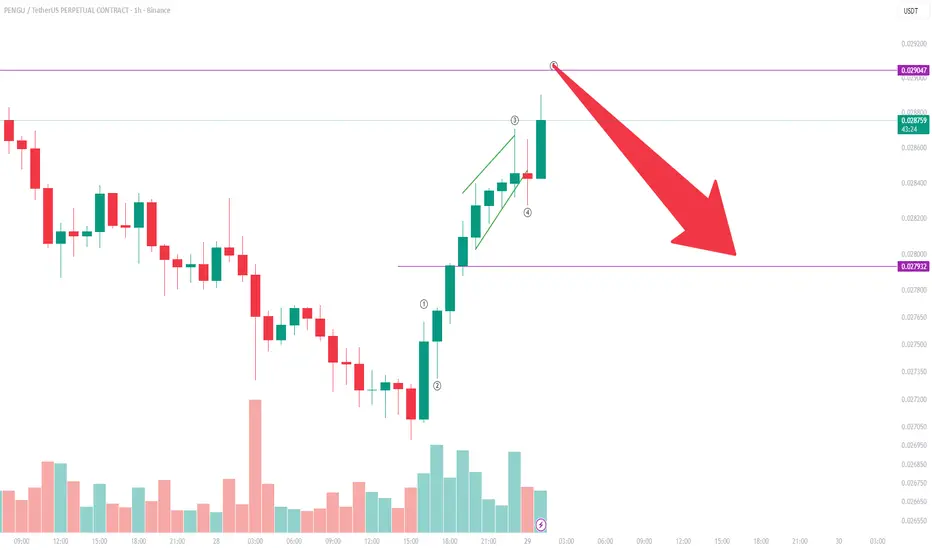
Pudgy Penguins (PENGU/USDT) Short SetupPudgy Penguins (PENGU/USDT) has completed a clear impulsive five-wave move.
After the sharp extension in wave (5), price action is now showing signs of exhaustion.
🔻 Correction Expectation
The fifth wave looks complete, leaving room for a downward retracement.
Key level to monitor: 0.0279 support zone.
This area is the first likely target for the corrective wave.
💡 Short Strategy
A short position can be considered once bearish confirmation appears.
Look for signals such as an engulfing red candle, loss of momentum, or rejection from the highs.
Entry: near current highs after confirmation.
Target: 0.0279 support.
Stop-loss: just above the recent peak to manage risk.
⚡ Alternative View
If momentum unexpectedly continues, there could be a small extension above wave (5). However, probability favors a pullback rather than further upside.
✅ Conclusion
PENGU/USDT is in a prime short setup following a completed five-wave impulse.
Traders should closely watch for bearish signals to time entries.
The 0.0279 support remains the key target for the correction.
Long trade
Trade Journal Entry
Pair: PENGUUSDT
Trade Type: Buyside trade
Date: Friday, 26th Sept 2025
Session: London to New York Session Overlap (AM, 9:30)
Trade Details
Entry: 0.027042
Profit Level (TP): 0.029921 (+10.65%)
Stop Level (SL): 0.026802 (-0.89%)
Risk–Reward (RR): 12
Technical Narrative
Pre-Trade Context:
Price trended down into discount territory (0.75 fib retracement), where a consolidation/accumulation phase formed.
Multiple fair value gaps (FVGs) were left unfilled on the climb back up.
Demand zone identified and respected, with reaction confirming strong buyer presence.
Entry Justification:
Break of structure (BOS) after the consolidation confirmed bullish order flow.
Entry taken at 0.027042, aligned with demand mitigation and retracement into imbalance.
Target Rationale:
TP set near 0.029921, just under the 0.236 fib retracement and liquidity pool above.
There is a probability of a liquidity sweep into this level before a major reversal.
Risk Management:
Stop placed at 0.026802, beneath the demand zone and structural low.

Pudgy Penguins (PENGU): Looking For Break of StructurePengu is forming another BOS (possibly), which will give us a good opportunity for a further movement to upper zones.
We are waiting for the clean breakout from here; after that, we want to see the retest and another BOS, which will be our final confirmation, so our attentions are here right now.
Swallow Academy

Market overview for PenguThe current price formation suggests a complex correction in the market. A breakout of the current fractal at 0.0275 could bring the price to the 0.382 Fibonacci level . Overall, the price is likely to head toward the 200-day moving average, but in such a market it’s hard to pinpoint where the reversal may happen.
That’s why I’ve marked a whole range with a black rectangle — but first, we need to see a true breakout of the fractal and then a reaction from the 0.0234 level.

$PENGU breakout and RETEST!BINANCE:PENGUUSDT is retesting strong support around 0.029–0.030 after a sharp pullback, aligning with the previous breakout trendline. As long as this zone holds, a bounce toward resistance at 0.032 and 0.035+ looks likely.
Invalidation below 0.02729. Stop-loss in place for risk management.
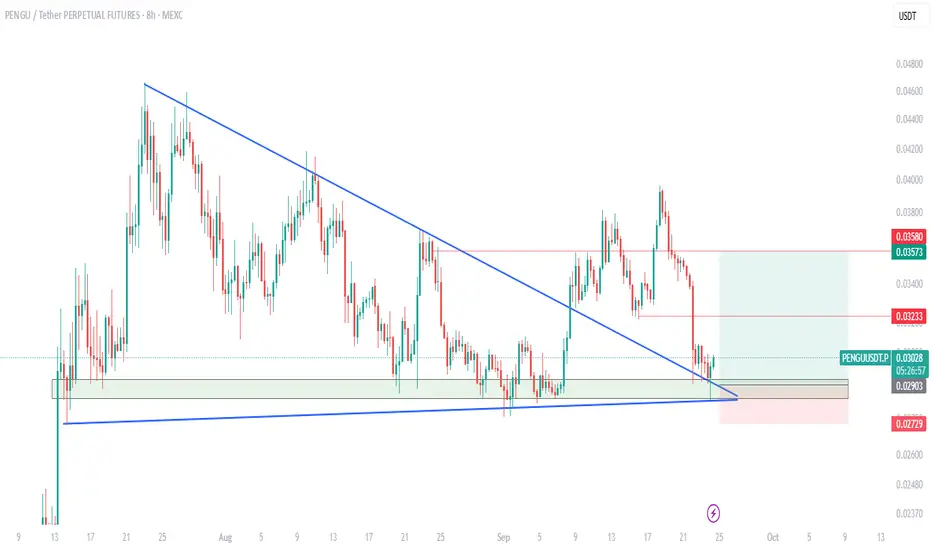
PENGU/USDT – at Key Zone: Major Accumulation or Breakdown Ahead?Current Situation
On the daily chart, PENGU/USDT is trading around ~0.0298 USDT, sitting directly above the critical support zone at 0.023 – 0.030 (highlighted in yellow). This zone is significant because:
It previously acted as strong resistance earlier in 2025.
Once broken in July, it flipped into key support (demand zone).
Now it’s being retested, making this area a decisive turning point.
---
Price Structure & Patterns
1. Range Accumulation: After a strong rally in July–August, price is consolidating, creating a potential base.
2. Resistance Cluster: Two overhead resistances are clear:
0.03790 → first minor resistance.
0.04313 → major resistance level.
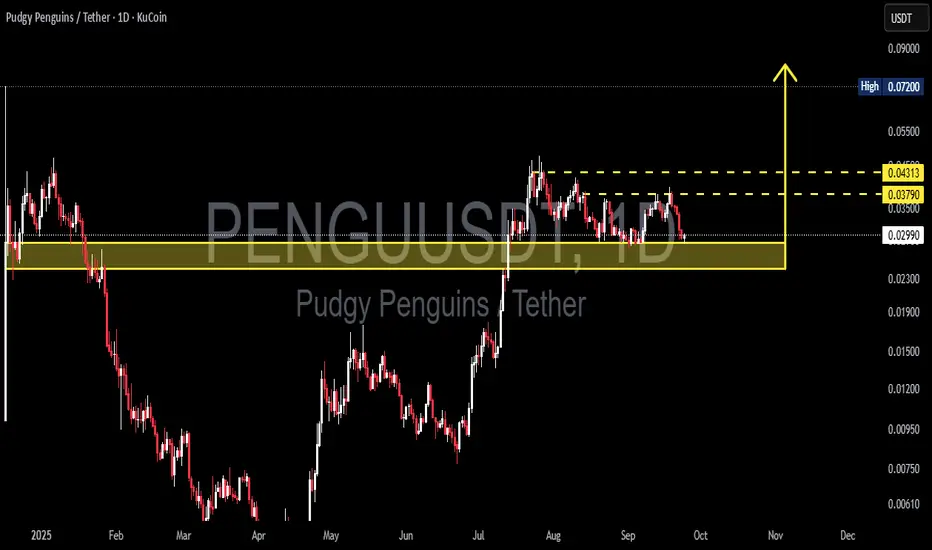
3. Breakout Potential: A daily close above 0.04313 could open the path toward the structural high at 0.072.
4. Distribution vs. Accumulation: Current range could play out either way — buyers holding the zone (accumulation) or sellers unloading before a deeper breakdown (distribution).
---
Bullish Scenario (Rebound Potential)
Trigger: Daily bullish close above 0.029–0.030 with rising volume.
Short-term targets:
0.03790 → minor resistance.
0.04313 → major upside target in this range.
Mid-term target: A confirmed breakout above 0.04313 could extend to 0.072 (previous structural high).
Confirmation signals: Bullish candlestick patterns (hammer / engulfing) within the support zone would strengthen the bullish case.
---
Bearish Scenario (Breakdown Risk)
Trigger: A strong daily close below 0.023 with high selling volume.
Implication: The mid-term bullish structure fails, pushing PENGU back into a downtrend.
Targets: Deeper corrections toward historical demand zones around 0.020 → 0.015 → 0.012.
Distribution signs: A series of lower highs followed by a confirmed range breakdown.
---
Market Psychology
Buyers are defending the 0.023–0.030 zone, signaling potential accumulation.
Sellers are waiting for breakdown confirmation below support to trigger panic selling.
This is a make-or-break moment for PENGU — a classic battleground between bulls and bears.
---
Conclusion
The 0.023–0.030 zone is the decisive level for PENGU’s next big move.
Bullish if it holds → targets at 0.0379 → 0.04313 → 0.072.
Bearish if it breaks down <0.023 → opens the door to deeper corrections.
Best approach: Wait for confirmation (daily close + volume) before committing to aggressive positions.
---
#PENGU #PudgyPenguins #Crypto #Altcoins #TA #TechnicalAnalysis #CryptoTrading #PriceAction
PENGU (FREE SIGNAL)Hello friends
Given the price decline, it can now be said that sellers are gradually weakening and weakness is occurring in the trend. Given the failure to confirm the rise of 3 support areas, we have determined that the price can be well supported in these areas and if supported, it can move to the specified targets.
*Trade safely with us*

Rising Wedge pattern on PENGUUSDT A Rising Wedge Pattern is triggered on Charts . this chart pattern is considered to be highly profitable by traders on longs, always puts stoploss on neckline of pattern as shows in charts
Long trade
Trade Journal Entry
Pair: PENGUUSDT
Direction: Buyside trade
Date/Session: Fri 19th Sept 2025, 11:20 AM — NY Session AM
Timeframe: 5-Min
🔹 Trade Details
Entry: 0.035543
Profit Level: 0.038764 (+9.06%)
Stop Level: 0.032722 (-0.90%)
Risk-Reward (RR): 10.03
🔹 Technical Structure
Liquidity / Sweep:
Price swept NY session lows and tapped into demand.
Accumulation structure forming with compression into support.
Order Blocks / Demand Zone:
Clear demand zone just below entry (0.0327–0.0330), protecting stop.
5min TF Entry
Market Structure:
Downtrend exhaustion is visible.
Transition into buyside intent — breakout of micro range anticipated.
🔹 Indicators
Volume: Increasing on-demand tests, supporting absorption narrative.
Moving Averages: Price reclaiming EMAs, first bullish alignment forming.
FVGs: Multiple inefficiencies above 0.0360–0.0387 provide upside draw.
🔹 Narrative / Trade Rationale
Entry is taken after liquidity sweep + accumulation inside the demand zone.
Strong RR 10.03 due to tight stop placement.
Target aligned with imbalance fill and prior supply zone near 0.0387.

pengusdt short and long targets Hi
entries are visible in the chart don't get mixed up with the short and long green line
it's simple if we get a rejection there enter short but if you are in a long from o.o340 the same will be your target

PENGU Price Jumps 10% as Meme Coin Market Gains 5%At the time of writing, PENGU is trading at $0.0376 after its 10.7% rally. The token is attempting to flip this level into support while targeting the resistance at $0.0404, which could serve as the next milestone in its upward push.
Given strong RSI and CMF readings, PENGU has a realistic chance of sustaining this momentum. The indicators suggest backing from both retail traders and market inflows, bolstering optimism for further gains beyond the immediate resistance.
However, downside risks remain. If broader market conditions turn bearish, PENGU could fail to hold current levels. A breakdown through $0.0363 could send the token lower to $0.0334, invalidating the bullish outlook and erasing part of its recent gains.

PENGU - New All Time HighsPENGU appears to have finished a W-X-Y correctional and is beginning a pretty solid new set of impulsive waves on the interest rate cut today. Pretty solid count as a whole, I don't have the long-term wave-count logged here but it does seem to be in the midst of a wave 4-5 transition, so this next move should be powerful but also followed by a formidible correction.
Price: 0.35+ easily, unsure of how high it will go
Wave-Count Confidence: Above Average

PENGU Upside Targets🎯As long as September low is holding the Pudgy Penguins COINBASE:PENGUUSD is expected to resume the rally higher toward $0.051 - $0.058.

PENGU is testing the red resistance zone📊 CSECY:PENGU Market Update
CSECY:PENGU is testing the red resistance zone 🔴
👉 If a breakout occurs, the first target will be the green line level 🎯
⚡ Always wait for confirmation before entering.
PENGU — Sweep the Lows, Fly the HighsPenguins waddle before they dive, and this chart is doing exactly that. After breaking its downtrend line in early September, PENGU has been carving a new sequence of higher highs and higher lows. But the market never makes it easy — liquidity is stacked just under price, waiting to be swept before the next expansion.
This is not collapse, it’s choreography: sellers lean in, weak hands get trapped, and the reversal play sets up.
HTF Structure (2D)
• Current price ~0.0326
• Broke DT line → HH/HL sequence forming
• Supports: 0.0330 / 0.0320 / 0.0307
• Resistances: 0.0368 / 0.0388 / 0.0410
Orderflow & Derivatives
• Liquidity below: 0.0320 → 0.0314 → 0.0307
• Liquidity above: 0.0368 → 0.0388
• Pullback driven by sell delta, but value still above breakout shelf
• OI stable-to-soft, funding flat, CVD negative = sellers pressing, but no breakdown yet
Trade Idea Map
• Sweep Zone: 0.0322–0.0307 (0.618–0.786 fib)
• Entry concept: 0.0319 on BOS↑ FVG fill or fresh OB body
• Stop: 0.0306
• Targets: 0.0346 → 0.0369 → 0.0388
• R:R potential ≈3.8:1
Rotation Context: NFT/brand midcap play, ecosystem rotation. The core idea: sweep-and-reversal.
Candle Craft | Signal. Structure. Execution.