PENGU Price Hangs Over 50% Crash Zone As Selloff BuildsBINANCE:PENGUUSDT.P price was hovering around $0.030 at press time, down over 20% in the past week, as key bearish signals continue to flash across both on-chain and chart metrics. One of the biggest red flags: exchange-held tokens jumped 5.74% this week, with over 873 million PENGU moved to CEXs — a clear sign of looming sell pressure. Meanwhile, whale and smart money wallets trimmed exposure sharply, with smart wallets alone cutting holdings by 12.83%.
On the 4-hour chart, a looming death cross between the 50 EMA and 200 EMA adds to downside fears. The last time the 20 EMA crossed below the 200, BINANCE:PENGUUSDT.P dropped from $0.033 to $0.028 — a clean 15% bleed. If the current bearish momentum continues and price breaks below $0.028, the next support is down at $0.014, implying a 53% crash from current levels.
Only the top 100 addresses increased holdings, hinting at internal redistribution rather than fresh inflows. For bulls, reclaiming $0.033 is key to neutralizing short-term downside. But with momentum still skewed toward sellers and exchange reserves rising, the pressure is on. Unless buyers step in fast, the risk of a sharp BINANCE:PENGUUSDT.P correction remains high.
Trade ideas

PENGU USDT CUP AND HANDLE . ABOUT TO SKYROCKET.PENGU USDT has formed a cup and handle pattern on daily chart.
A successful cup will form if it holds the current 38.2% retracement level.
Breakout above the previous highs would accelerate the price to the TARGET PRICE(TP).


Uptrend change to sidewaysAfter strong uptrend, uptrend showers sign of weakness by forming a complex pullback, and then after forming 4 minor selwings, it became sideways. Different formed trendlines, swing high and low support tesistance areas, fibonacci retracement ...

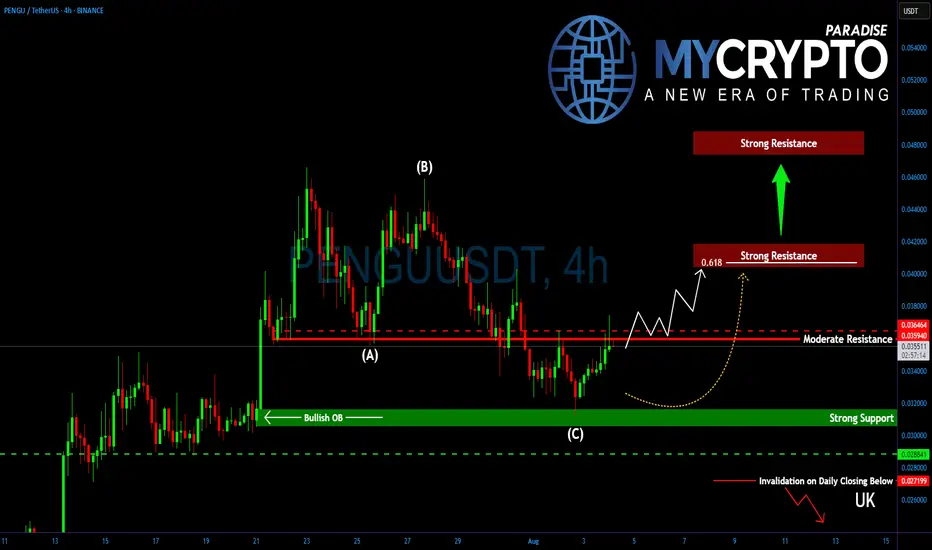
Is PENGU About to Explode or Fake Out Everyone Again?Yello, Paradisers! Have you been watching #PENGUUSDT after its recent dip? Because if you haven’t, you might be missing out on a potentially explosive setup forming right now…
💎After placing a major high around $0.0460, PENGU entered a textbook ABC corrective wave. But that correction looks to be over now, and what’s emerging could be the beginning of a powerful bottoming structure.
💎#PENGU is currently facing a critical short-term resistance at $0.0360–$0.0364, a level that bulls must flip to ignite a stronger recovery. If they succeed, all eyes shift toward the 61.8% Fibonacci retracement at $0.0405, a major confluence level that aligns with a key horizontal resistance between $0.0405 and $0.0415. Expect heavy action here. Bulls will likely face real pressure at this zone.
💎However, and this is where it gets interesting, if PENGU breaks above $0.0415 with strength, then momentum could pick up fast, paving the way for a fresh rally towards new yearly highs between $0.0480–$0.0494.
💎On the flip side, support remains solid between $0.0312 and $0.0302. This zone isn’t just an ordinary support, it also holds a bullish order block (OB), offering extra protection and confluence. This is where the market is quietly showing signs of strength while the majority are distracted elsewhere.
Paradisers, strive for consistency, not quick profits. Treat the market as a businessman, not as a gambler.
MyCryptoParadise
iFeel the success🌴
Pengu Long to $0.043 TodayJust setup this limit order to long pengu. It seems prime to take of tonight to get a potential 3-5RR. Based on my DTT analysis the market is likely to correct down just a little then take off soon after. I already got enough confirmation to long so I don't nee a manual confirmation in this case, just a good low entry with good RR.
sl: 0.039081 or lower
Tps on chart

TradeCityPro | PENGU Consolidates, Awaiting Altseason Breakout👋 Welcome to TradeCity Pro!
In this analysis, I want to review the PENGU coin for you. This project is one of the new Solana-based meme coins from China, with a market cap of $2.4 billion, ranked 43rd on CoinMarketCap.
📅 Daily Timeframe
On the daily timeframe, this coin started a strong bullish trend from the 0.003813 low. In the first wave of this move, it managed to reach around the 0.015 zone, and after a long correction period, it has now started a new bullish wave, moving up to the 0.043576 high.
✔️ Currently, the price is in a correction and consolidation phase, but the correction is mostly time-based since it hasn’t even reached the 0.236 Fibonacci level yet.
📈 The next bullish leg will start with a break above 0.043576. I will try to open a long position on this coin if this level is broken.
📊 For now, we can’t determine the next targets based on Fibonacci levels because we first need to see how far the price corrects. After breaking 0.043576, I will update the analysis and define the targets.
✨ If the correction deepens, the price can retrace to the 0.236, 0.382, and 0.5 Fibonacci levels. In the case of a sharp drop, as long as the price remains above the 0.015 zone, the trend is still bullish, and a break below this level would signal a trend reversal.
📝 Final Thoughts
Stay calm, trade wisely, and let's capture the market's best opportunities!
This analysis reflects our opinions and is not financial advice.
Share your thoughts in the comments, and don’t forget to share this analysis with your friends! ❤️

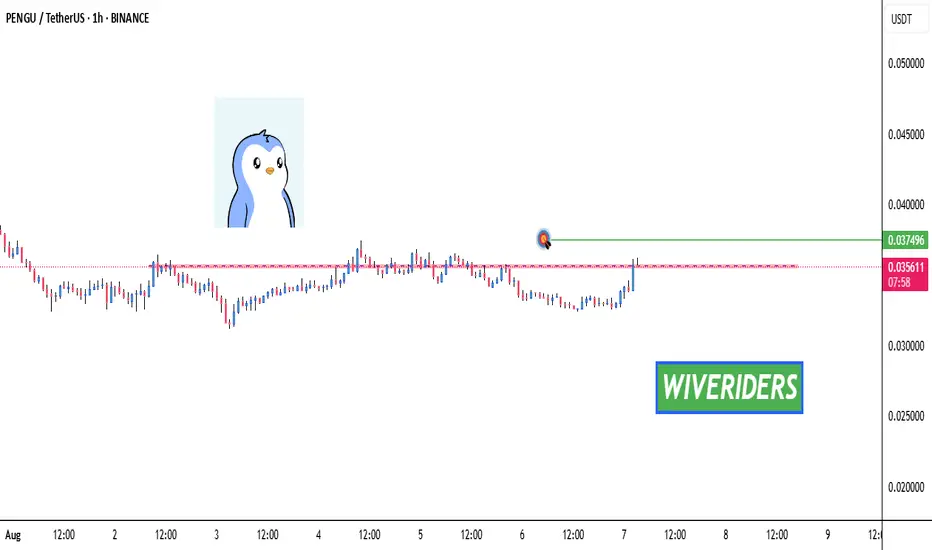
PENGU Breakout Watch – Red Resistance Being Tested! 🚨 PENGU Breakout Watch – Red Resistance Being Tested! 🔴⏳
PENGU is testing the red resistance zone.
📊 If breakout confirms, next move could target:
🎯 First Target → Green line level
A breakout could trigger bullish continuation and upside momentum.

Insider Selloff + Liquidity Sweep🔻 PENGU/USDT TRADE IDEA 🔻
📣 Hey CandleCraft crew!
Today we’re diving into a chilly little bird that flew a bit too close to the heat. 🐧 PENGU pumped hard — but when team wallets start dumping $17M worth of tokens, that’s not bullish, that’s suspicious. Think iceberg ahead.
🔥 TRADE SETUP
Bias: Short
Strategy: Insider Selloff + Liquidity Sweep
Entry: $0.036 – $0.038
SL: $0.041
TPs: $0.030, $0.025, $0.018
Why?
– HTF sweep of liquidity above $0.04
– Insider wallet moved 485M tokens to exchanges
– LTF CHoCH + RSI breakdown
– Price hovering under 20-day EMA with weakening volume.
Candle Craft | Signal. Structure. Execution.

PENGUUSDT – 4H Supply & Demand AnalysisPENGU is currently trading just below a major supply zone near $0.038 – $0.042 after multiple rejections in the same area. Price has been consolidating with reduced volatility, hinting at an upcoming decisive move.
🔍 Key Observations:
Supply Zone: $0.038 – $0.042 (blue zone)
This area has rejected price several times, indicating strong selling pressure.
Immediate Support: $0.0233
A break below could lead to accelerated selling toward $0.0142.
Demand Zone: $0.0090 – $0.0110 (orange zone)
This zone fueled the last major rally, making it a strong area of interest for buyers if price drops.
📈 Possible Scenarios:
Bearish Rejection – If sellers defend the $0.038–$0.042 range, we could see a move toward $0.0233 and possibly $0.0142.
Bullish Breakout – A clean 4H close above $0.042 could invalidate the supply zone and push PENGU toward new highs.
🔻 Bias:
Short-term bearish while price remains below $0.042. A confirmed breakout is needed to flip bullish.
Disclaimer: This analysis is for educational purposes only and not financial advice. Always trade with proper risk management.

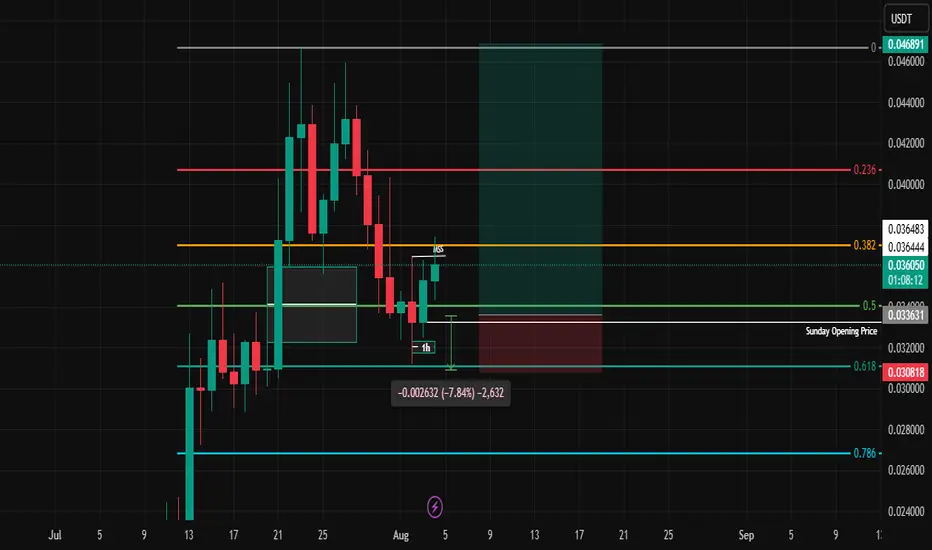
Pengu Market OverviewLet’s start with the daily timeframe. The bullish structure is clearly visible, showing three waves. The first wave of growth contains all five sub-waves and delivered a 370% increase. The second corrective wave lasted 39 days and retraced to the 0.5 Fibonacci level .
The third wave of growth may not be complete yet — it reacted from the $0.046966 level, and so far we can clearly see three sub-waves, with the price currently in wave 4. In any case, there’s still a chance to see a new local high at $0.046966 before entering a deeper correction. The daily RSI has cooled down and returned to the midline, which leaves room for further growth.
If we are indeed in wave 4, which has already lasted 16 days , it could be longer than wave 2. It may potentially reach the $0.019118 level, but the key is to avoid breaking $0.017502 . In that case, the target for wave 5 would be in the $0.09 – $0.10 range.
As for the short-term plan, the price is currently in a correction after the drop and has already reached the 0.5 Fibonacci level , now attempting to hold above the weekly pivot point at $0.036757 .
If resistance in the $0.038814 – $0.040342 zone is broken, we could see a move aiming to update the local high. If the local trendline is broken to the downside, the price may drop toward the $0.026 level.
If the price falls back below the weekly reversal level and fails to reclaim it, I will consider the possibility of following the bearish scenario.

Pudgy Penguins (PENGU)PENGU is the official coin of Pudgy Penguins. Pudgy Penguins is a blockchain-based collection of NFTs launched on the Ethereum blockchain.
Anyway, after PENGU's downward wave ended, the upward wave started, and PENGU reached the previous ATH. But, PENGU failed to break through the ATH horizontal area, for now. Have to wait and see if PENGU can breach this area or not. Let's see what happens.

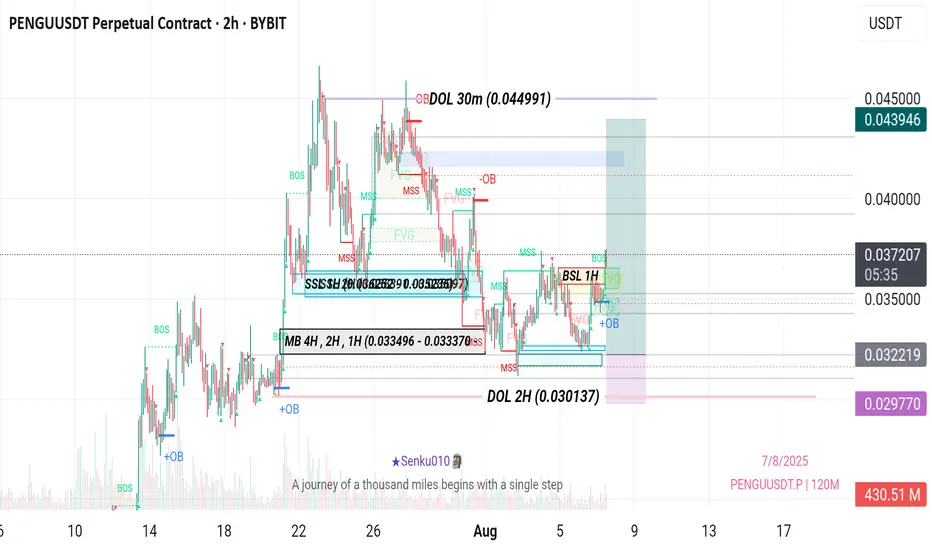
(PENGU) Targeting Expansion After Liquidity Sweepsstrategic combination of liquidity sweeps and a confirmed market structure shift. We have observed that Sell Side Liquidity (SSL) on the 1H timeframe has been swept and "Finished," indicating that the market has purged short-term stops and is poised for a reversal or upward expansion. Currently, an "Ongoing sweep to my entry" is occurring on the 15m SSL, which is the perfect liquidity grab to fuel the anticipated upward move.
The foundation of this bullish thesis is a confirmed Bullish Market Structure Shift (MSS) on the 2H timeframe, followed by a Break of Structure (BOS), signaling a definitive shift in market control to the bulls. This structural alignment is further supported by the presence of a high-confluence Mitigation Block (MB) on the 4H, 2H, and 1H timeframes, as well as a multi-timeframe Fair Value Gap (FVG).
PENGUUSDT Bearish Setup – Supply Zone Rejection IncomingPrice is currently consolidating just below a strong supply zone (highlighted in blue), where we previously saw an aggressive rejection. The recent price action shows a potential lower high forming under resistance, suggesting weakening bullish momentum.
🔑 Key Levels:
🔵 Supply Zone Resistance: 0.035800 – 0.036000
🔵 Minor Support: 0.034364
🔵 Demand Zone Target: 0.032800 – 0.032918
🧠 Bias: Bearish
I expect a potential fakeout to the upside, tapping into the supply zone one last time before a sharp reversal. A break and close below 0.034364 could trigger further downside toward the demand zone.
📌 Trade Idea:
🔺 Wait for a sweep of the supply zone followed by bearish confirmation
🔻 Target 1: 0.034364
🔻 Target 2: 0.032800 (Demand zone)
❌ Invalidate if price closes strongly above 0.036000
📊 Strategy Used:
Supply & Demand
Liquidity Sweep
Smart Money Concepts
📣 Disclaimer: This is not financial advice. Do your own research before entering any trades.
#PENGUUSDT #CryptoTrading #SmartMoney #SupplyAndDemand #FrankFx #TradingViewAnalysis #BearishBias #LiquiditySweep #PriceAction

PENGU Breakout Watch – Red Resistance Being Tested! CSECY:PENGU Breakout Watch – Red Resistance Being Tested! 🔴⏳
CSECY:PENGU is testing the red resistance zone.
📊 If breakout confirms, next move could target:
🎯 First Target → Green line levels
A confirmed breakout may signal bullish momentum and continuation higher.
LongPengu broke a swing on the daily at equilibrium.
I am interested in a long position if it retraces back to OTE.
Watch Pudgy Penguins Hold Support, Targeting 0.45 With %28 Hello✌️
Let’s analyze Pudgy Penguin’s price action both technically and fundamentally 📈.
🔍Fundamental analysis:
Pudgy Party is a new game with Web3 features, coming this August. They’re giving away $5K in PENGU tokens to early sign-ups, and your NFT avatar can earn rewards while you play. 🎮
If lots of players join (over 500K), it could boost PENGU’s value and help reduce supply. But if fewer people play (under 100K), the token might just be hype without real support. 🚀
📊Technical analysis:
BINANCE:PENGUUSDT is sitting on a crucial daily support level 📉. Holding this zone could spark a 28% rally toward 0.45 🎯.
✨We put love into every post!
Your support inspires us 💛 Drop a comment we’d love to hear from you! Thanks, Mad Whale

PENGUUSDTIf confirmed with your personal setups, it makes sense to take a risk to fall to the specified range, given the current conditions.

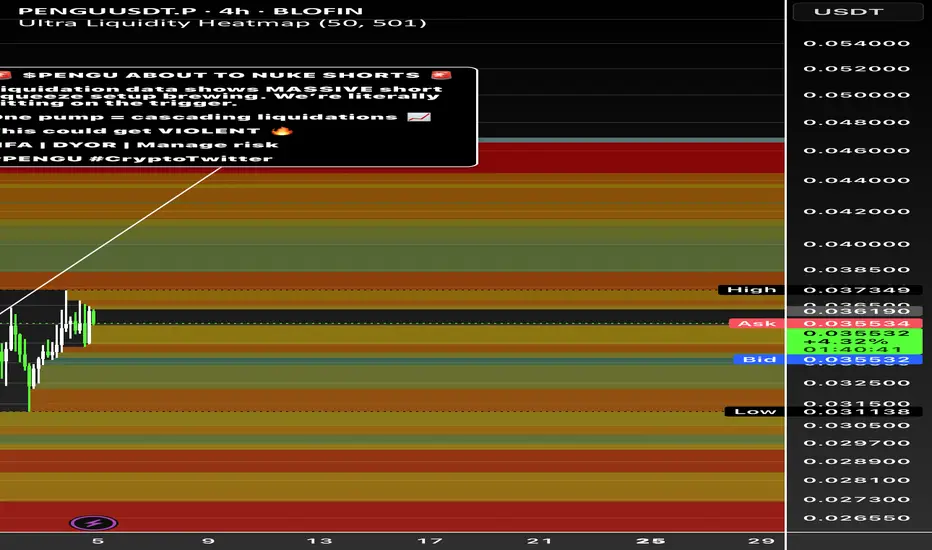
Pengu short squeeze go long!🔥 BINANCE:PENGUUSDT LIQUIDATION MAP SCREAMING BULLISH
Sitting right on top of major short clusters. One break above $0.0358 triggers cascading liquidations.
Entry: $0.0356-0.0357
Targets: $0.0362 | $0.037+
SL: $0.03545
80% confidence | 6:1 R/R potential
#PENGU #LiquidationMap
Pengu - Cup and HandleStrong NFT project that survived the bear market. Good momentum. Decent Fundamentals
Cup and Handle pattern speaks for itself. Once it breaks the handle the upside expect price markup.

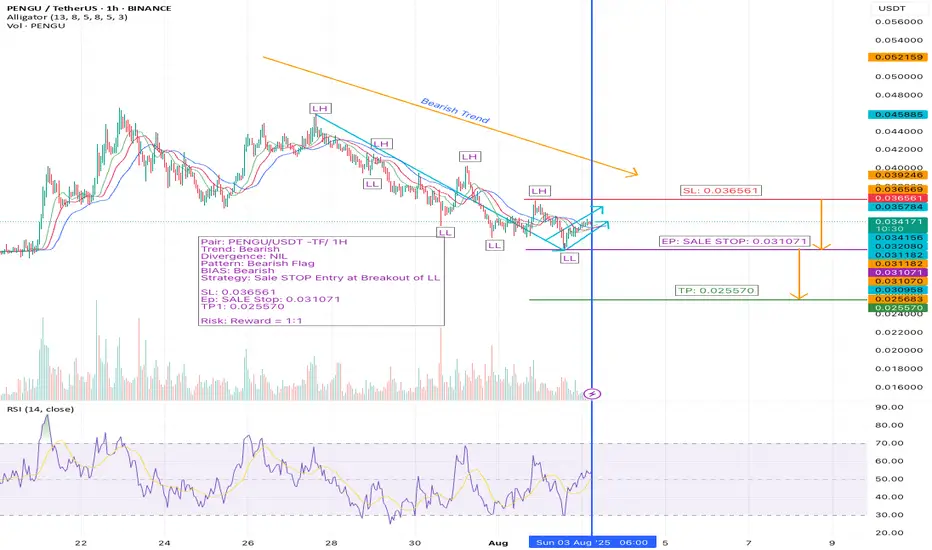
PENGU/USDT 1H Setup – Bearish Flag Breakdown on WatchWe’re analyzing PENGU/USDT on the 1-hour timeframe, and the structure is setting up for a potential continuation to the downside.
🔹 The current trend is bearish
🔹 Price is in a retracement phase, forming a new Lower High (LH)
🔹 A bearish flag pattern is developing — often a strong continuation signal
🔹 We are executing our Sell Stop strategy at the breakout of the Lower Low (LL)
🔹 Expecting a bounce after LH, followed by resumed bearish momentum
📌 Trade Setup Overview:
Pair: PENGU/USDT
Timeframe: 1H
Trend: Bearish
Divergence: None
Pattern: Bearish Flag
Bias: Bearish
Strategy: Sell Stop at LL Breakout
🔻 Entry (EP): 0.031071
🔴 Stop Loss (SL): 0.036561
🟢 Take Profit (TP1): 0.025570
⚖️ Risk:Reward Ratio: 1:1
💼 Why This Trade Stands Out:
✅ Bearish flag within a strong downtrend
✅ Classic LH formation signaling exhaustion of retracement
✅ Tight SL and logical TP based on recent structure
✅ Clean 1:1 setup ideal for short-term swing execution
💬 What do you think about PENGU/USDT?
Are you seeing the same bearish setup? Comment your analysis below 👇
🔔 Follow me for more price action-based setups, altcoin breakdowns, and clean risk-managed trades. Let’s grow and win together! 🚀
#PENGUUSDT #CryptoSetup #BearishFlag #AltcoinAnalysis #PriceActionTrading #1HChart #TrendContinuation #BearishBias #CryptoTechnicalAnalysis #AltcoinBreakout #SellSetup #BearishStructure #RiskReward #TradingStrategy #CryptoSwingTrade #ChartPatterns #BearishTrend #CryptoCommunity #TradeWhatYouSee #CryptoTraders #TradingViewSetup #AltcoinWatchlist #SmartEntry #VolumeAnalysis #CryptoShort
#PENGU #PENGUUSDT #PENGUINS #LONG #AMD #PO3 #Analysis #Eddy#PENGU #PENGUUSDT #PENGUINS #LONG #AMD #PO3 #Setup #Analysis #Eddy
PENGUUSDT.P Scalping Long Setup
This Setup & Analysis is based on a combination of different styles, including the volume style with the ict style. (( AMD SETUP )) "PO3"
Based on your strategy and style, get the necessary confirmations for this scalping setup to enter the trade.
Don't forget risk and capital management.
The entry point are indicated on the chart along with their amounts.
The responsibility for the transaction is yours and I have no responsibility for not observing your risk and capital management.
Note: The price can go much higher than the specified target and have a very good pump.
Be successful and profitable.

Pudgy Penguins (PENGU): Huge Volatile Movement IncomingPengu coin seems to be in a pretty dangerous zone; while we are hovering near the ATH and seeing some smaller pullback prices, we are yet to see the potential huge breakout take place or breakdown happen.
We have marked 2 zones to keep an eye on; if either of those zones is broken, a huge volatile movement will happen so be careful!
As long as we are above the Sell Zone, we are going to look for more MSB areas for smaller long scalps!
Swallow Academy
