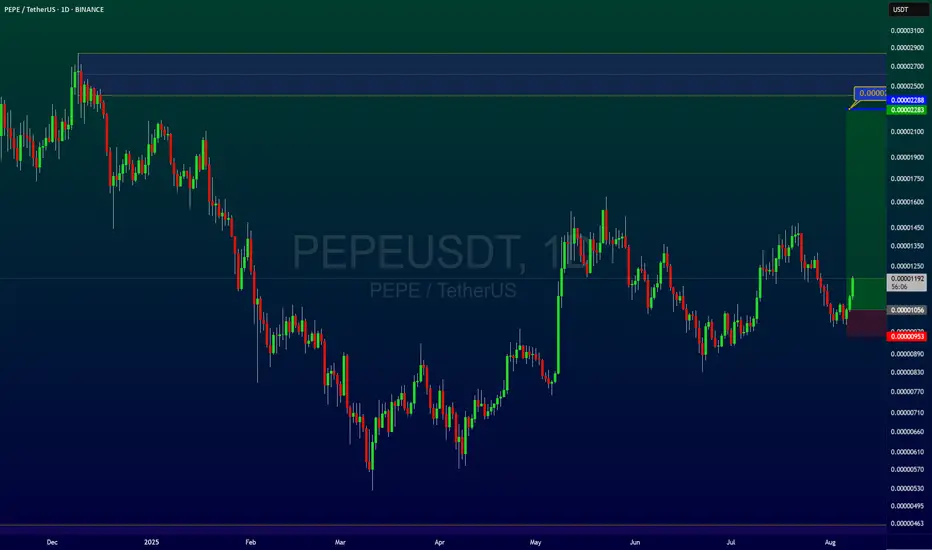
PEPE is near weekly support If it hold this major weekly support of 0.000010$ then we can see at least 2x here on chart which is easy target for it but also any breakout here to the downside cause two months at least dump and boring range and then pump is expected like second path on chart.
DISCLAIMER: ((trade based on your own decision))
<<press like👍 if you enjoy💚
PEPEUSDT.3S trade ideas

The Power Of Risk Management - "i want 100% profit!!"Am angry let me tell you the reason.
I was up about 50% profit on this trade...
guess what? i didnt take profit...
I feel so stupid and helpless
because am following my risk management
to the T..meaning i have to cross
my t when writing.
Dont fear volatility.
The entry was at a higher low .
Now it has dropped to a new low .
What makes this the perfect re-entry?
its because people, buyers and sellers, are fearful.
The buyers and sellers are fearful right now.
Imagine 3 days of profit Poof!!! gone!!
And here you are holding the bag on this trade.
Meanwhile the short term investors have taken
their share of profit
Am sticking to risk managment buddy.
i want 100% profit!!
Look at this chart KUCOIN:PEPEUSDT
you will see two things:
1-The bullish harami
2-The doji
The bullish harami shows you reversal entry.
The doji shows you fear.
Dont let fear stop you.
Also look at the william %R have you seen the New low?
Rocket boost this content to learn more.
Disclaimer: Trading is risky.Please learn risk management
and profit taking strategies.
Also feel free to use a simulation trading account
Before you trade with real money.
Full Disclosure: I am a marketing expert

$PEPE.. dodged a bullet last nite due to rejection below my ...TRIGGER.
So, I dodged a bullet on CRYPTOCAP:PEPE last night thanks to patience and decent use of a simple technical level.
Price rejected just inside an expected resistance zone and didn't trigger my longs from $0.00001735 so that feels like a win💙👽.
So, for now we don't wanna lose $0.00001050 for longer than an hour or expect troubles.
Lower low on the 1-HOUR chart so that's no good, so watching this chart is a great idea but way too early for me to long, not against the bearish trend here, no way🤯
Need CRYPTOCAP:BTC.D to start dying soon for anything positive

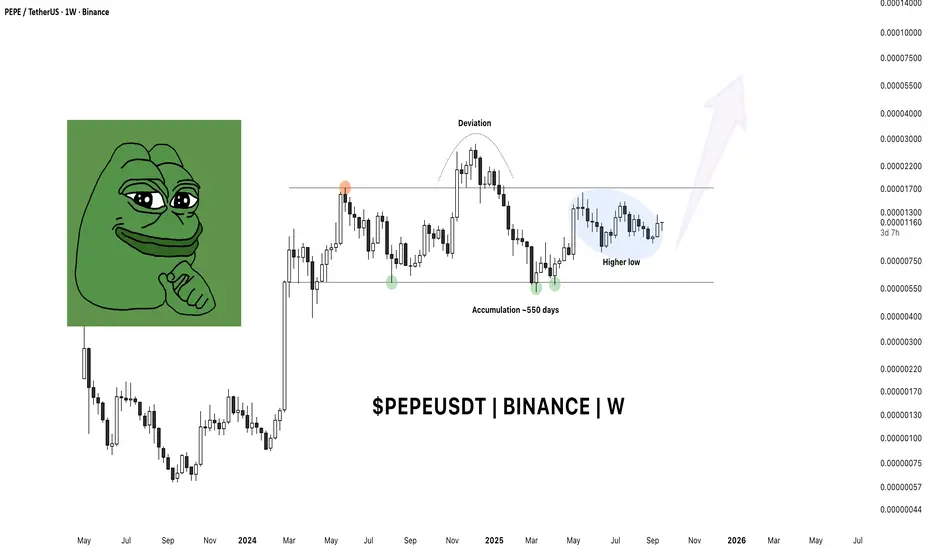
Pepe Setting Up for the Next Leg?Pepe has been quietly coiling for over 500 days — a period of balance that has shaken out weak hands and built a solid base. The market structure is now leaning bullish, and there’s a decent chance that BINANCE:PEPEUSDT is on the verge of an exponential move.
Let’s break it down!
🔎 Highlights
⦿ Range Structure:
Price has been locked inside a long-term range with clearly defined highs and lows. Sellers have repeatedly failed to push it below range support — a sign of underlying strength .
⦿ Post-Impulse Behavior:
The May rally created a wide candle range. Since then, price has slowly bled lower but never broke the May low. Instead, it has been oscillating within that candle’s range (consolidation after an impulse).
⦿ Volume & Value:
Currently trading above inception AVWAP and POC , both strong support references.
Price is pressing near the Value Area High (VAH).
Importantly, the zone between VAH and Range High shows thin volume development . If buyers push through VAH, there’s very little resistance until and above the Range High — meaning price could accelerate quickly.
⦿ Macro Context:
With alt season heating up, speculative capital tends to chase high-beta altcoins . Pepe has both the liquidity and narrative to be a frontrunner.
🟢 Bullish Scenario
Acceptance above VAH → swift test of Range High → successful flip into support → potential for new range formation at higher levels.
This would confirm a breakout and likely trigger momentum traders to pile in.
🔴 Bearish Scenario
Failure to reclaim VAH and a rejection at current levels could drag price back into the middle of the range. A breakdown below Range Low would invalidate the bullish thesis, but so far, buyers have defended that zone consistently.
📈 Outlook
The structure suggests imminent expansion. Given the thin value zone overhead and market-wide tailwinds, Pepe could be one of the top gainers in the coming alt cycle.
👉 Will BINANCE:PEPEUSDT accept above VAH and rip through the range high, or does it need another deeper pullback before the breakout?
——————x——————x——————x——————x——————x——————x——————
⚠️ Disclaimer: Crypto products, NFTs, Memecoins are unregulated and can be highly risky. There may be NO regulatory recourse for any losses arising from such transactions.
This content is for educational and informational purposes only and does NOT constitute financial, investment, tax, or legal advice. Cryptocurrencies are highly volatile and speculative — you may lose part or ALL of your investment. I am NOT liable for your losses.
Please do NOT copy my trades. Always consult YOUR financial advisor before making any investment or trading decisions. Or at the very least, consult your cat. 🐱
PEPEUSDT AND LONGPOSITIONAnd Pepe is a lovely and popular cryptocurrency and a great buy trading opportunity for the next three to six months with a great risk to reward.
Follow me and boost my analysis for timely and very low risk purchases and great signals.
Contact me in the comments section or private message
PEPEUSDT ( BINANCE:PEPEUSDT ) We have a bullish trend because broke latest trendline and pollback to breakeven.
Please control risk management for buy.
Targets: 0.00001200 - 0.00001280 - 0.00001370 - 0.00001550

USDJPY about to watch Clear trend join and follow up m, let keep an eye on this pair it will be incredible

$PEPE falling WEDGE breakout continuation, my entry TRIGGERCRYPTOCAP:PEPE on the 4-HOUR chart has been continuing its fallong breakout with a target 30% higher from here.
Details on the chart, a possible entry/addition only above the resistance area annoted as a golden box directly above the current price.
So, ENTRY above $0.00001175
Stop loss after the trade is live: $0.00001145
Take profit: $0.00001475
Just my feeling it will ho well👽💙

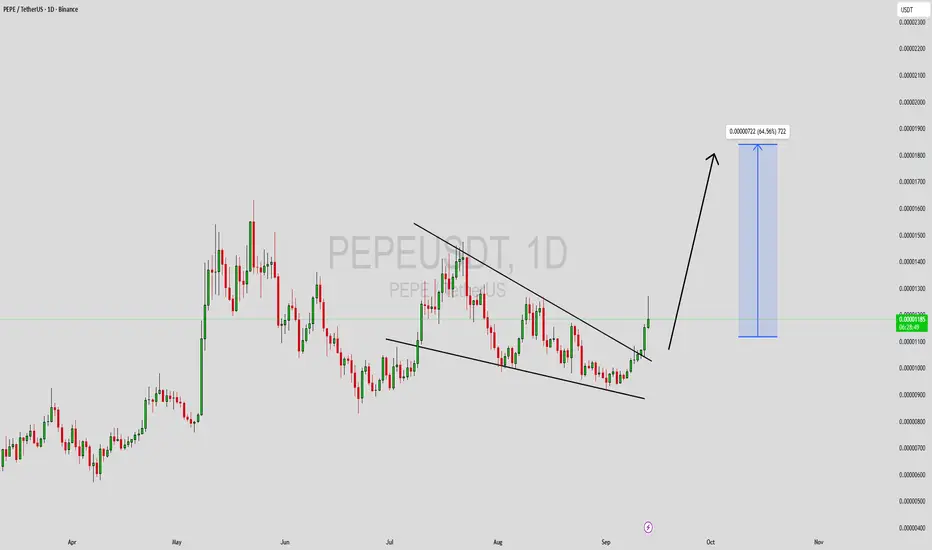
$PEPE falling wedge BREAKOUT ongoing inside a mid-term TriangleCRYPTOCAP:PEPE on the Daily chart has been stuck inside this narrowing triangle range but recently broke out from a falling wedge aand slowly on its way up.
Still, bearish market structure but above 50 and 200 SMA, we need to see bullishness on lower timeframes before it carries over to the daily chart.
Next post for the 4-hour chart☝️💙👽

PEPE ANALYSIS🔮#PEPE Analysis 💰💰
#PEPE is trading in a symmetrical triangle in a daily time frame and if it breakouts with high volume then we can see a bullish momentum in #PEPE. Before that we will see little bit bearish movement towards its support zone and than a bullish movement.
🔖 Current Price: $0.00001091
⏳ Target Price: $0.00001413
⁉️ What to do?
- We can trade according to the chart and make some profits in #PEPE. Keep your eyes on the chart, observe trading volume and stay accustom to market moves.💲💲
#PEPE #Cryptocurrency #Pump #DYOR

PEPE Bullish ? #BULL #RETRACRACMENTPepe turned previous resistance to support so their is a high chance that it will go upward

PEPE #Bullish #RetracementPepe turned previous resistance to support so their is a high chance that it will go upward

13 EMA system. Bossted?Yesterday was crazy,
there is this girl who i am pursuing
now she has a bad girlfriend.
The friend is more experienced with
dealing with guys than her.
Man i hate the friend and she is
totally a bad influence.
Am always fending off potential
lovers from the friend
Because i dont want her friends
potential boyfriends
to get my girl i understand influence very well.
Anyway am finally switching
to crypto trading as a source income.
because Forex takes about 3 months for profit
while with crypto am looking
to exit my position above the
-80 on the William %R
that is my profit taking taking
risk management strategy
because you
have to combine these two
The risk management
and profit taking
tool am using in this case is the William %r
Also am smoothing the
trade w using the 13 EMA system.
TO learn more rocket boost this content
Disclaimer:Trading is risky please learn
risk management and profit taking strategies
and use a simulation trading account
before you trade with real money.

PEPEUSDT -the easiest way to get ur capital Tripled!Let me tell you the fastest way to triple your capital at the beginning of 2026.
The CRYPTOCAP:PEPE chart looks extremely tempting right now, and since it’s one of the coins with insane price action, you really don’t want to miss this opportunity.
On the 3D timeframe , PEPE has formed a symmetrical triangle three times already—just like the one you see here—and every single time it broke out, it did so with a massive green candle that gave no chance for late entries or deep pullbacks.
Another key point: PEPE is currently in a consolidation range very similar to the one it had in 2024 before its explosive rally. But this time, the accumulation has lasted over 550 days, which makes it even stronger.
Now, here’s the real kicker—the part I’ve highlighted in green for you. If you look closely, you’ll notice that before every major breakout, the EMA 25 and EMA 50 always squeezed tightly together. That exact setup is happening again right now.
PEPE is sitting on strong support, inside a long consolidation range. Don’t miss it. Mark my words: a 3x from here is an easy target by the end of 2025.
Best Regards:
Ceciliones🎯

PEPE UPDATEHello friends
considering the decline we had, we seem to have a buying volume, but it is not yet fully confirmed and we must wait for the support or resistance to break. The targets are specified.
*Trade safely with us*

PEPE : Important and influential resistance supportHello friends
Given the decline we had, we now have an important resistance that is key to the price's rise, and if it is broken, the price can move to the specified targets.
The second scenario is that the specified support is an important support that we obtained with Fibonacci, which can be an important support area for the price in case of further decline.
*Trade safely with us*

Pepe Forms Bullish Gartley While Accumulation PersistsDespite recent volatility, Pepe’s structure shows signs of recovery. A key Gartley pattern is forming, anchored by support confirmation, offering bullish potential if momentum sustains.
Key Technical Points:
- High-timeframe support has held.
- Developing Gartley pattern signals bullish pivot.
- Point of control remains critical for continuation.
The bounce from long-term support has provided a foundation for Pepe’s current rally. This pivot aligns with the CD leg of a forming Gartley pattern, a bullish harmonic setup that favors continuation if key technical checkpoints are achieved.
Short-term focus lies on the point of control (POC), which needs to be reclaimed for momentum to extend further. Until then, Pepe’s rally remains fragile. However, consistent bullish volume has characterized the current advance, suggesting that accumulation is underway.
Past rallies faded due to lack of follow-through, but this time volume has remained steady. This strengthens the bullish argument that Pepe could carve higher levels if demand persists.
What to Expect in the Coming Price Action:
If the POC is reclaimed on strong volume, Pepe could accelerate toward higher resistances. Failure to retake the level risks a stall, but the bias remains upward as long as demand sustains.

PEPEUSDT: Fresh Breakout, Clean Support, and Meme MomentumPEPEUSDT: Fresh Breakout, Clean Support, and Meme Momentum 🐸📈🔥
This chart builds on the FXPROFESSOR 101 video — where I showed exactly how I draw trendlines and use Fib to map structure. You can watch the full walkthrough there. 🎓
Now let’s talk about the chart 📊
What I See 👀
• Price has just made a fresh breakout above the local resistance ✅
• Support 1 sits strong at 0.000000925
• Main structural support sits lower at 0.000000775
• If momentum holds, next resistance is 0.000001217
• Fibonacci Targets:
• Target 1: 0.000001474
• Target 2: 0.000001823
• Target 3: 0.000002311
These levels were derived using trendline structure + classic Fib overlays, as shown in my educational chart breakdown.
But Why PEPE? 🐸🤝
Because people I trust — serious minds, PhDs, and seasoned professionals — are watching this.
They believe in memification , in the strength of community-driven assets.
And honestly? My chart agrees. PEPE looks technically valid at this stage.
Let the chart guide you. But always stay grounded.💡
One Love,
The FXPROFESSOR 💙
Personal Thoughts: From my experience as an AI developer, I’ve learned one truth: AI will never replace human eyes or intuition. It can't help you chart, and it won’t help you feel.
Trading is a risky game — play it right, or don’t play at all. Stay sharp. Stay human. 🎯

PEPE 1D HVFPEPEUSD making an HVF. RH3 is in.
We expect the next few days to cool off a bit followed by a surge to the upside

PEPEUSDT 1D#PEPE is moving within a symmetrical triangle on the daily chart. Consider buying at the current price and near the support level of $0.00001079. If it breaks out above the triangle, the potential targets are:
🎯 $0.00001357
🎯 $0.00001481
🎯 $0.00001658
🎯 $0.00001884
⚠️ Always remember to use a tight stop-loss and follow proper risk management.

PEPEUSDT Forming Falling WedgePEPEUSDT is currently showing a falling wedge pattern, which is often considered one of the most reliable bullish reversal setups. The narrowing price action suggests that sellers are losing strength, while the good volume profile indicates that buyers are starting to step in. This setup could soon trigger a breakout, creating strong upward momentum in the market.
With expectations of a 90% to 100% potential gain, PEPE presents a high-reward trading opportunity for those looking to capture significant upside moves. Falling wedge patterns typically precede sharp rallies, especially when supported by increasing investor activity, which is now becoming evident in this pair.
Investor interest in PEPEUSDT continues to grow, as both retail traders and crypto communities are keeping a close eye on its performance. If a confirmed breakout happens above the wedge resistance, it could act as a catalyst for the next strong bullish leg, driving prices toward higher targets.
✅ Show your support by hitting the like button and
✅ Leaving a comment below! (What is You opinion about this Coin)
Your feedback and engagement keep me inspired to share more insightful market analysis with you!

Pepe Speed Resistance Fan Break OutLong time coming and good sign that pepe has broken free from the 0.7 speed resistance fan resistance.
Looking back at the last breakout with a similar breakout for confluence. Looking at 0.618 target.
Haven't spent much time on the Wave Count accuracy of late. Having said that, looking for some good and positive vibes to the upside. The other day, volume looking good, matching that "at least" close to the last all time high.
PEPE/BTC a noticeable move to the upside. Starting to gain interest. Will revert back, things are starting to look interesting again after a moment of slumber!
Stay calm. Cool, calm and collective :)
