FX Professor 101: How I Start My Charts with Trendlines & FibFX Professor 101: How I Start My Charts with Trendlines & Fib Levels 🧠📈
Some of you asked me to show my charting process again — so here it is, strictly educational, using Pepper as the example (because a few of you believe in it and asked about it). Let’s build this chart together from scratch. 🛠️
Step 1: Get Full Historical Context 📜
I always start by selecting a chart with the most data available. More history = more structure to work with. No shortcuts here.
Step 2: Anchor with Horizontal Trendlines 📏
I look for a clear support → resistance → support pattern with no manipulation. That becomes my anchor level.
Then I scan for secondary levels – if they’re too close or manipulated, I keep them dotted and as references.
Zooming in helps. Don't hesitate to get granular when needed. 🔍
Step 3: Respect the Manipulation 🤨
If a chart feels overly manipulated (wicks, fakeouts, no clear rejections), I lose trust in it. But sometimes even within manipulation, valid levels emerge — and I mark them clearly.
Step 4: Fibonacci Confirmation 🔢✨
Once I place the trendlines, I overlay Fibonacci retracements to see if they align. In this case, one of my levels landed exactly on 0.618 – no cap! 😂 That’s when experience meets structure.
Final Notes 🧘♂️
• Only two levels made the final cut
• Secondary levels marked with dotted lines
• 0.618 Fib validated the primary structure
• Support at 929 is looking strong as of now
This is my process. It’s how I start every serious chart. Nothing fancy — just history, structure, and experience. If it helps even one of you out there, I’m happy. 💙
One Love,
The FXPROFESSOR 💙
Food for Trading Thought:
From my experience as an AI developer, I’ve come to one firm conclusion — AI will never replace us. It can assist, but it can’t see what you see or feel what you feel. The real edge in trading is your human intuition, patience, and discipline.
Trading is a game — a risky game. Play it right if you're going to play it at all.
Stay human and remember: the best Blockchain is YOU, the best Altcoins are your loved ones and your work/creation/purpose in life. 🎯
PEPEUSDT.5S trade ideas

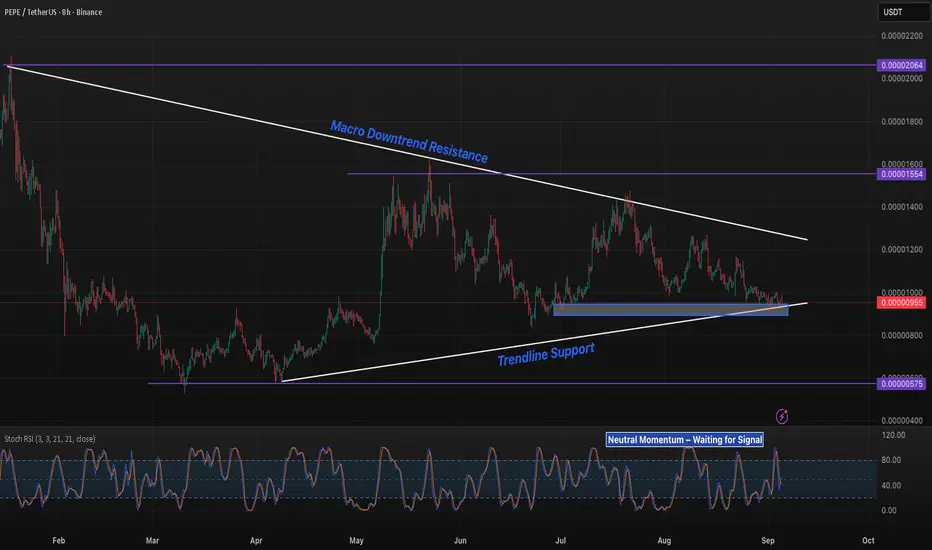
PEPE 8H – Compressing Between Trendlines, Liquidity Above 15–20PEPE is consolidating inside a tightening wedge between descending resistance and rising trendline support. Price is currently reacting at the demand zone near 0.0000095.
Upside resolution would target liquidity levels at 0.0000155 and 0.0000206. A breakdown, however, exposes lower liquidity at 0.0000057.
Stoch RSI is mid-range, showing neutral momentum and signaling that the next confirmed breakout will likely define direction.
Idea for PepeFor CRYPTOCAP:PEPE #PEPE, it looks like the main nearby long trader liquidations have been collected, and the next target seems to be the liquidation of short traders at a price of $0.000010000 (+6%) from the entry point.
Let’s see how it plays out.
Entry price: $0.000009445
Take Profit: $0.000010000 (+6%)

pepe will hit 0.00005 in next 4 month !! buy in 0.0000040pepe is one of the most bullish altcoins in this year. pepe has been completed its main wave 1 from Elliott's wave theory. I think the price will drop to 0.0000040 (due to Bitcoin price correction which may correct to $100k) and this point is the end point of wave 2. Wait and buy pepe at this time.


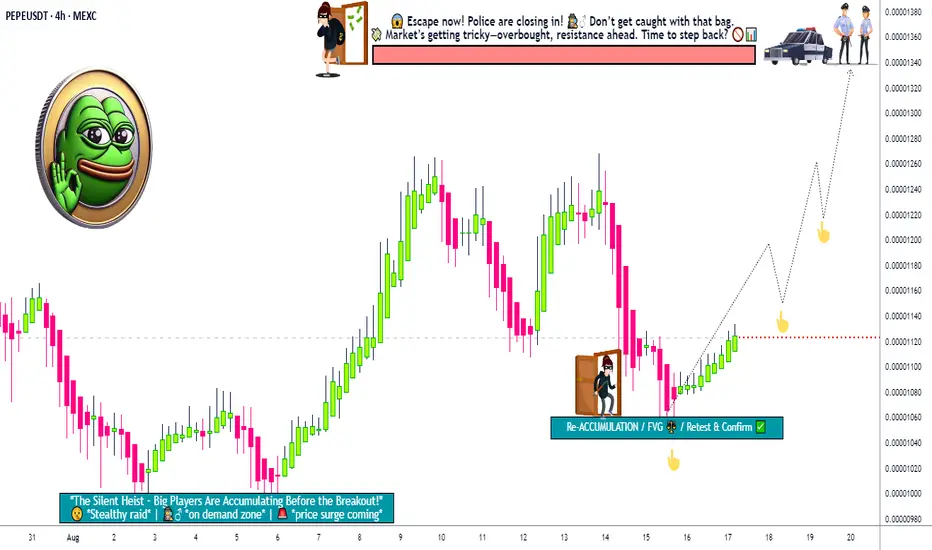
PEPE Bullish Attack Plan – Layer Entry, Escape Before Trap!💚🐸 PEPE/USDT Crypto Market Heist Plan 🕵️♂️💰
🌍 Hello Thief OG’s, Market Robbers & Money Grabbers!
Today we prepare a Bullish Heist on the PEPE/USDT Crypto Market – vault doors are open, the police are distracted, and the layers are waiting! 🚨💸
🏦 Entry Plan (Thief Layer Strategy) 📈
We don’t enter once – we layer like shadows breaking into the vault!
🔹 Layer 1: 0.00001120 (First Dip Grab!)
🔹 Layer 2: 0.00001110 (Double Down!)
🔹 Layer 3: 0.00001100 (Triple the Steal!)
🔹 Layer 4: 0.00001080 (Final Heist Before Escape!)
Add more layers if you’ve got extra bullets in your magazine 🎯🔫
Any price entry allowed if you want to jump in directly – but layering = true thief style! 🕶️
🛑 Stop Loss (Thief Escape Hatch)
📍 SL = 0.00001140 (Default Thief SL)
Adjust based on your personal risk, lot size & money bag capacity 💼💵
Remember: a thief escapes, never gets caught! 🏃💨
🎯 Target (Police Barricade Zone)
🚧 Police waiting at 0.00001400 – DO NOT get greedy!
🎯 Official Thief Exit: 0.00001340 (Escape before they lock the doors)
Grab the loot, disappear into the shadows… 🔐💰
📢 Quick Notes for Robbery Crew
This is a bullish robbery only – no shorting the thief’s plan.
Use multiple limit orders = higher chance of looting success.
Scalpers = small bags, Swing traders = big vaults. Choose your role wisely! ⚔️
💥 Support our Robbery Gang 💥
Smash that BOOST BUTTON so our thief crew grows stronger and wealthier together! 🤑💸🚀
Stay alert thieves, another heist drops soon! 🕵️♂️🐸💎
📌 This is a general market heist plan, not personal financial advice. Adjust your robbery tactics based on your own risk & style.
Can PEPE make a new ATH?!PEPE came out during the APR-2023 Bear Market and was an instant hit meme in the community. PEPE has already made a +5000% gain from its inception to current price point of 0.00000991.
PEPE is currently in a ' symmetrical triangle ' which is typically regarded as a neutral pattern with price consolidation currently in process.
I believe that PEPE is in its final wave (5) count for the finale for Alt season. Once we see further liquidity come through via ETH|USD and ETH.D, we should see the likes of DOGE pump followed by other memes like Pepe to follow as well. Keep an open mind that Pepe is also presenting declining volume which is a sign that it's likely to be in its final phase of the bull market.
Key Take Profit Targets:
0.000002855 (Potential for a 'double top')
0.000003765 (Likely ending as it would be a ~275% pump from current price)
0.000005495 (moonshot)

PEPE 4H – Testing Key Demand Zone, Can 9.5–9.8s Hold the Floor?PEPE continues to consolidate on the 4H chart, pressing into the major demand zone between 0.00000950–0.00000980. This area has acted as the base of multiple rebounds since early August, making it the most critical level on the short-term chart.
EMA Structure: Price remains suppressed below the 20/50/200 EMA cluster (0.00000999–0.00001092), all of which are now stacked bearish. Bulls must reclaim these levels to shift momentum.
Support/Resistance Levels:
Support: 0.00000950–0.00000980 (demand zone). Losing this opens the door to deeper retracement toward 0.00000900.
Resistance: 0.00001100 remains the first upside barrier, followed by 0.00001250.
MACD: Bearish momentum persists, with histogram values expanding below zero — signaling pressure remains to the downside.
Stoch RSI: Deep in oversold territory, hinting at a possible short-term bounce if buyers step in at the demand zone.
Key Scenarios:
Bullish Case: A strong defense of 0.00000950–0.00000980 combined with Stoch RSI recovery could spark a relief rally into 0.00001100 resistance.
Bearish Case: A decisive break below 0.00000950 risks continuation into 0.00000900, with potential for further breakdown if market weakness persists.
PEPE is sitting directly on make-or-break support. The next reaction here will determine whether this is another bounce zone or the start of a fresh leg lower.

Critical PEPE/USDT – Bullish Reversal or Bearish Continuation?🔎 Overview
PEPE/USDT is currently trading around 0.000010155, sitting right at a key demand zone (0.00000950 – 0.00001100) that previously acted as a major resistance and is now being retested as support.
This zone is a decision point that will likely define whether the market builds a bullish base for the next leg up or breaks down into deeper lows.
---
🟢 Bullish Scenario
Confirmation: Daily close above 0.000012331 with strong volume.
Upside targets:
1. 0.000014178 (+39%)
2. 0.000015456 (+52%)
3. 0.000016836 (+65%)
Extended targets: 0.000021533 – 0.000026414, with a potential retest of 0.000028364 (+179%).
Supporting structure:
Current zone may act as an accumulation base.
Strong wick rejections with high volume here would signal smart money accumulation.
---
🔴 Bearish Scenario
Confirmation: Daily close below 0.00000950.
Downside targets:
First: 0.00000800 – 0.00000700.
Final target: 0.000005250 (−48% from current level).
Supporting structure:
Failure to form a higher-low will turn this into a descending structure.
Bearish confirmation comes if price retests this zone as resistance after breakdown.
---
📌 Price Action & Pattern
Range-bound: Price has been consolidating between 0.00000950 – 0.00001680, signaling accumulation or distribution before the next major move.
S/R Flip: The yellow zone is a historical level (former resistance, now acting as support). This is the most crucial zone on the chart.
Possible Wyckoff Accumulation: If the zone holds, this could form a spring setup around 0.00000950.
---
🧭 Trading Plan & Risk Management
Conservative Long: Enter after daily close above 0.00001233. SL below 0.00000950. Take profits at resistance levels.
Aggressive Long: Scale in within the current demand zone (0.0000095 – 0.0000101). SL under 0.0000090. Higher risk, higher reward.
Short Setup: Enter on confirmed daily close below 0.00000950. TP at 0.0000070 – 0.00000525. SL above 0.00001100.
Risk Rule: Keep exposure limited (1–2% of capital per trade). Always prepare for fakeouts at decision zones.
---
✨ Conclusion
The 0.00000950 – 0.00001100 zone is the last stronghold for bulls.
If it holds → potential rally up to +170%.
If it breaks → market likely heads back to 0.00000525.
Key: Wait for confirmation, respect stop-loss, and scale out profits at major resistance levels.
---
PEPE/USDT Daily is testing a critical demand zone (0.00000950 – 0.00001100).
➡️ Bullish if it holds, targets up to 0.000014 – 0.0000215 and even 0.0000283.
➡️ Bearish if broken, downside risk toward 0.0000070 – 0.00000525.
📌 This is a decision zone – patience and confirmation are key.
#PEPEUSDT #PEPE #Crypto #Altcoins #PriceAction #SupportResistance #Breakout #Bullish #Bearish #RiskManagement #SwingTrade #CryptoAnalysis

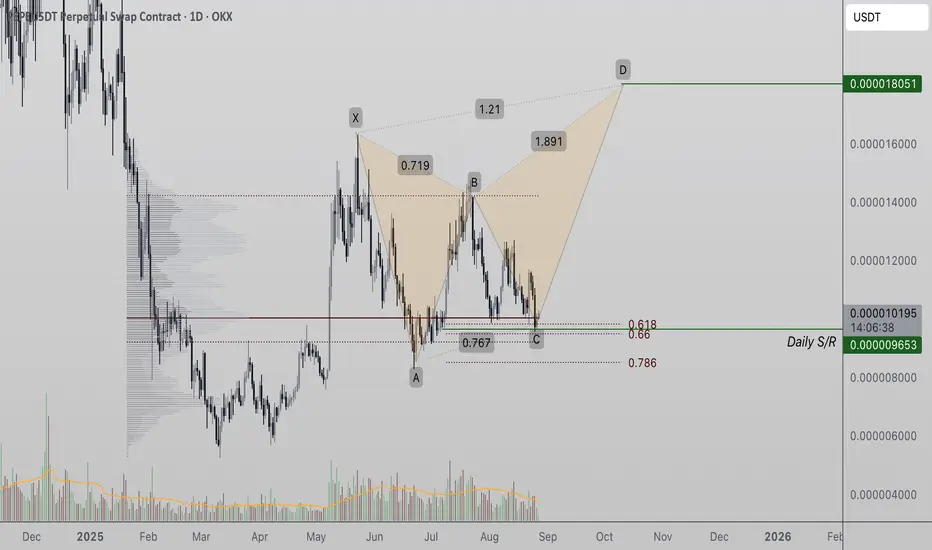
Pepe Shows Bullish C-to-D Extension Pattern With Potential RallyPepe (PEPE) is forming a bullish C-leg to D-leg extension while trading at daily support. With multiple technical confluences in play, the setup suggests potential for an impulsive rally higher.
Pepe’s price action is currently consolidating at a crucial support zone that holds multiple bullish technical signals. With the 0.618 Fibonacci retracement and the point of control aligning here, the foundation for continuation appears strong. The ongoing development of a C-to-D extension pattern is further enhancing bullish sentiment, indicating that Pepe may be preparing for a rally above the value area high.
Key Technical Points:
- Strong Support Zone: Daily support aligns with the 0.618 Fibonacci retracement and point of control.
- C-to-D Extension in Progress: Pattern suggests continuation toward higher levels once momentum returns.
- Macro Bullish Structure: Higher-low projections remain intact, reinforcing the case for a new higher high.
Pepe’s current support level is one of the most important technical zones for its ongoing market structure. The 0.618 Fibonacci retracement, often considered the “golden ratio” for reversals and continuation, is paired with the point of control, highlighting a dense area of trading volume and demand. This confluence provides the market with a strong base for potential expansion.
The bullish C-leg to D-leg extension currently being established suggests the market is preparing for another impulsive rally. Such harmonic patterns typically indicate a continuation of trend when demand holds at critical retracement levels. If Pepe sustains above daily support and accelerates higher, the next leg of this pattern will likely drive price action above the value area high.
From a macro perspective, Pepe’s market structure remains decisively bullish. The higher-low projections continue to signal strength, maintaining a structural path toward new highs. As long as price action respects this projection, the bullish trend remains valid. A rotation toward the highs would reinforce this macro outlook and potentially set the stage for a new higher high in the weeks ahead.
What to Expect in the Coming Price Action:
As long as Pepe holds daily support at the confluence of the 0.618 Fibonacci and point of control, the probability of continuation increases. A sustained rally could complete the C-to-D extension and push price above the value area high. However, failure to defend support would weaken the bullish case and delay the pattern’s completion.
PEPE 8H – Golden Pocket Test Inside Descending ChannelPEPE continues to trade inside a descending channel, currently sitting within the Fib Golden Pocket range.
Bullish path: A hold here and reclaim toward the mid-levels could set up a run to the upper channel trendline.
Bearish path: Failure to hold opens downside into the lower support zone, with deeper liquidity resting near the bottom of the channel.
Stoch RSI is curling from oversold, giving momentum confluence for a possible reaction.

PEPE : GOOD POINTHello friends
Given the good growth we had, the price has now corrected and is in a good support area.
I think if this range is maintained, the price will grow to the specified targets.
*Trade safely with us*

PEPE outlookPepe reject what I believe is a strong support I am seeing a higher price from this level

Weekly trading plan for PepeLast week, Pepe faced resistance at the monthly pivot point, which triggered a downward move. At the moment, the price has reacted from S2 and is trying to bounce. Considering the rejection from the monthly pivot point, it would be logical to reach the monthly S1 at 944 along with a break of the nearest ascending trendline.
In the near term, the price may stay in consolidation. Only after breaking above 1031 could we see a move toward the weekly pivot point. Until that level is broken, the structure remains bearish, with the target being the support zone and this week’s S3 level.

suport line fpr #pepeusdt long positionGreetings to my dear friends
From Pepe to the buying cycle to the 5% target
This strategy is spot and has no stop until the next range where you have to enter with double the capital, so capital management is important
Pepe LongCRYPTOCAP:PEPE looking good after a s/r flip in a key area, now in an uptrend. Bought here at 0.011. Red line = stop

Pepe longs Pepe longs
Loading here
Looking for a breakout at 0.000011696
Targets
0.000014834
0.000016352
0.000028417
Possibly breaking all time highs.

PEPE 5D – Breakout Retest or Failed Rally Ahead?PEPE has been consolidating after breaking out from its long-term descending trendline, with price now hovering just above the retest zone. This is a critical area to determine whether bulls maintain control or if the move fades back into the broader range.
Bullish case: Holding above the trendline could validate the breakout and open upside toward the first resistance at 0.00001632, with extended targets at 0.00002107 and 0.00002837 if momentum expands.
Bearish case: Failure to hold this retest risks sending PEPE back into the base accumulation zone (0.00000075–0.00000100), erasing the breakout structure.
Stoch RSI is still in lower territory, showing momentum is cooling — but it could also suggest space for a renewed push if buyers step in here.
Key levels to watch:
Retest zone: ~0.00001050–0.00001100
Upside targets: 0.00001632 → 0.00002107 → 0.00002837
Downside invalidation: Lose support and revisit 0.00000075–0.00000100
PEPE sits at a decisive moment: confirm the breakout or slide back into the long-term range.

PEPE at the Edge of Disaster or the Start of a Monster Reversal?Yello Paradisers, is PEPE about to break free from its falling wedge or are we staring at another brutal sell-off? After weeks of pressure to the downside, price is now testing the $100–$105 demand zone. This level has been the battleground where bulls and bears repeatedly clash, and the move from here could decide the next big trend.
💎A confirmed breakout above descending resistance would validate the wedge pattern and open the path higher. The first target sits at $1184, with possible continuation into the $1240–$1271 supply zone as momentum builds. This would mark the beginning of a powerful shift in market structure.
💎On the other hand, failure to hold demand and a breakdown below $947 would invalidate the bullish setup completely. In that scenario, selling pressure would accelerate as trapped longs get forced out, driving price into deeper lows.
💎This is a textbook example of why patience is crucial. Jumping in too early means risking a trap, while waiting for confirmation allows you to act only on the highest-probability setups. The market is coiling for a big move, but only those who stay disciplined will come out on the winning side.
Trade smart, Paradisers. Consistency and patience always beat emotions. The winner circle is reserved only for those who know how to wait.
MyCryptoParadise
iFeel the success🌴


PEPE Liquidity Rejections At HighsPEPE remains locked inside a descending channel, with liquidity grabs repeatedly rejecting near channel resistance.
The last two rallies both swept liquidity above 0.0000126–0.0000130, before reversing lower.
Current price sits mid-range around 0.000103, testing the lower boundary of the purple box.
Breakdown below 0.0000999 would likely extend toward channel support.
Bulls need a clean reclaim of 0.0000126–0.0000130 to flip momentum.
This setup shows how liquidity sweeps at the top of ranges inside channels can mark exhaustion, while support levels provide key decision points.

PEPE 4H – FVG Re-Test Before Liquidity Sweep?PEPE is climbing into a cluster of FVGs near 0.00001080–0.00001100, where imbalance supply is likely to cause the next reaction. If rejected, price is set to sweep into the 0.00001000 liquidity pool before any larger move develops.
FVGs (0.00001080–0.00001100): First reaction zones above.
Liquidity Below: 0.00001000 is the key pool to test.
Expansion Path: A clean sweep + reclaim could fuel a breakout toward 0.00001300.
Momentum: Stoch RSI overbought, signaling caution on chasing highs.
Scenario favors a liquidity sweep at 0.00001000 before a potential breakout leg upward.

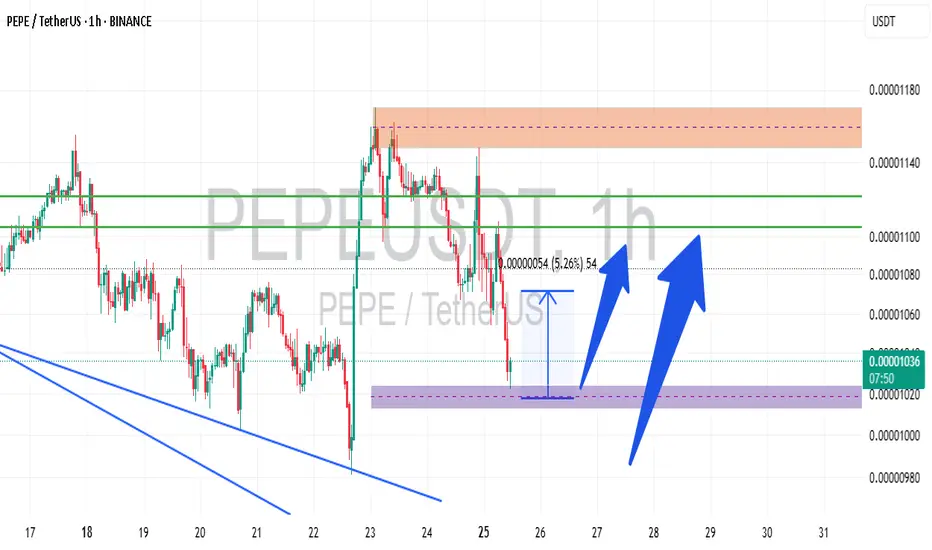
Pepe BUY There was a short term SELL back to the support zone and a bullish candle has already formed.
The point of entry would be immediately after the current candle closes and the next opens above 0.00001055.
The take profit is 0.00001420.
