$PEPE weekly outookPEPE is showing strong momentum as it eyes the $0.0001 level, a key psychological resistance. This setup feels like history repeating itself - similar to the explosive rallies we’ve seen before. If momentum sustains, we could be looking at a potential 1000%+ move from current levels.
Key Points:
- Strong weekly structure building higher lows.
- Psychological target: $0.0001 as the next milestone.
- High-risk/high-reward — volatility remains extreme, manage positions carefully.
PEPE continues to prove that meme coins aren’t just hype - they can repeat history with massive upside moves. Traders should watch for breakout confirmations and volume surges before chasing.
Trade ideas

PEPE LONGpepe Breaks 1hr resistance , that is a good Bullish signal to go long targeting daily order block

PEPE support under pressure PEPE has multiple tests of the 900-sat support level, with the next support at 600 sats, representing a 30% potential move. There is a high probability of a breakdown.

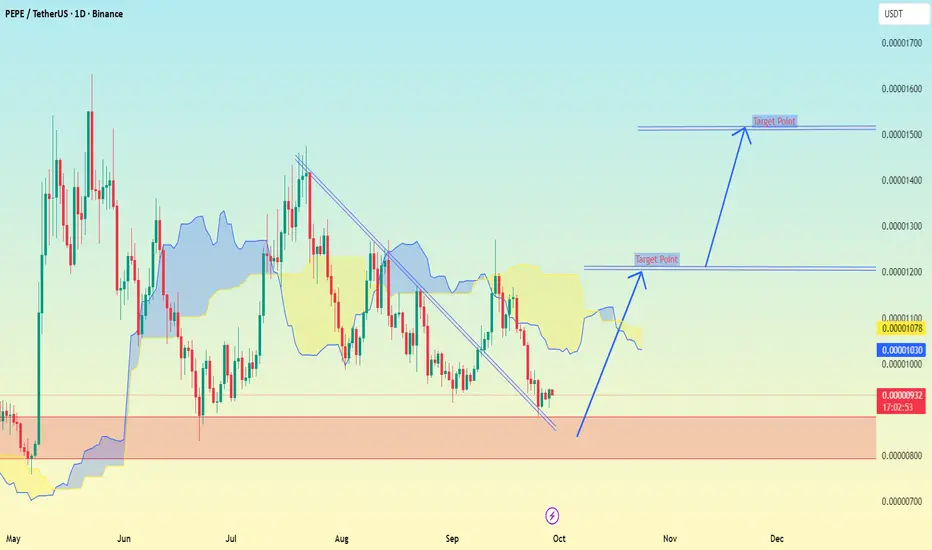
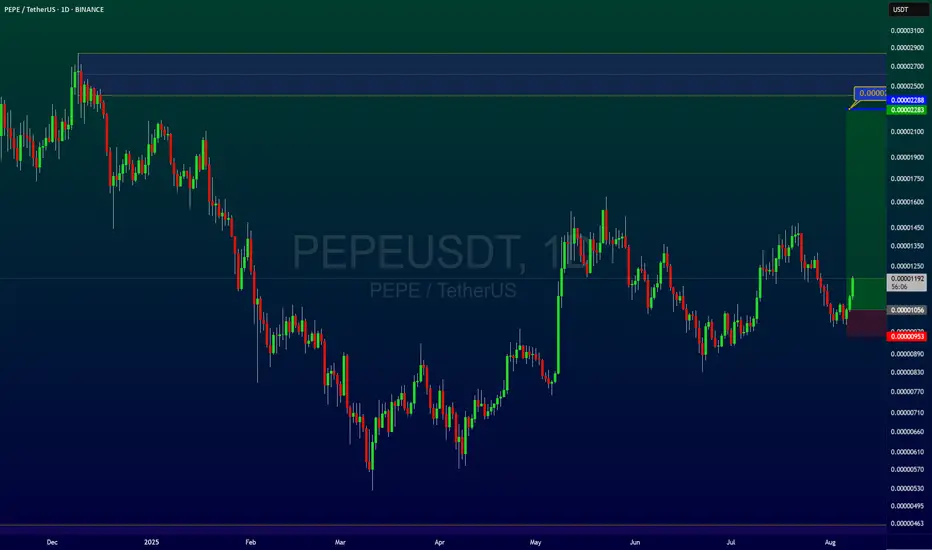
PEPE/USDT (1D chart) setup clearly ..PEPE/USDT (1D chart) setup clearly with the support zone and two marked target levels. Based on your chart:
Strong support zone: 0.00000082 – 0.00000090 (red shaded area).
Current price: around 0.00000093.
📌 Upside Targets (as per my chart):
1. First Target → 0.00000120
2. Second Target → 0.00000155 – 0.00000160
⚠ Key notes:
As long as PEPE holds above 0.00000082 support, bullish momentum is valid.
A daily close above 0.00000100 – 0.00000105 would confirm strength towards the first target.
If it breaks below 0.00000082, downside risk increases toward 0.00000070.
👉 Summary:
Target 1 → 0.00000120
Target 2 → 0.00000155 – 0.00000160
Support to watch → 0.00000082
How To Use the #1 Entry SignalAm trying to understand
how to best love my family.
Its not been easy as i learn how to trade.
This skill is kind of invisible.
So its very difficult if you come
from a poor back ground to
explain the financial markets.
The truth is the financial markets
have been around
since the beginning of civilisation
And back in the day they used
different technology to calculate
the financial markets.
In today's world you are at an advantage
because you understand computers.
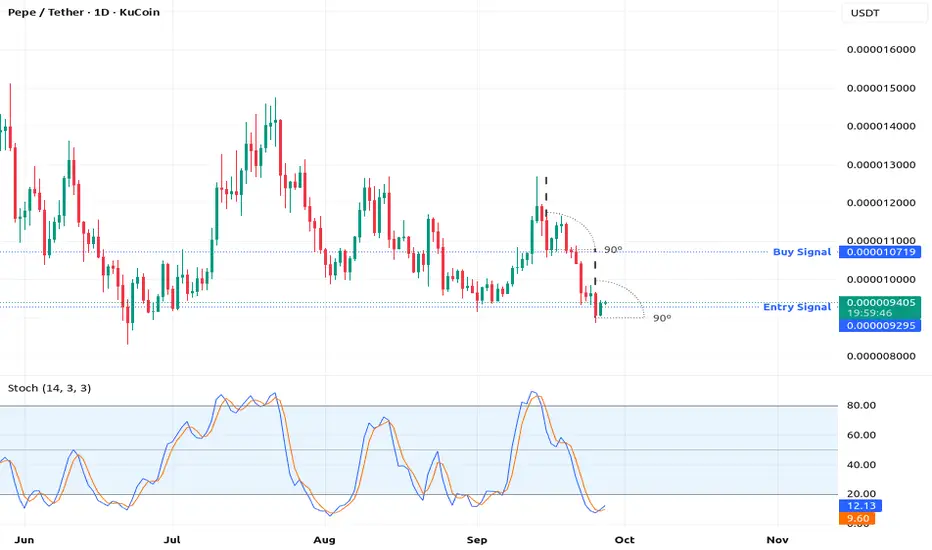
Now look at this chart look at the 90 degree
angles.
Look at the stochastic
Robert kiyosaki says its like
landing a crashing helicopter.
You first have to turn off the engine
Let the helicopter nose dive.
Then you pull the front of
the crashing helicopter.
Meanwhile as you nose dive you
are throwing away every thing that makes
the helicopter heavy,
As you are about to reach the surface...
pull up let the helicopter slide on
its bottom
Its called "Crash Landing"
This story i got from Robert Kiyosaki
Is the best way i could explain to
you trading psychology
of buying in a reversal trading system.
Look again at the stochastic
the blue line has crossed above the
orange line this is your entry signal
this is the time to enter this trade.
Rocket boost this content for you to learn more.
Disclaimer: Trading is risky please learn
risk management
and profit taking strategies.
Also feel free to use a
simulation trading account.
BUY AND HOLDHello friends
Given the potential and good support that this currency has, with the growth of Ethereum, it can experience another upward rally. Now that the price has corrected, you can buy in steps with capital and risk management and move with it to the specified goals.
Note that the holding period is at least 3 months, so be patient and observe capital management.
*Trade safely with us*

The #1 Entry SignalHello sorry for being quiet.
Am gong to tell you the reason.
These past days have
been crazy as am learning
about business taxes.
Also i remember this one lady
that for some reason used to tell me
everything that's wrong with me.
But never at one point
complimented my efforts.
Am talking to you my
sister.
Sometimes all you need to do is
give a man a compliment
for him to know that you
are really interested in him.
Going for a man that has money
is not always
the answer my dear sister.
Listen i have a good sister
thats married.
She always compliments
my business dreams
she always congratulates me when
i do something that am proud
of myself in doing
This sister of mine is so confident
in herself that her husband
is confident in her.
This means he trusts her so much
And he knows i love her as a sister.
To the point that i tell her to
always submit to him.
Do you see what am saying?
Imagine the weight that carries.
To where me as her brother
is encouraging my sister
to submit to her husband...
Thats the support that you will
need if you want a good man, my
sister the answer is simple
be good as well and
read books on relationship
and marriage that support
you especially
if that's what you desire.
What if your marriage doesn't
work out ?
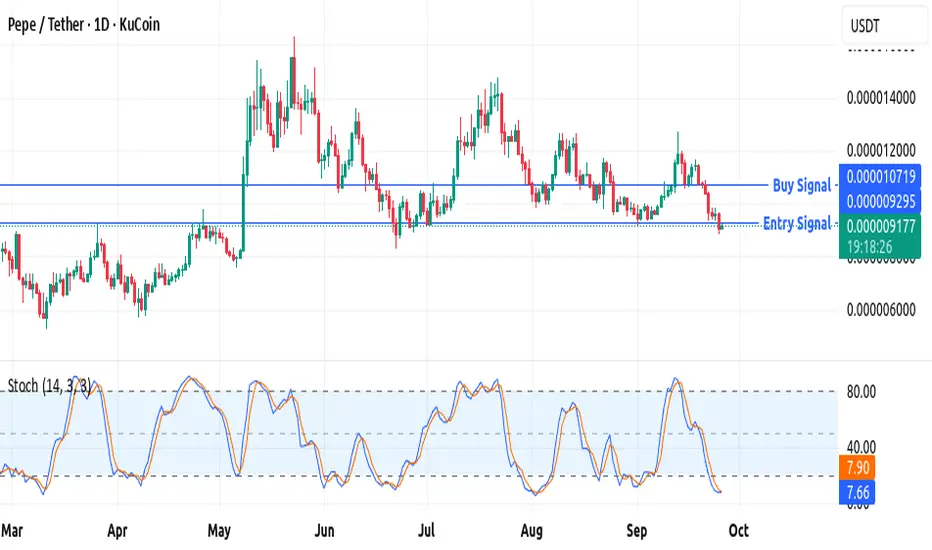
This chart has a buy signal
but its like a failed marriage.
So it crashed.
We are looking for a "CORRECTION"
That correction is your entry signal.
In order to see the correction we use the
stochastic indicator
What happens is the lines
crossover below the
the 20 level line.
Look at the chart to see
clearly
what am talking to you about.
This correction is the relationship
getting fixed,
This correction is me as your brother
dear sister telling you
to submit to your husband
Study the stochastic indicator
Also please rocket boost
this content to learn more.
Disclaimer:Trading is risky please use
a simulation trading account
and learn risk management and
profit taking strategies.
PEPEUSDT 200% pump now or after fall +400% gainit is all clear on chart at right corner of it we have two scenarios now one is -40% fall and then about 400% gain and the other one is pump from here and weekly support which is touching if it hold and gain of +200% to the targets.
DISCLAIMER: ((trade based on your own decision))
<<press like👍 if you enjoy💚

PEPE #BULLPepe is on the verge of Bullishness I would like to see a big candle closing above for confirmation

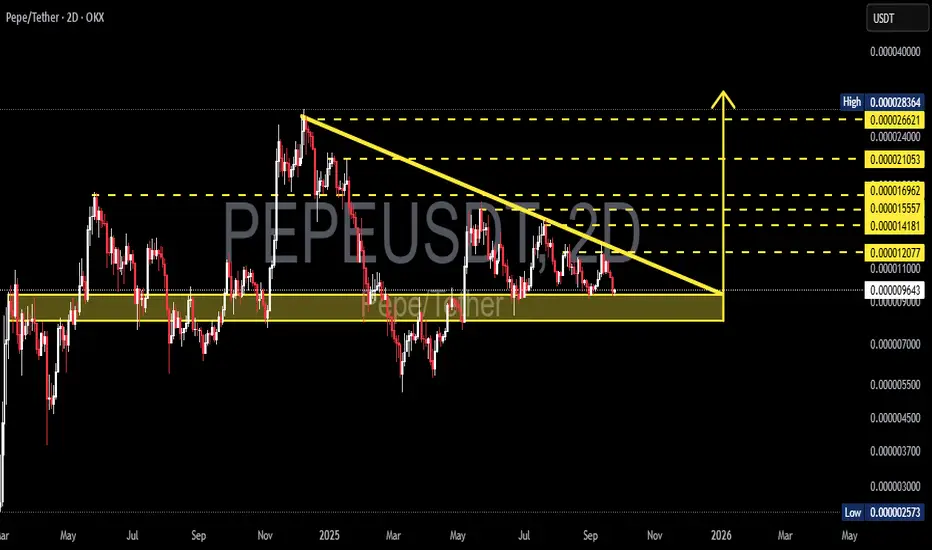
PEPE/USDT — Descending Triangle: Breakout or Breakdown?🟡 Chart Structure
PEPE is currently in a critical phase. The price has been forming a descending triangle (lower highs + horizontal support) for several months.
Current price: 0.000009638
Major Support Zone: 0.000007000 – 0.000011100 (yellow box)
Key Downtrend Resistance: descending yellow trendline from 2025 highs
Upside Levels: 0.000012077 → 0.000014181 → 0.000015557 → 0.000016962 → 0.000021053 → 0.000024000 → 0.000026621
Extreme Low: 0.000002573
---
🟢 Bullish Scenario — The Big Breakout
If PEPE breaks above the downtrend line and closes above 0.000012077 with strong volume, then:
1. The descending triangle breakout will be confirmed.
2. Measured Move Target:
Pattern height = (High 0.000028364 − Support 0.000009638) = 0.000018726
Added to breakout level (0.000012077 + 0.000018726) = 0.000030803
Potential upside: +220% from current levels.
3. Likely progression step by step:
Short-term resistance: 0.000014 – 0.000017
Next milestones: 0.000021 – 0.000024 → 0.000026+ toward the final target.
4. If confirmed, this could be one of the strongest rallies of the year for PEPE.
---
🔴 Bearish Scenario — Breakdown Risk
Statistically, descending triangles tend to lean bearish. If the yellow support zone (0.000007000 – 0.000009000) breaks with volume, then:
1. The structure fails and selling pressure accelerates.
2. Downside targets:
0.000005000 → 0.000003000 → extreme low at 0.000002573.
3. From current price to 0.000002573 = -73% downside risk.
4. Failure to hold support could trigger a sharp continuation of the bearish trend.
---
📐 Technical Pattern — Descending Triangle
Meaning: sellers keep pushing lower highs, while buyers defend one horizontal area.
Bias: bearish continuation by default.
But… if bulls break the trendline, it flips into a powerful bullish reversal signal → often followed by rapid rallies.
---
🧠 Key Notes for Traders
Don’t enter trades just because price touches support or resistance → always wait for a 2D candle close + volume confirmation.
Breakout: avoid FOMO, wait for a retest of the breakout area for a safer entry.
Breakdown: avoid holding longs → prepare for deeper support tests.
Risk management is crucial: use stop-loss and proper position sizing.
---
✨ Conclusion
PEPE is at a major crossroads:
Breakout → upside potential to 0.000030803 (+220%).
Breakdown → downside risk to the historical low around 0.000002573 (−73%).
This is not just sideways consolidation — it’s a decision zone that could define PEPE’s next big move for the months ahead. Traders should be prepared for both scenarios with strict discipline.
---
#PEPE #PEPEUSDT #Crypto #Altcoins #TechnicalAnalysis #Breakout #SupportResistance #DescendingTriangle #CryptoTrading
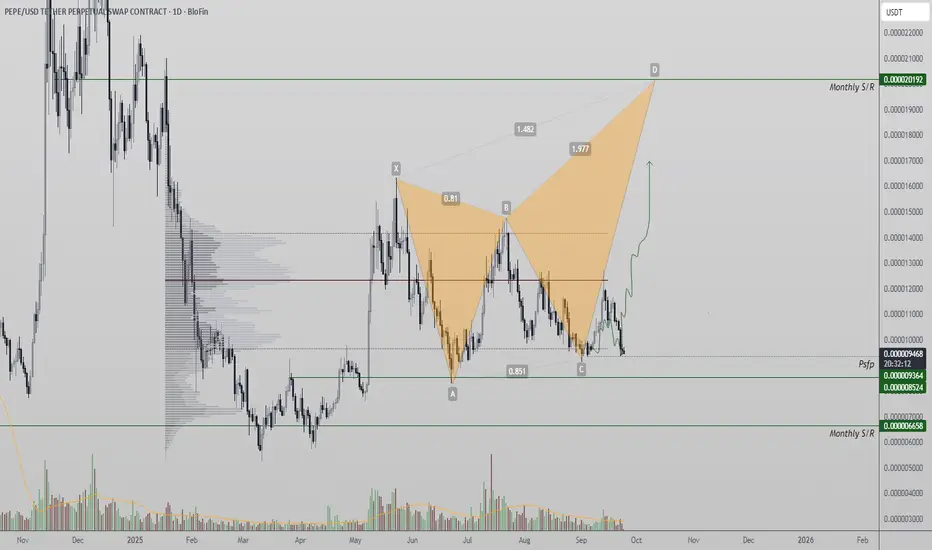
Pepe Holds Harmonic Structure as Key Pivot Low Remains UntouchedPepe is defending a critical harmonic pattern setup despite recent corrective pressure. The integrity of the structure hinges on maintaining the pivot low, keeping the bullish harmonic path alive.
The price of Pepe has recently undergone a correction, sparking debate about the validity of its ongoing harmonic pattern. Traders tracking the Gartley setup remain focused on one key level: the pivot low labeled “C.” As long as this level holds, the harmonic structure is intact, and the probability of continuation remains strong. A breakdown, however, would invalidate the current path and force analysts to consider alternate harmonic formations.
Key Technical Points:
- Gartley Harmonic in Play: Current structure hinges on pivot low “C.”
- Correction Still Valid: Recent pullback has not negated the pattern.
- Pattern Invalidation Trigger: Breakdown below pivot low opens alternate harmonics.
Harmonic trading relies on precise pivots and Fibonacci-based projections. Pepe’s ongoing Gartley harmonic remains valid because the current corrective move has respected the pivot low “C.” This makes the level a line in the sand for both bulls and bears.
If price were to break below the pivot, the harmonic pattern would be considered invalid, requiring traders to reassess. In many cases, an invalidated harmonic transitions into a new structure such as a Bat or Butterfly, which often shifts both the retracement depth and the ultimate price targets. For now, however, Pepe remains aligned with its original harmonic path.
The correction itself reflects a healthy pullback rather than structural weakness. In fact, such pullbacks often serve as accumulation phases within larger patterns, helping set the stage for the next leg higher. Momentum indicators are neutralizing, and traders are looking for confirmation that buyers are willing to step back in at this technically significant area.
Historical harmonic structures on Pepe have tended to respect key Fibonacci pivots before generating sharp expansions. This history adds weight to the current setup, suggesting that the technical community is watching closely. Volume behavior, however, will be critical — an uptick in demand at this level could set off the next bullish harmonic leg.
What to Expect in the Coming Price Action:
If the pivot low holds, Pepe could see renewed upside as the Gartley harmonic completes its projection path. A breakdown below this level would invalidate the structure and likely transition into a secondary harmonic setup. Traders should watch for volume inflows to confirm whether this key level holds.
PEPE Hold This Zone or Risk Heavy DropCRYPTOCAP:PEPE is currently sitting at the mid S/R zone after a series of rejections from the upper resistance area. This zone is acting as a key decision point, holding here could trigger a bounce back toward the higher range, while losing it might drag price down toward the major support zone below.
In short, PEPE is in a make-or-break area. Buyers need to defend this mid zone to keep momentum alive, otherwise the chart risks rolling over toward deeper support.
DYOR, NFA
#PEACE

PEPE PEPE looks Bullish to me 🙏 , I am expecting a strong 1 hr Bullish candle to close above the 4 hr resistance to fully confirm the Bullish bias

The #1 Trading Mindset Shown On This ChartMan this is crazy there is this girl
that am digging.It was crazy i just
spoke my mind
bro she kept laughing..i honestly
dont think am very funny.
But she kept laughing
at my talk.
She insisted i see her tomorrow again.
Now am doubting if am ready to be
in a relationship with her.
Anyway we will see how this goes.
I will update on the story. Tomorrow,
after i see her tomorrow.
Meanwhile there is this other girl that
i really love but she doesn't see me man.
Its like i don't have a body
Bro she ignores me like
no mans business
i cant even get her attention.
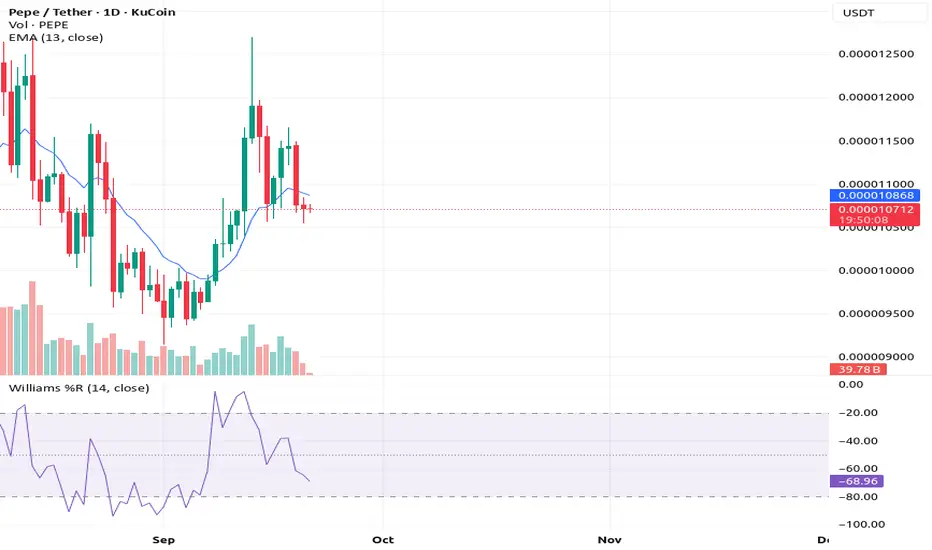
Look at this chart KUCOIN:PEPEUSDT
what you see is a doji .
Thats fear my friend.
This is when you have to enter
During fear.
The price action looks like a double
bottom meanwhile
on the momentum chart below
you can see a new low..
Have you seen the new low
on the william %R ?
This is very important for you
to understand because
this is called the new high new low
chart pattern .
Its pure trading psychology at
its best and am sharing it with you.
Rocket boost this content to learn more.
Disclaimer: Trading is risky please risk management
and profit taking strategies.Also feel free
to use a simulation trading account before you
trade with real money.
PEPE; FREE SIGNAL!!!Hello friends
Given the buyers' support for the price and the downtrend breakdown, if the two specified supports are maintained, the price can move to the specified targets.
*Trade safely with us*

PEPE is near weekly support If it hold this major weekly support of 0.000010$ then we can see at least 2x here on chart which is easy target for it but also any breakout here to the downside cause two months at least dump and boring range and then pump is expected like second path on chart.
DISCLAIMER: ((trade based on your own decision))
<<press like👍 if you enjoy💚

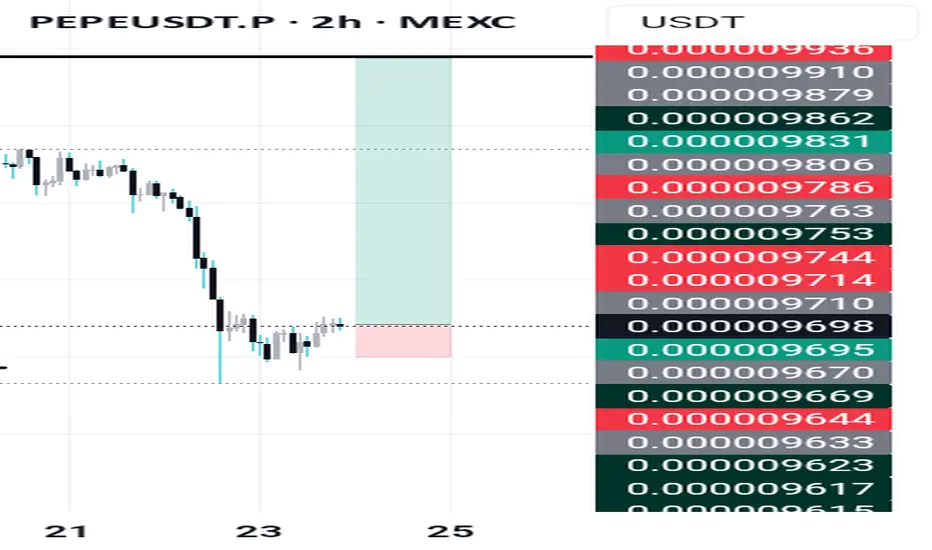
The Power Of Risk Management - "i want 100% profit!!"Am angry let me tell you the reason.
I was up about 50% profit on this trade...
guess what? i didnt take profit...
I feel so stupid and helpless
because am following my risk management
to the T..meaning i have to cross
my t when writing.
Dont fear volatility.
The entry was at a higher low .
Now it has dropped to a new low .
What makes this the perfect re-entry?
its because people, buyers and sellers, are fearful.
The buyers and sellers are fearful right now.
Imagine 3 days of profit Poof!!! gone!!
And here you are holding the bag on this trade.
Meanwhile the short term investors have taken
their share of profit
Am sticking to risk managment buddy.
i want 100% profit!!
Look at this chart KUCOIN:PEPEUSDT
you will see two things:
1-The bullish harami
2-The doji
The bullish harami shows you reversal entry.
The doji shows you fear.
Dont let fear stop you.
Also look at the william %R have you seen the New low?
Rocket boost this content to learn more.
Disclaimer: Trading is risky.Please learn risk management
and profit taking strategies.
Also feel free to use a simulation trading account
Before you trade with real money.
Full Disclosure: I am a marketing expert

$PEPE.. dodged a bullet last nite due to rejection below my ...TRIGGER.
So, I dodged a bullet on CRYPTOCAP:PEPE last night thanks to patience and decent use of a simple technical level.
Price rejected just inside an expected resistance zone and didn't trigger my longs from $0.00001735 so that feels like a win💙👽.
So, for now we don't wanna lose $0.00001050 for longer than an hour or expect troubles.
Lower low on the 1-HOUR chart so that's no good, so watching this chart is a great idea but way too early for me to long, not against the bearish trend here, no way🤯
Need CRYPTOCAP:BTC.D to start dying soon for anything positive

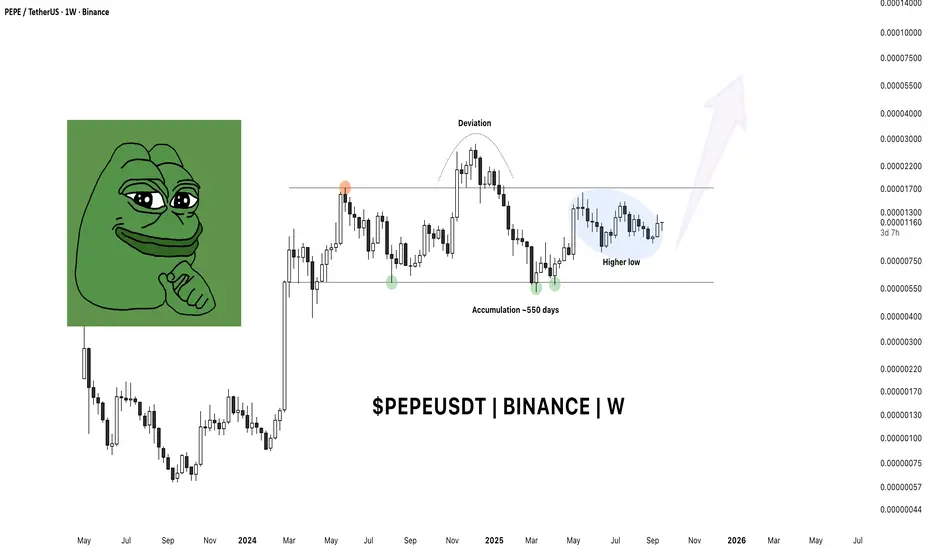
Pepe Setting Up for the Next Leg?Pepe has been quietly coiling for over 500 days — a period of balance that has shaken out weak hands and built a solid base. The market structure is now leaning bullish, and there’s a decent chance that BINANCE:PEPEUSDT is on the verge of an exponential move.
Let’s break it down!
🔎 Highlights
⦿ Range Structure:
Price has been locked inside a long-term range with clearly defined highs and lows. Sellers have repeatedly failed to push it below range support — a sign of underlying strength .
⦿ Post-Impulse Behavior:
The May rally created a wide candle range. Since then, price has slowly bled lower but never broke the May low. Instead, it has been oscillating within that candle’s range (consolidation after an impulse).
⦿ Volume & Value:
Currently trading above inception AVWAP and POC , both strong support references.
Price is pressing near the Value Area High (VAH).
Importantly, the zone between VAH and Range High shows thin volume development . If buyers push through VAH, there’s very little resistance until and above the Range High — meaning price could accelerate quickly.
⦿ Macro Context:
With alt season heating up, speculative capital tends to chase high-beta altcoins . Pepe has both the liquidity and narrative to be a frontrunner.
🟢 Bullish Scenario
Acceptance above VAH → swift test of Range High → successful flip into support → potential for new range formation at higher levels.
This would confirm a breakout and likely trigger momentum traders to pile in.
🔴 Bearish Scenario
Failure to reclaim VAH and a rejection at current levels could drag price back into the middle of the range. A breakdown below Range Low would invalidate the bullish thesis, but so far, buyers have defended that zone consistently.
📈 Outlook
The structure suggests imminent expansion. Given the thin value zone overhead and market-wide tailwinds, Pepe could be one of the top gainers in the coming alt cycle.
👉 Will BINANCE:PEPEUSDT accept above VAH and rip through the range high, or does it need another deeper pullback before the breakout?
——————x——————x——————x——————x——————x——————x——————
⚠️ Disclaimer: Crypto products, NFTs, Memecoins are unregulated and can be highly risky. There may be NO regulatory recourse for any losses arising from such transactions.
This content is for educational and informational purposes only and does NOT constitute financial, investment, tax, or legal advice. Cryptocurrencies are highly volatile and speculative — you may lose part or ALL of your investment. I am NOT liable for your losses.
Please do NOT copy my trades. Always consult YOUR financial advisor before making any investment or trading decisions. Or at the very least, consult your cat. 🐱
PEPEUSDT AND LONGPOSITIONAnd Pepe is a lovely and popular cryptocurrency and a great buy trading opportunity for the next three to six months with a great risk to reward.
Follow me and boost my analysis for timely and very low risk purchases and great signals.
Contact me in the comments section or private message
PEPEUSDT ( BINANCE:PEPEUSDT ) We have a bullish trend because broke latest trendline and pollback to breakeven.
Please control risk management for buy.
Targets: 0.00001200 - 0.00001280 - 0.00001370 - 0.00001550

USDJPY about to watch Clear trend join and follow up m, let keep an eye on this pair it will be incredible
