Pepe looks ready to blast off [long]Pepe is equip to blast off into the metasphere. Just look at the squeeze moment indicator on the two week. Would you look at that. Just look at it. Look at it. Just look at it. Would you look at that.
Even on the weekly time frame PepeUSDT looks ready for a large green D.
I like to use that pmar to get a feel for what it's really going to do. It looks like it has A LOT of room to move
The daily time frame doesn't look so hot. The squeeze is in the green already. However Every other time frame less than one day so 14 hours 12 hours 10 hours etcetera etcetera they're all pointing to the fact that we're going into the green.
GOOD NEWS! Have you found a paid indicator that works wonderfully? Let me know and I will recreate it for you by it and I'll invite you to have access to. I won't give it out freely To everyone. It will just be myself and you that has it. so send me with the indicator and I'll code it up for you! Send me a DM with to the paid version like their website which tells about it and I will recreate it for you.
MORE GOOD NEWS!
I'm going to be calling hot solana meme coins very soon so MAKE SURE TO FOLLOW ME! The fact is there's a secret... I won't be just blatantly writing a message like this with an analysis I will only be changing my profile picture to the coin's name. so you'll have to visit my profile often. I will leave the date in my bio and I will write "updated 08/18/25 6:16PM" As an example so you know exactly when the signal was called. so make sure to follow me!
Make sure to like this post. That way it will help me to gain more followers and it will help all of us. do your part to help me and I will help you immensely.
Sincerely,
rocket
PEPEUST trade ideas


#PEPEUSDT - Aug 2025Date: 17-08-2025
#PEPEUSDT - Current Price: 0.0000112
Pivot Point: 0.00001161
Support: 0.00001047
Resistance: 0.00001275
Upside Targets:
--------------------------------
| Target | Price |
---------------------------------
| 🎯 Target 1 | 0.00001435 |
| 🎯 Target 2 | 0.00001595 |
| 🎯 Target 3 | 0.00001757 |
| 🎯 Target 4 | 0.00001920 |
Downside Targets:
| 🎯 Target 1 | 0.00000887 |
| 🎯 Target 2 | 0.00000727 |
| 🎯 Target 3 | 0.00000564 |
| 🎯 Target 4 | 0.00000401 |
#TradingView #Nifty #BankNifty #DJI #NDQ #SENSEX #DAX #USOIL #GOLD #SILVER
#SOLANA #ETHEREUM #BTCUSD #MATICUSDT #XRPUSDT #SHIBUSDT
#Crypto #Bitcoin #BTC #CryptoTA #TradingView #PivotPoints #SupportResistance

PEPE Breakout Alert!CRYPTOCAP:PEPE Breakout Alert! 🚨
CRYPTOCAP:PEPE is currently testing the red resistance zone, which also aligns with the VPOC of the sellers 🔴
If buyers break through, it will be a strong bullish signal ✅
🎯 The first target will be the green line level, which aligns with the VAH (Value Area High).
This breakout would confirm that buyers are gaining control and could fuel a continuation upward.

PEPE 8H – Trendline Holding, Can Bulls Drive Toward 15?EPE is holding the rising 8H trendline support near 0.000011, keeping its higher-low structure intact. With Stoch RSI turning up from oversold, momentum is building for another leg higher.
Bull case: A successful bounce here could propel price back toward the 0.00001450–0.00001550 resistance zone, where rejection has capped moves in recent months.
Bear case: A breakdown below the trendline would invalidate the structure and open risk toward 0.000009–0.000010.
This is a key pivot area — holding support favors another attempt at range highs, while losing it flips bias back to defensive.

Trading plan for PepeThis week, Pepe only reached the R1 level before starting a correction.
At the moment, the picture is as follows: if the price returns above the weekly pivot point and consolidates above the moving averages, it could continue rising and update the local highs.
If the price breaks below 0.00001083 , the chances of further decline increase.

Pepe IdeaSeems to be coiling and consolidating.
Patience with good risk management will provide decent returns.
Probably could take a couple swings with proper risk management. 🤔

PEPE/USDT | Poised for a Strong Rally🚀 Trade Setup Details:
🕯 #PEPE/USDT 🔼 Buy | Long 🔼
⌛️ TimeFrame: 1D
--------------------
🛡 Risk Management:
🛡 If Your Account Balance: $1000
🛡 If Your Loss-Limit: 1%
🛡 Then Your Signal Margin: $54.59
-------------------
☄️ En1: 1106 (Amount: $5.46)
☄️ En2: 1034 (Amount: $19.11)
☄️ En3: 985 (Amount: $24.57)
☄️ En4: 939 (Amount: $5.46)
--------------------
☄️ If All Entries Are Activated, Then:
☄️ Average.En: 1010 ($54.59)
--------------------
☑️ TP1: 1304 (+29.11%) (RR:1.59)
☑️ TP2: 1475 (+46.04%) (RR:2.51)
☑️ TP3: 1725 (+70.79%) (RR:3.86)
☑️ TP4: 2104 (+108.32%) (RR:5.91)
☑️ TP5: 2621 (+159.5%) (RR:8.71)
☑️ TP6: Open 🔝
--------------------
❌ SL: 825 (-18.32%) (-$10)
--------------------
💯 Maximum.Lev: 3X
⌛️ Trading Type: Swing Trading
‼️ Signal Risk: 🙂 Low-Risk! 🙂
🔎 Technical Analysis Breakdown:
This technical analysis is based on Price Action, Elliott waves, SMC (Smart Money Concepts), and ICT (Inner Circle Trader) concepts. All entry points, Target Points, and Stop Losses are calculated using professional mathematical formulas. As a result, you can have an optimal trade setup based on great risk management.
⚠️ Disclaimer:
Trading involves significant risk, and past performance does not guarantee future results. This analysis is for informational purposes only and should not be considered financial advice. Always conduct your research and trade responsibly.
💡 Stay Updated:
Like this technical analysis? Follow me for more in-depth insights, technical setups, and market updates. Let's trade smarter together!

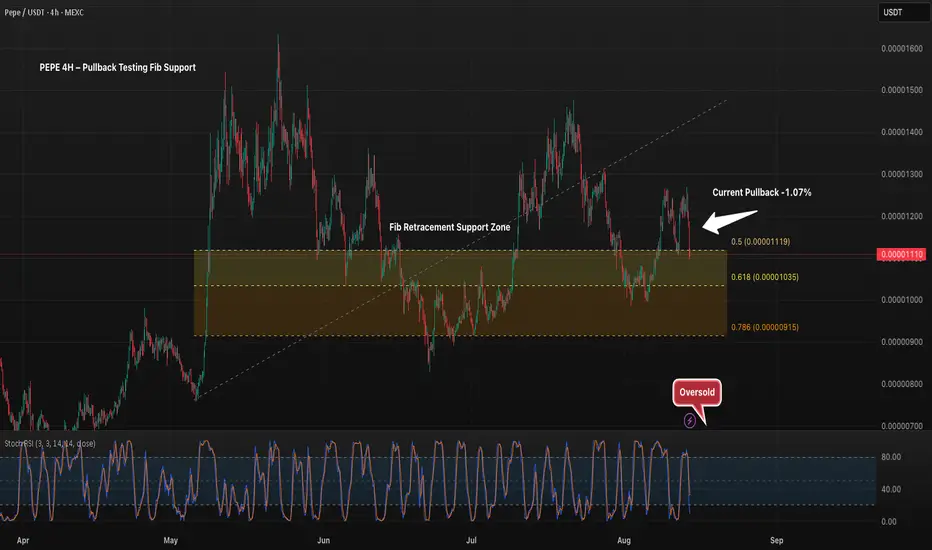
PEPE 4H – Pullback Testing Fib SupportPEPE’s 4H chart shows price pulling back into the 0.5 Fibonacci retracement level near 0.00001119, with the next supports at 0.618 (0.00001035) and 0.786 (0.00000915). Stoch RSI is in oversold territory, signaling potential for a short-term bounce. A sustained hold above the 0.5 level could keep bullish momentum intact, while a breakdown increases risk of deeper retracement.
Is PEPE Completely Dead?Old memecoins haven’t shown any real signs of life over the past six months. And while DOGE is at least making some effort, PEPE seems to have almost no chance for growth. Or does it? Let’s break it down:
➡️ The price is currently in a flag pattern and recently broke through resistance, now trying to hold above it. The funny thing is, during this market rally, other tokens had already broken out of their flags/channels long ago and are climbing higher, while PEPE is only now managing to do so.
➡️ And this impulse happened when ETH reached its ATH — with PEPE being considered ETH’s main memecoin. Yet PEPE printed a lower high and is now moving down.
➡️ Volume — there’s a divergence in buying volume, showing declining buyer interest. PEPE’s trading volume is basically at cycle lows while the rest of the market is setting new ATHs.
➡️ Money Flow — there’s a small liquidity inflow, but the indicator is sitting in a neutral zone. And that’s during a period of market-wide euphoria.
➡️ Support / Resistance zones — there’s a large support area right below current prices, so there are still people willing to buy PEPE. But given its sluggish price action, clearly not at these levels.
📌 Conclusion:
Right now, PEPE looks totally dead. But as often happens, near the end of the cycle, old tokens that have spent months at the bottom tend to wake up — mostly because everyone had been busy trading the shiny new stuff.
I still think PEPE has the potential to explode, but for that to happen, the price needs to drop significantly lower first.

PEPEUSDT Bearish Breakdown Setup From Local SupportAI Trade Setup Analysis
Timeframe: 2H (Two Hour)
Position Type: Short (Sell)
Entry Point: 0.000011763
Positioned exactly between the stop loss and take profit zones, marking the breakdown entry after price failed to hold its local support.
Stop Loss (SL): 0.000012600
Placed above the recent swing high and breakdown point to protect against a false breakout. Risk is approximately +7.12% from entry.
Take Profit (TP): 0.000010200
Target set at a key lower support level, offering a potential downside of around -13.29% from entry.
Risk/Reward Ratio: 1.87
A moderate setup offering nearly double the reward compared to the risk.
Technical Outlook:
PEPEUSDT has broken below a short-term support zone with notable selling momentum, increasing the likelihood of continuation toward the 0.000010200 target if sellers maintain control.
Bearish Scenario: Continued weakness below 0.000011763 could accelerate the move toward the target.
Bullish Invalidation: A recovery and close above 0.000012600 would negate the bearish outlook and could trigger a reversal.
Summary:
This trade setup is designed to capitalize on a fresh breakdown from support, with a defined stop above resistance and a target at the next key support, maintaining a clear risk management framework.

PEPE 4H – Approaching Downtrend Resistance, Support Remains KeyPEPE is trading just below its descending trendline resistance, which has capped rallies since late 2024. The $0.0000055–$0.0000065 zone remains a major long-term support level. Momentum is neutral on the Stoch RSI, leaving room for either a breakout attempt or continued consolidation. A breakout above trendline resistance could target $0.000015+, while rejection risks another retest of the major support zone.

PEPE Head and Shoulders Pattern Signals Potential Reversal with PEPE - a globally formed Head and Shoulders pattern, we are at the very bottom of the right shoulder, after the pattern is worked out, a trend reversal into an upward movement is expected
The price formed an ascending channel at the foot of the right shoulder, as a result of which there was an exit from the Head and Shoulders pattern
There was a breakout of the ascending channel, after which there was a powerful rebound and the price was held in the ascending channel
At the moment, we are at the bottom of the ascending channel and in the asset accumulation zone
Current price: $0.00001160
According to the constructed patterns, with a high degree of probability, an upward movement is expected to the nearest price zone of $0.00001195 , if the price holds, then the movement can continue to the upper border of the ascending channel, in the price area of $0.00001296
Attempts to break the price into the descending corridor to the marks are also possible $0.000011019
This analysis is based on the technical pattern and also incorporates AI to provide more accurate results
PEPE/USDT Technical Analysis – August 10, 2025📊 PEPE/USDT Technical Analysis – August 10, 2025
On the weekly timeframe, PEPE has successfully bounced from its long-term ascending trendline, showing a notable bullish reaction. Currently, the price is approaching the key resistance at 0.00001213.
🔹 Bullish Scenario:
If this resistance is broken and confirmed with a valid candlestick close on lower timeframes, the next target will be the descending trendline and resistance at 0.00001404. A breakout above this level could open the way toward 0.00001601 and then 0.00001774.
🔹 Bearish Scenario:
If the price falls below the ascending trendline, the first major support will be around 0.00000906, which could play a crucial role in determining the next move.
📌 Conclusion:
Traders should closely watch the reaction at the 0.00001213 resistance and the ascending trendline, as a breakout in either direction could set the next trend for PEPE.


Pepe Update · 5th Dimensional Technical Analysis & Rising PricesThe energy changes. Do we really have to look at a chart?
The market sentiment is so different when the market is trending compared to when the market is sideways. The energy is very different when the market is dropping compared to when it is rising. We can tell what is coming based on how the market feels, but it is a bit paradoxical.
Good feelings, greed and a high level of certainty doesn't necessary means that the market will move in your direction. These are your feelings but not necessarily the market sentiment, how the market is feeling.
The first step then is to learn to distinguish between the market sentiment, how the market and its participants are doing and our own feelings, intuitions, perceptions, ideas, impulses and emotions.
Well, maybe that is too hard. Since it is very hard to learn to be aligned with the market and interpret the correct meaning of the different feelings we get in relation to prices, we can just use a chart.
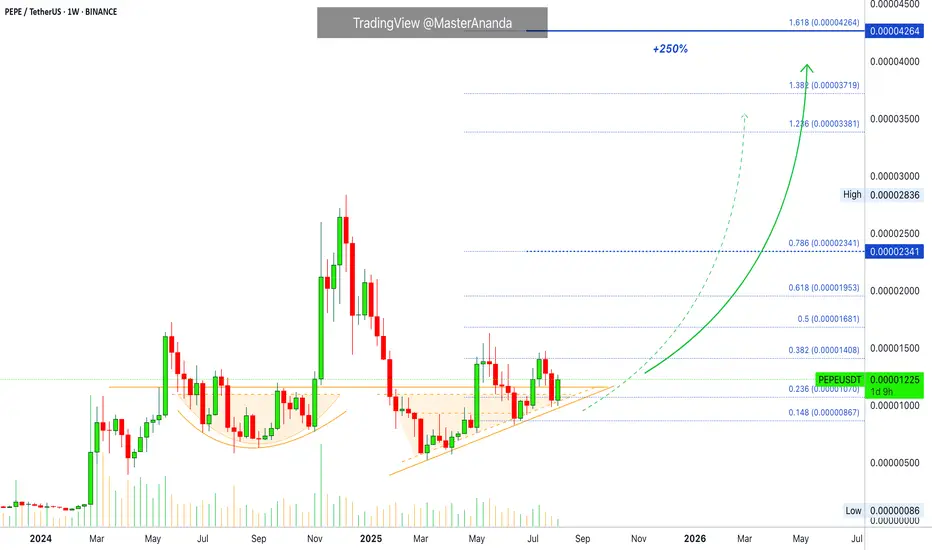
Pepe produced a rounded bottom followed by a bullish jump. Pepe now again produced a new bottom pattern but this time a rising triangle and has been moving up for months, five months to be exact.
Five months rising but there is no rise. This is a very strong accumulation phase. Accumulation leads to a massive bullish jump. How are you feeling? Are you feeling low or are you feeling great?
The calm before the storm. The market tends to become depressed before a major bullish run. If not in prices, people become depressed in feelings, that is because all of their bearish friends are gone. We suffer because they are getting liquidated but there is light at the end of the tunnel, our profits are going up.
Stay bullish. Choose wisely. Keep reading. Bet LONG.
There is no point in being bearish when the market is going up.
Only now we are preparing for a massive bullish run.
Join the wave and you will profit, have fun and grow. It is very simple, we all buy and hold.
Namaste.
PEPE Breakout Watch – Red Resistance Being Tested! 🚨 CRYPTOCAP:PEPE Breakout Watch – Red Resistance Being Tested! 🔴⏳
CRYPTOCAP:PEPE is testing the red resistance zone.
📊 If breakout confirms, next move could target:
🎯 First Target → Green line level
A breakout could trigger bullish continuation and upside momentum.

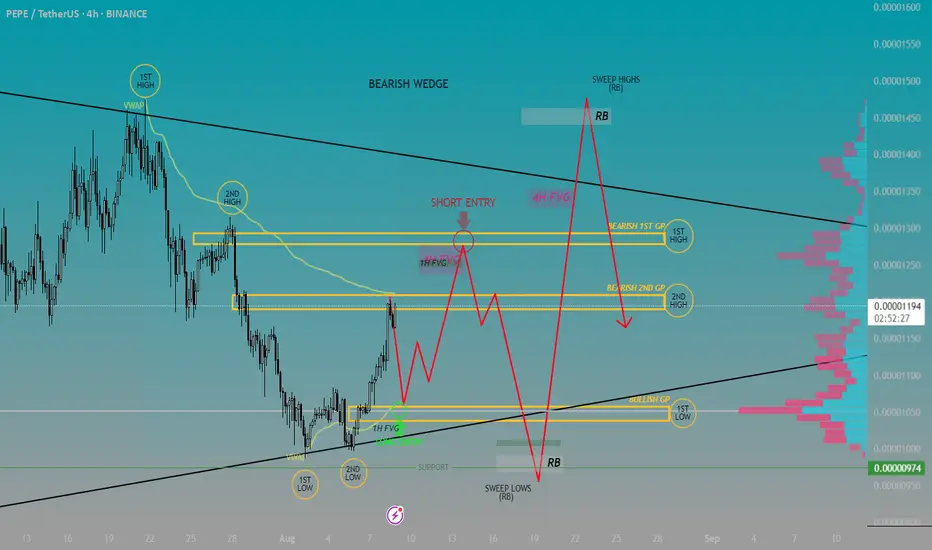
Head And Shoulders Continuing to fall?Context 1:
Supply Zone: 00000400 - 00000970
Support: 00000975 - 00001075
Demand Zone: 0001798 - 00002850
Resistance: 00001550 -00001420
Psychological Levels: 00001500, 00001000
Context 2:
Technical Structure 1: Top Down Analysis shows us a Head and Shoulders pattern of which we are in the final stages of with bearish momentum.
Technical Structure 2: The overall trend has left us in a bearish wedge which has tested support 4 times and tested resistance 2 times.
FVG’s:
FVG Confluence 1: Theres a 1 hour FVG located just below price level. Also aligned with the POC. Strong confluence for return to this area.
FVG Confluence 2: Another 1 hour FVG inside of a 4 hour FVG that is also aligning with the bottom 0.618 Fib level of that move.
Golden Pocket Entry 1st Low (Bullish): Sits just above an FVG. Also engulfs the Point of Control.
Golden Pocket Entry 1st High (Bearish): Multiple TimeFrame FVG confluence. A key resistance point aligning with .00001300 Pschological Level.
Context 3:
Volume Insight: The most volume is located around .00001250 and .00001050 which show massive spikes in these key areas.
Bullish Scenario:
Price falls to the golden pocket- FVG- POC. Bounces off support to create a higher low.
Bearish Scenario:
Price rises to clear a 1H and 4H FVG- enters the golden pocket - sweeps liquidity around the .00001290 area.
Pepe Coin Battles Last Defenses For 17% Move To $0.000013Hello✌️
Let’s analyze Pepe Coin’s price action both technically and fundamentally 📈.
🔍Fundamental analysis:
Big holders own 43% of PEPE, which can make prices jump or drop fast. If price stays above $0.000010 it could hold steady, but selling near $0.000014 might slow gains.
📊Technical analysis:
BINANCE:PEPEUSDT has lost all major Fibonacci supports, with daily support and trendline as its final safeguards 📉. If these hold and volume remains steady, a 17% rally toward $0.000013 is expected 🚀.
✨We put love into every post!
Your support inspires us 💛 Drop a comment we’d love to hear from you! Thanks, Mad Whale

Major trendline resistance is broken also retest completed One of the major resistances which was red trendline is now broken also retest is completed and market is ready to explode and pump to the upside if BINANCE:BTCUSDT hold strong.
major supports and resistances are also all mentioned on the chart.
First target is easy to hit now but for second one we need valid breakout to the upside near that(0.000017$) resistance zone for sure.
DISCLAIMER: ((trade based on your own decision))
<<press like👍 if you enjoy💚

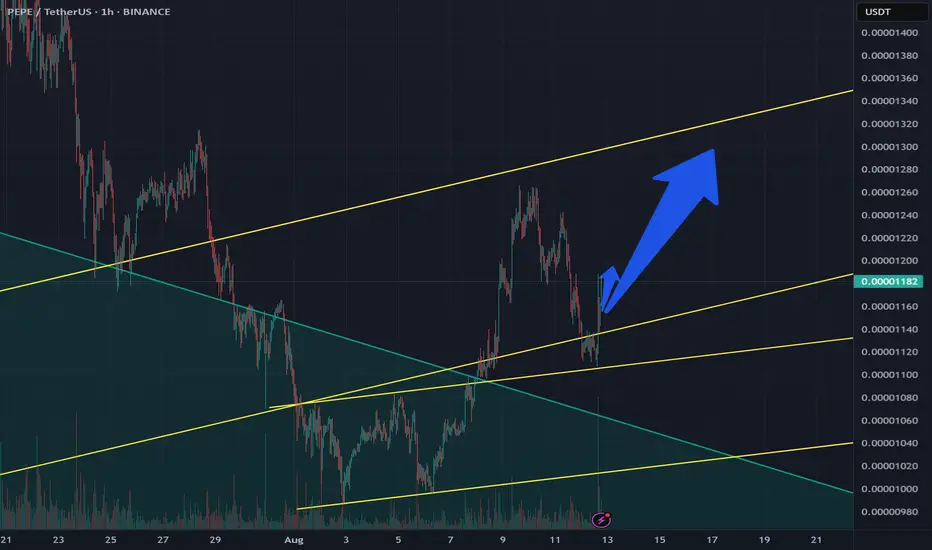
Buy SignalTrend in trends of a major W and a minor w after a descending channel.
Tp has been indicated

Pepeusdt trading opportunityPEPEUSDT remains in an uptrend, recently breaking above a bullish pennant structure, suggesting a strong potential to reach the current setup target. The plan now is to seek buy opportunities on a retest of the previous all-time high (ATH) level. An immediate demand zone is also marked in case of a deeper pullback, while the final target is provided to support informed decision-making.

Potential SellPepe has an M formation that is clear as day. Price has dropped to a level 0.00000986, pushed upwards to 0.00001055 and has started to form a wick on the resistance which is an indication that price might push downwards to complete the M formation.
If price pushes upwards past the resistance then the sell setup would be invalidated.
