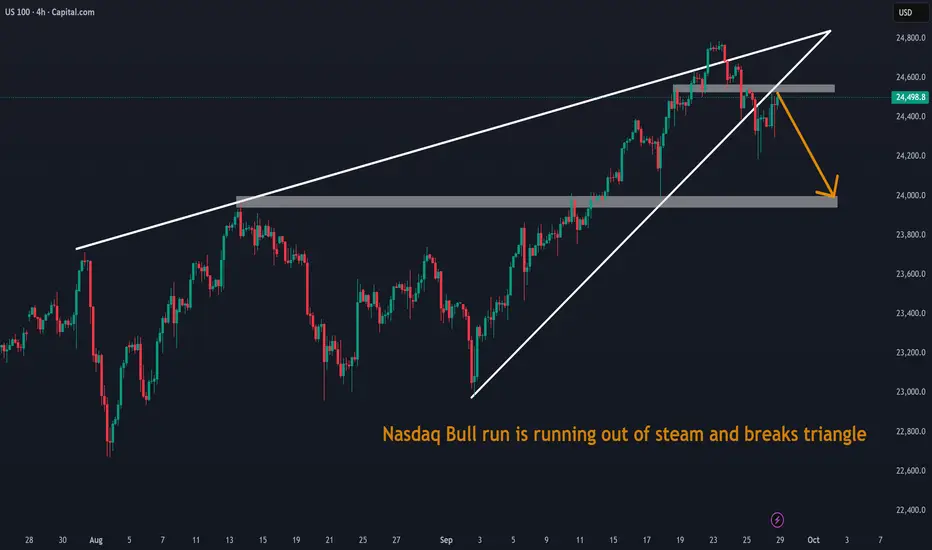
Nasdaq Bull run is running out of steam and breaks triangleNasdaq Bull run is running out of steam and breaks triangle.
NAS100 trade ideas
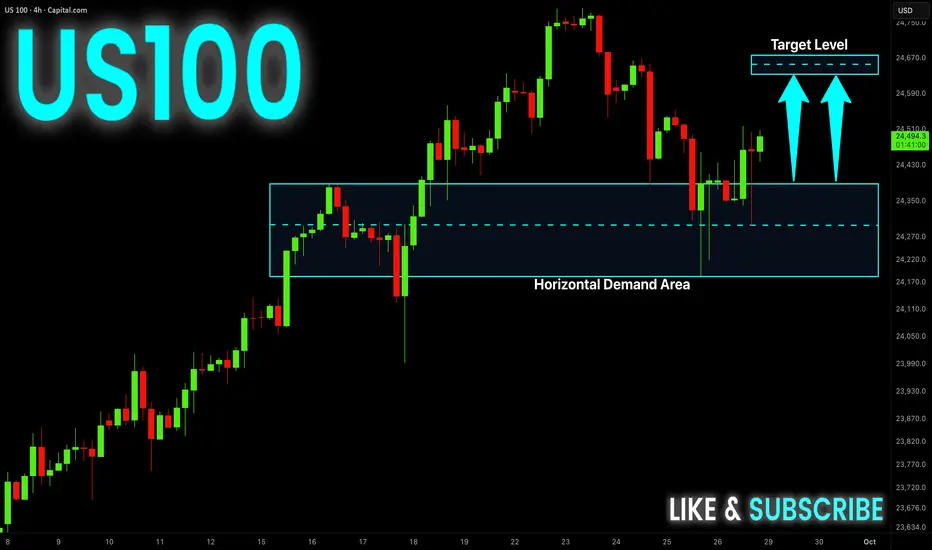
US100 Will Keep Growing! Buy!
Hello,Traders!
US100 Price reacts from the horizontal demand area, shifting order flow bullish. SMC structure favors upside with liquidity targets set at 24,670 zone. Time Frame 4H.
Buy!
Comment and subscribe to help us grow!
Check out other forecasts below too!
Disclosure: I am part of Trade Nation's Influencer program and receive a monthly fee for using their TradingView charts in my analysis.
Shall Nasdaq keep going with correction phase?US100 index being in correction phase, shall it continue? Share your idea trader!
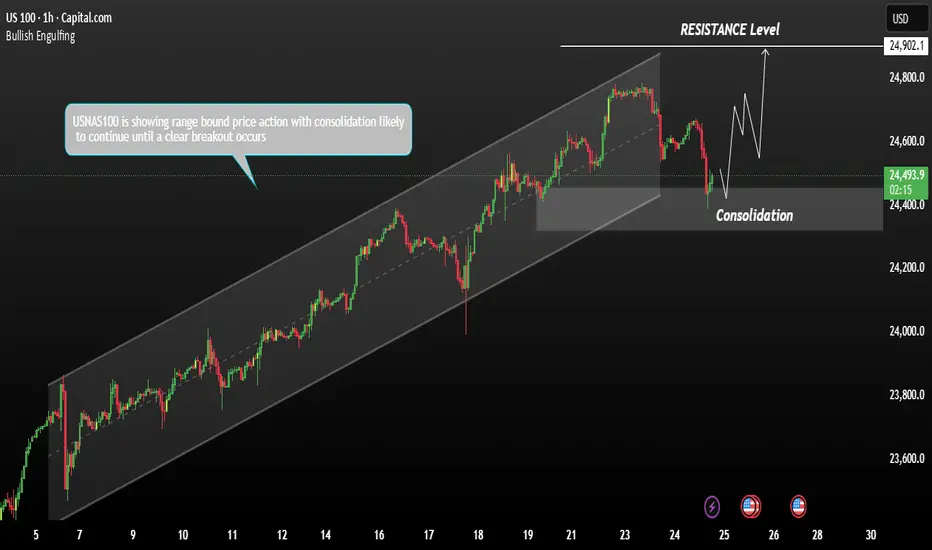
USNAS100 Range Bound Price action price likely to continueThe US NASDAQ 100 (USNAS100) is currently exhibiting range-bound price action, with consolidation likely to continue until a clear breakout occurs.
Technical View:
On Wednesday, the index edged slightly higher as investors weighed the measured comments from Federal Reserve Chair Jerome Powell and looked ahead to key U.S. economic data due later this week.
A confirmed breakout above the current consolidation zone could open the path for further upside, with potential resistance seen near the 24,900 level.
You may find more details in the chart.
Trade wisely best of Luck.
Ps; Support with like and comments for better analysis Thanks for Supporting.
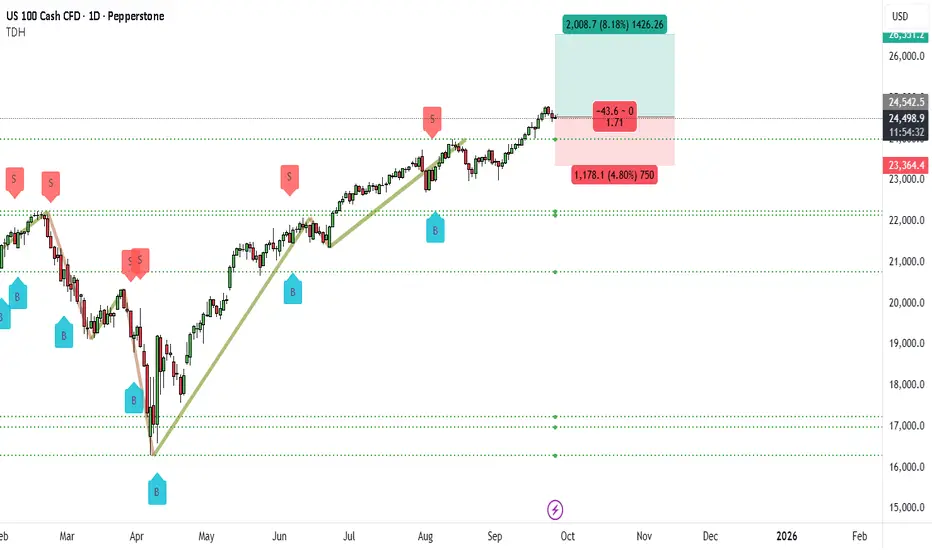
NAS100 Bullish Scenario, Will The Trend Be Followed?The US100 (NASDAQ) daily chart shows a very strong bullish structure. Since April, the index has been in a steady uptrend, creating higher highs and higher lows. Recently, price broke through the important 24,000 zone and is now consolidating just under 24,542. This consolidation at the highs is a healthy sign of strength, suggesting buyers are preparing for the next leg up.
The zone between 24,000 and 24,200 is now a major support base. As long as the market holds above this region, the bullish outlook remains intact. The next major target sits near 26,551, which lines up with an 8% projected upside move. Momentum remains with the bulls, and dips toward support are likely to be bought up quickly.
📌 Trade Setup (Bullish)
• Entry: 24,500 (current market or on breakout above 24,542)
• Stop-Loss: 23,364
• Take-Profit: 26,551
• Risk/Reward: ~1:1.7
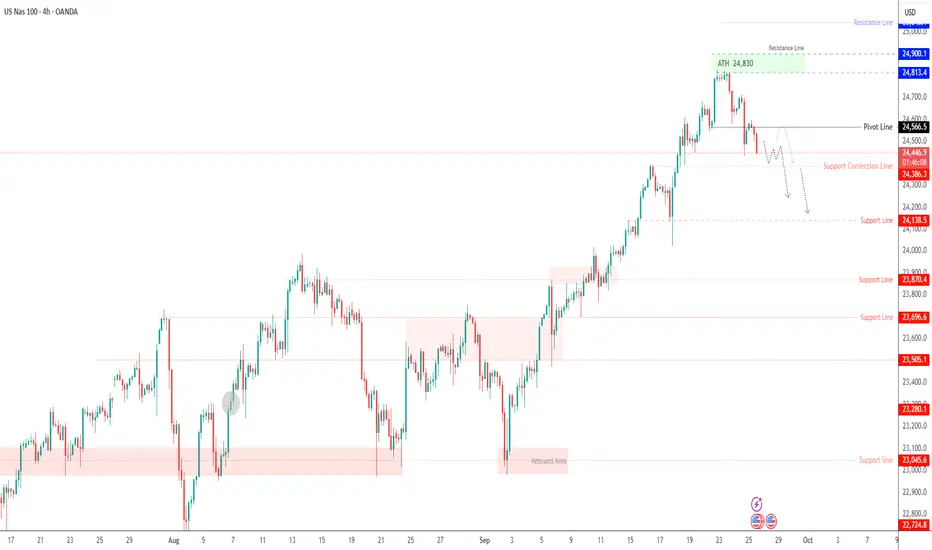
USNAS100 – Nasdaq Awaits GDP Data as Bears Hold ControlUSNAS100 – Overview
The Nasdaq 100 holds a bearish bias ahead of today’s key U.S. GDP release, with price action leaning lower as traders brace for potential volatility.
A stronger-than-expected GDP print would likely reinforce downside momentum by reducing Fed rate-cut expectations, while weaker data could provide a bullish lift for tech indices.
Technical View
Bearish Scenario:
The index remains bearish while trading below the 24,560 pivot zone.
Immediate downside targets are 24,385 → 24,140 → 23,870.
🔻 A confirmed 1H close below 24,385 would strengthen momentum toward deeper supports.
Bullish Scenario:
A confirmed 1H close above 24,570 would invalidate the bearish setup and support a move toward 24,660 → 24,810.
Key Levels
Pivot: 24,500
Resistance: 24,570 – 24,660 – 24,810
Support: 24,380 – 24,140 – 23,870
The Nasdaq remains in a data-driven range, with GDP results likely to decide whether price breaks below 24,385 to extend losses or rebounds above 24,570 to retest higher resistance.
NAS100 Pullback and Liquidity Sweep in H4 Demand. Time to LongNQ has given a nice deep pullback into H4 demand. Time to pull the trigger.
Nasdaq ready for 200 points rally from Daily Trend line supportNasdaq ready for 200 points rally from Daily Trend line support, it was a good confirmation as trend support did wickout and holded, lets goo do you agree?

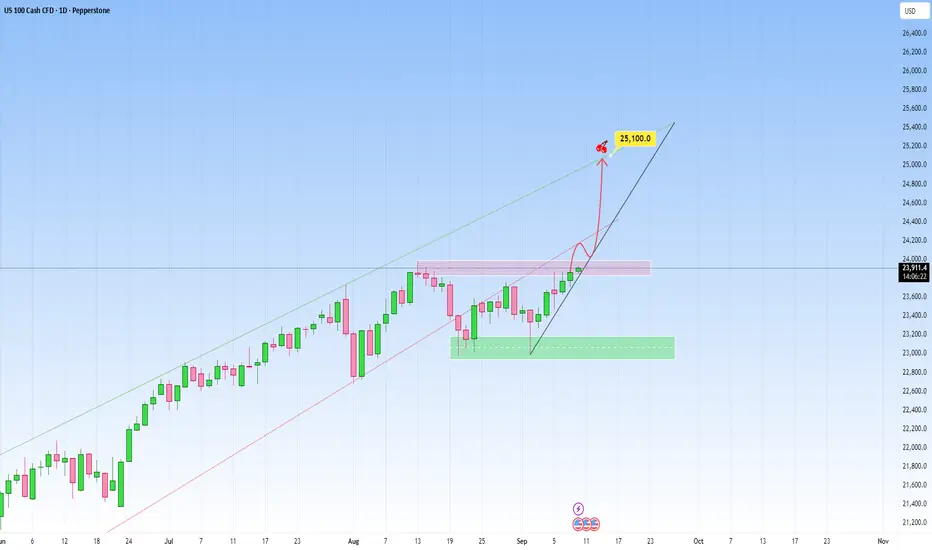
NAS100 Outlook: Recent rise has been steady!Market context on NAS100 remains bullish clearly. The most recent move saw a steady recovery, heading towards the upper boundary of the newly projected channel. And this right here is another great opportunity to get involved.
The market is likely in the early stages of a new impulsive leg to the upside right here.
We could also have short-term consolidation or pullback, then a continuation toward the upper boundary but I believe the latter is more plausible.
My target will be at 25,100.
NASDAQ Bearish Flag SetupPrice is currently in a supply zone. An estimated measured move target will take price to a demand zone.
Always wait for a break out and retest as confirmation before entering.

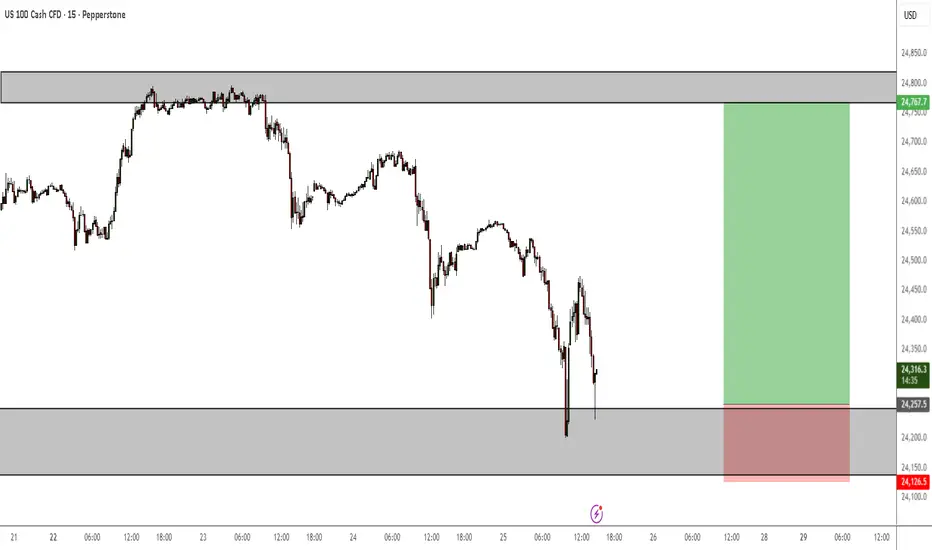
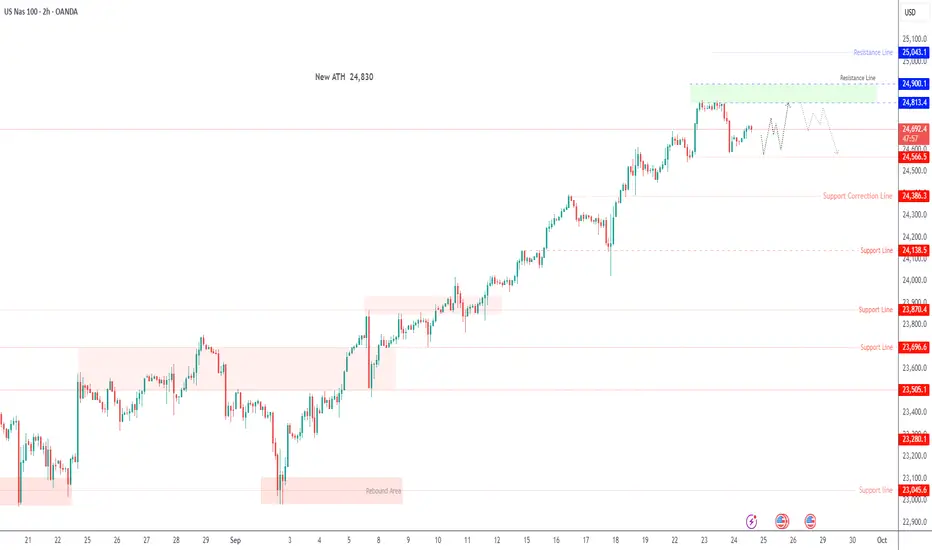
USNAS100 – Powell Caution Keeps Nasdaq in Tight RangeUSNAS100 – Overview
Futures tied to the S&P 500 and Nasdaq edged slightly higher on Wednesday as investors weighed measured comments from Fed Chair Jerome Powell and looked ahead to key U.S. economic data later this week.
Powell acknowledged that asset prices appear highly valued, while maintaining a cautious tone on the labor market. He avoided taking sides between Fed officials calling for deeper cuts to support jobs and those urging restraint to avoid inflation risks, emphasizing instead the delicate balancing act between growth and price stability.
📊 Technical View
The Nasdaq100 is showing range-bound price action, with consolidation likely to continue until a clear breakout occurs.
Bearish Scenario:
Price is expected to test the resistance zone around 24,810 before pulling back toward 24,560.
🔻 A confirmed 15-min close below 24,560 would expose deeper supports at 24,380 → 24,140.
Bullish Scenario:
A decisive break above 24,900 would invalidate the bearish setup and open the way toward 25,040.
An hourly close above 24,900 would confirm renewed bullish momentum.
Key Levels
Pivot: 24,660
Resistance: 24,810 – 24,900 – 25,050
Support: 24,560 – 24,380 – 24,150
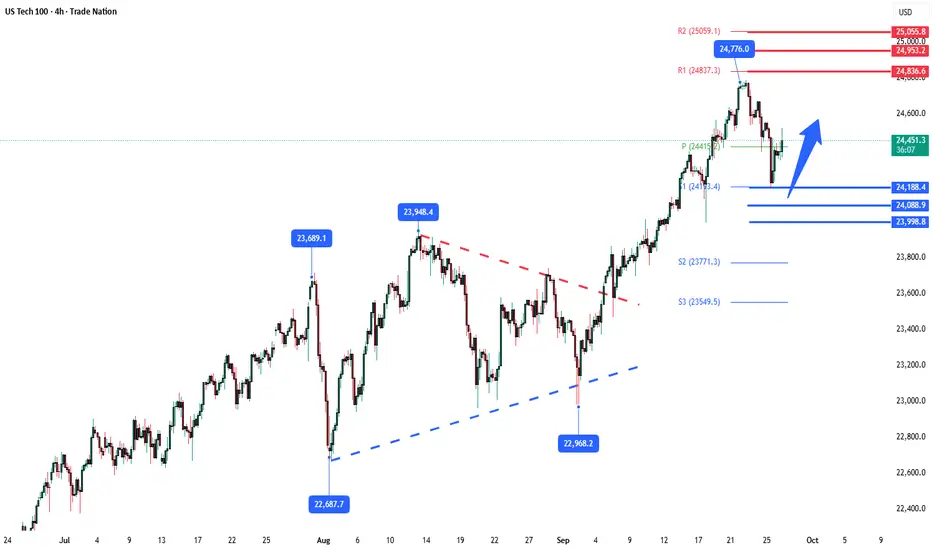
NSDQ100 Key Trading LevelsKey Support and Resistance Levels
Resistance Level 1: 24835
Resistance Level 2: 24950
Resistance Level 3: 25055
Support Level 1: 24190
Support Level 2: 24090
Support Level 3: 24000
This communication is for informational purposes only and should not be viewed as any form of recommendation as to a particular course of action or as investment advice. It is not intended as an offer or solicitation for the purchase or sale of any financial instrument or as an official confirmation of any transaction. Opinions, estimates and assumptions expressed herein are made as of the date of this communication and are subject to change without notice. This communication has been prepared based upon information, including market prices, data and other information, believed to be reliable; however, Trade Nation does not warrant its completeness or accuracy. All market prices and market data contained in or attached to this communication are indicative and subject to change without notice.
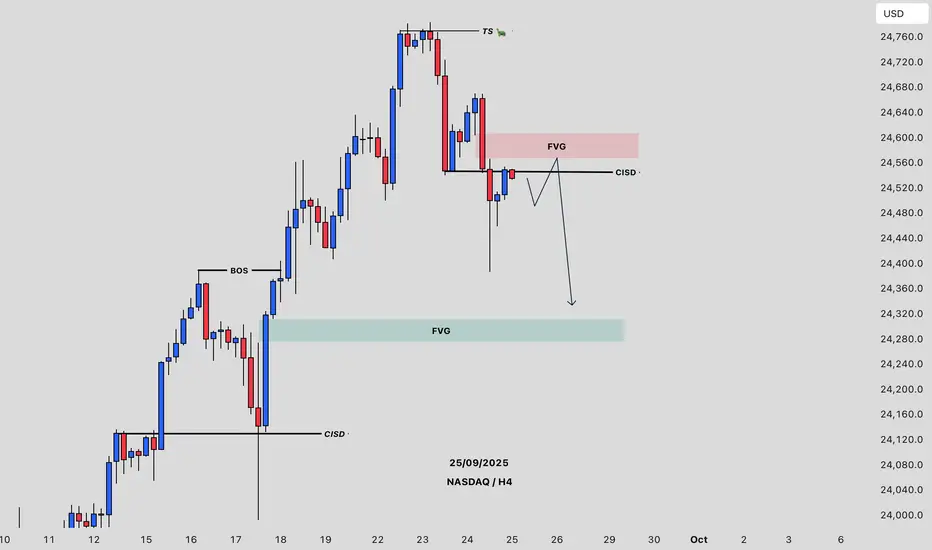
Nas100 Trade Set Up Sep 26 2025Price is overall still bearish so i am expecting a sell off from the 4h FVG or a sweep of PDH
www.tradingview.com

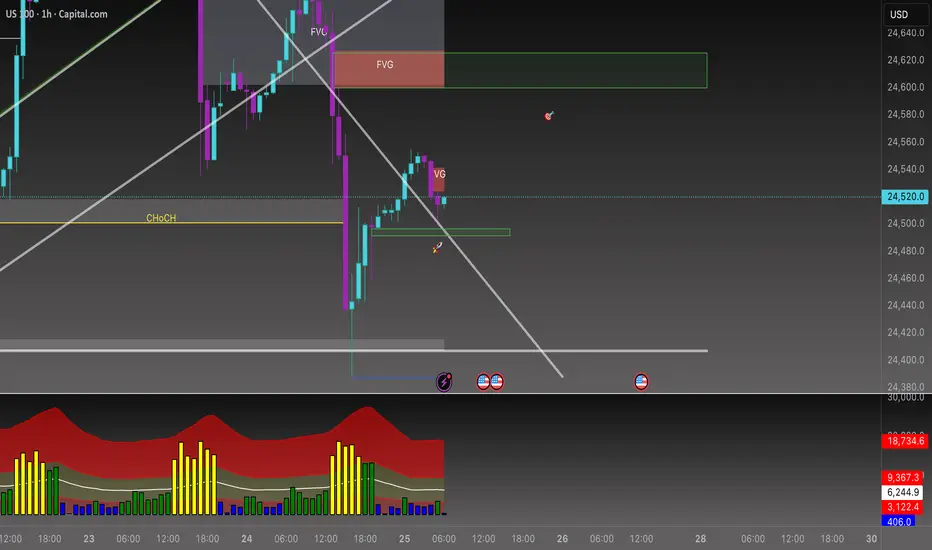
NAS100 Technical Breakdown | Bearish Play in MotionWe're currently observing a strong 1H bearish imbalance (FVG) rejection zone that aligns perfectly with the recent 15m resistance block, leading to a swift rejection in price.
Price action has respected the HTF liquidity zones and is now following through on the anticipated drop towards 1H Support 📉.
The confluence of the descending momentum, HTFL levels, and FVG fill strengthens the case for continued bearish movement in the short term.
📌 Key Levels to Watch:
Resistance Zone: 24,940 – 24,975
Mid Support: 24,793 – 24,780
Major Support: 24,712 – 24,699 (potential liquidity sweep zone)
⚠️ Watch for reaction at the trendline and lower HTFL levels – they may offer a potential bounce or continuation setup depending on the momentum.
🧠 Trade Smart: Wait for confirmation before entering. Don't chase – let price come to your levels.
💬 What’s your bias on NAS100 this week? Drop your thoughts below! 🔽
Greetings,
MrYounity

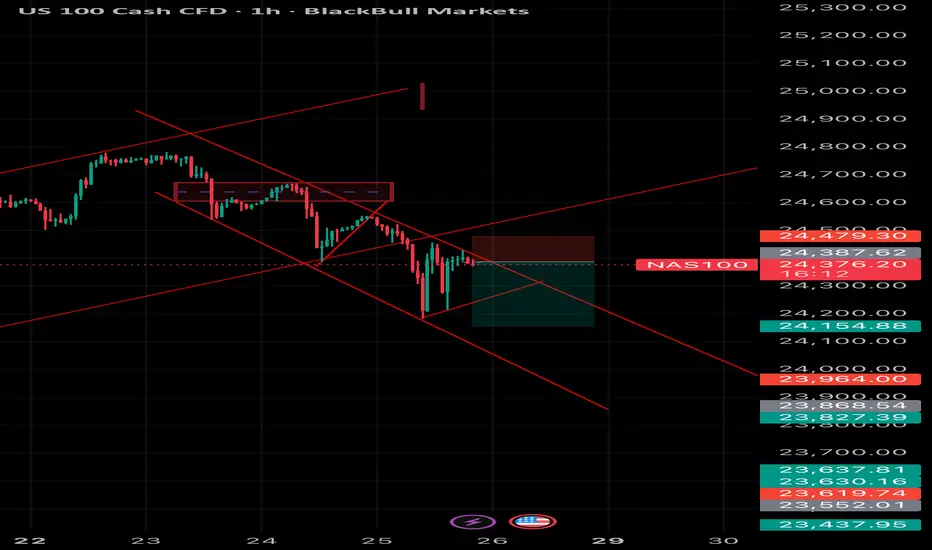
NAS100 Technical Analysis 1 Hour Chart📉 NAS100 Technical Analysis (1H Chart)
NAS100 is trading around 24,374 and continues to respect a strong descending channel, signaling bearish momentum.
• Trend: Price rejected the previous supply zone (24,470 – 24,500) and failed to break above resistance, confirming sellers are still in control.
• Entry Zone: The retest of broken support turned resistance around 24,387 – 24,479 shows bearish rejection with downside continuation likely.
• Target Levels:
• First target: 24,154 (mid-channel support)
• Next target zone: 23,960 – 23,827 (lower channel support)
• Invalidation: A clean 1H close above 24,500 would invalidate this bearish structure and could trigger a corrective move higher.
👉 Short-term bias remains bearish while under 24,500 with room for continuation toward 24,150 – 23,900.
US100 Swing trade Sell position
Bearish pattern formed at the top.
Take-profit (TP) is defined on the chart.
If you wish to hold further, move stop-loss (SL) to breakeven.


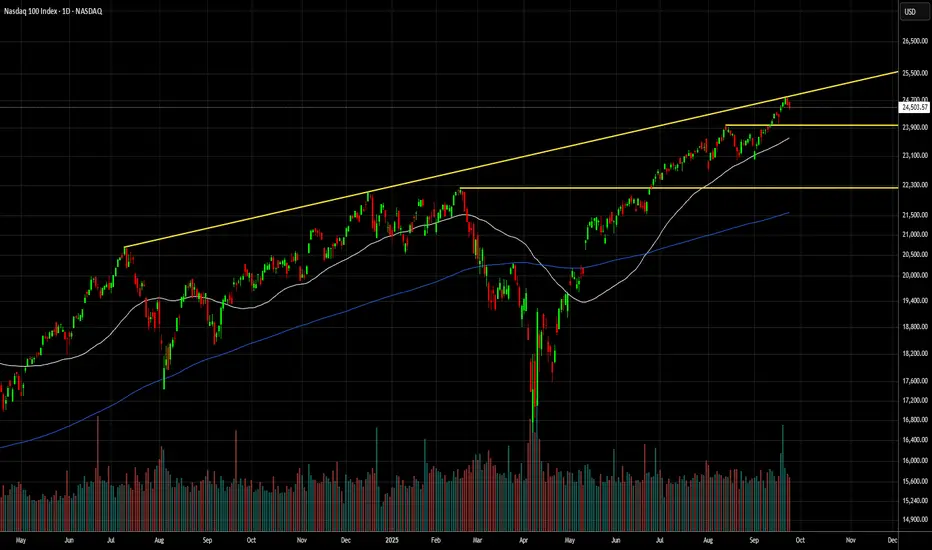
NASDAQ index- Correction alertThe price has reached the yellow trendline, and in the previous two instances this led to significant short-term corrections:
📉 July 2024: -15.6%
📉 December 2024: -7.1%
Currently: optimistic correction target at 23,970 (-3.2%), and if that doesn’t hold – strong support at 22,223 (-10.2%).
NasdaqNasdaq breaking 24500 pulled back to the 2-day average and returned below this level, we can see a sharper drop to the support region 24100 and 24200

NASDAQ100 HIGH PROBABILITY SETUP SOON!!!🚨 NAS100 HIGH PROBABILITY BUY SETUP 🚨
* Here We Can See Clearly The Next Potential Move For US100 Next Hours/Days.
* Keep Your Eyes Close On Your Trading Positions.
* Happy PIP Hunting Traders.
FXKILLA.

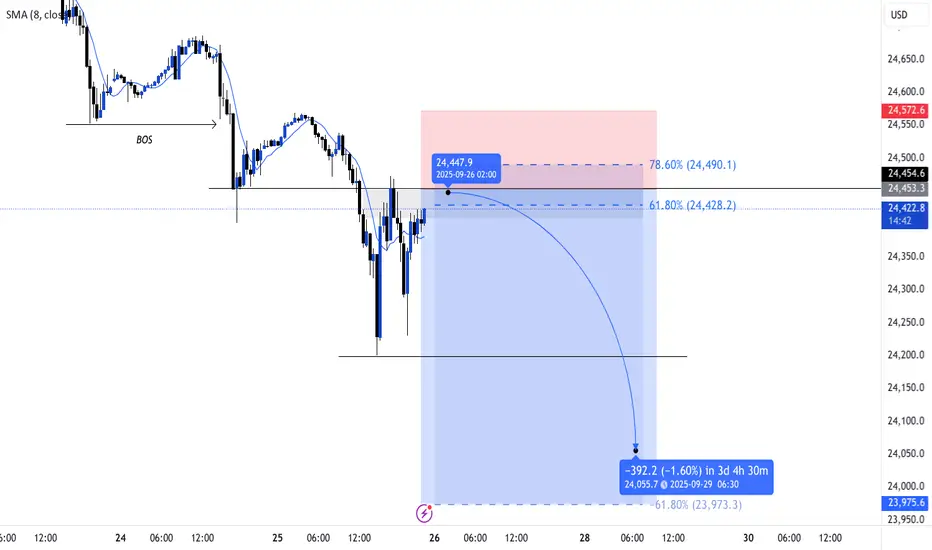
Beyond the Chart - NAS100 Through Technicals & FundamentalsNAS100 has just completed its move into the Discount PD Array zone I highlighted yesterday. On the 1H timeframe, I pointed out the prevailing bearish trend and marked this area as a key target. Once price tapped the zone, sellers lost momentum and buyers stepped in, shifting market control.
Now we’re seeing an inverse Z formation, with a Fair Value Gap (FVG) and a Breaker Block (BB) cutting across the structure. If buyers step in again, as they did in the earlier PD Array, my upside target will be 24,580.