NAS100 trade ideas

USTEC - 2 Day Traders Edge📈Technical:
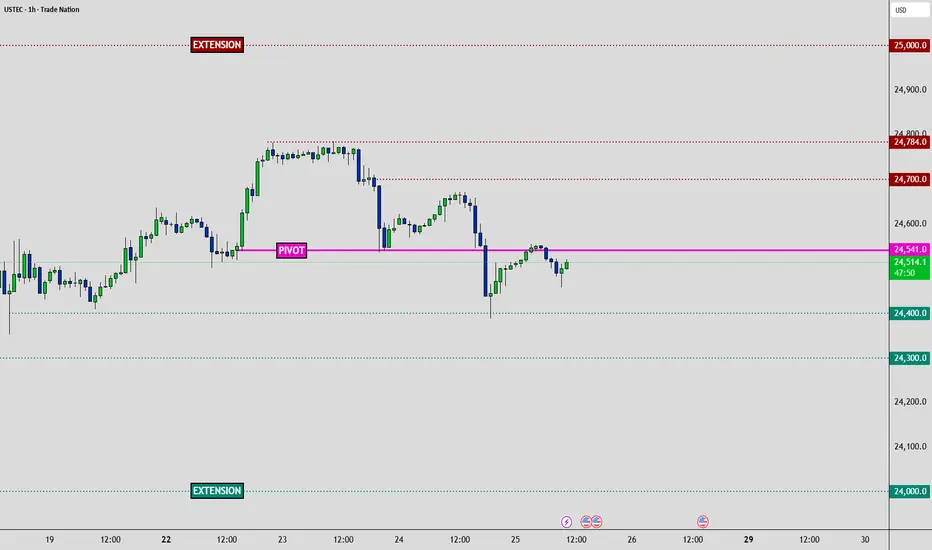
MARKET BIAS: Neutral (consolidating at HVN pivot, high-rate sensitivity)
PIVOT ZONE: 24,541 (Exact HVN level)
🥇 Traders Edge - Actionable & Tactical
TRADE SETUPS:
🟧 Risk Warning: Core PCE surprise = 200+ point moves
🟧 Special Risk: High beta to rate moves via PCE
↕️ Bias Flip: Break below 24,400 (bearish) | above 24,700 (bullish)
🟢Long Setup:
• Entry above Pivot | Stop 24,450 | TP: 24,650 | 24,750 | 24,850 - Extended Breakout
🔴Short Setup:
• Entry below 24,400| Stop Above Pivot | TP: 24,300 | 24,000 - Extended Breakdown
🎯KEY LEVELS:
• Strong Resistance: 24,700 | 24,784
• Strong Support: 24,400 | 24,300 | 24,100 | 24,000
🎯PRICE TARGETS:
• Bullish Path: 24,700 → 24,784 → 25,000 (Extended breakout)
• Bearish Path: 24,400 → 24,300 → 24,000 (Extended breakdown)
🚨HIGH-IMPACT EVENTS (48H): (NY Time Zone)
• Sep 25 | 08:30 GDP Q2 Final: 3.3% vs -0.5% → Growth supports tech multiples
• Sep 26 | 08:30 Core PCE MoM: 0.2% vs 0.3% → TECH RATE SENSITIVITY
• Sep 26 | 08:30 Personal Spending: 0.5% vs 0.5% → Tech demand proxy
• Sep 26 | 10:00 Michigan Sentiment: 55.4 → Growth stock appetite
🛑 MASTER RISK EVENT
🟧Friday September 26 | 08:30 (NY Time Zone)
🟧 Core PCE Price Index (MoM) - Forecast: 0.2% vs Previous: 0.3%
🟧 Critical Impact: Fed's preferred inflation gauge determines rate path and USD strength
• Gold: Collapse risk if hot print
• Equities: Rate repricing volatility
• Sectors: Tech rotation sensitivity
⚠️ RISK MANAGEMENT PROTOCOL
• Reduce position sizes before Friday 08:30 EDT
• USD strength reversals impact Gold heavily
• Tech high beta to rate repricing
• Month-end flows amplify volatility
________________________________________
Analysis based on Session Volume POC clusters and HVN methodology

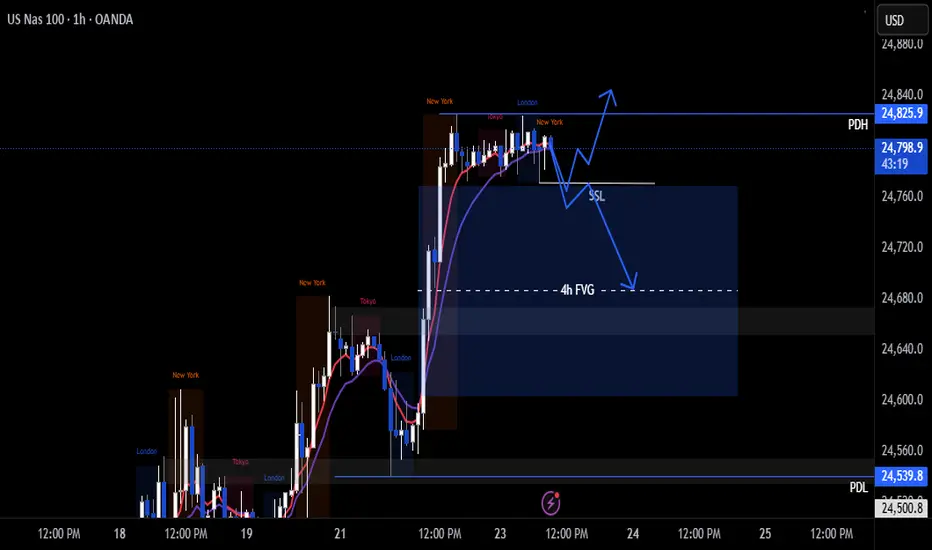
Nas100 Trade Set Up Sep 24 2025I will want to see price sweep SSL followed by a 1m IFVG/CISD to take higher to 4h FVG/Supply
www.tradingview.com

Nasdaq slipped as investors balanced Fed signalsThe Nasdaq 100 (-0.87%) fell as tech stocks weakened. Uncertainty around Nvidia’s $100bn OpenAI deal led the reversal after Monday’s gains.
Powell’s comments added to caution: he repeated that risks remain on both inflation and jobs, but also admitted to “meaningful weakness” in the labour market. This helped bonds rally, but not equities.
Extra pressure came from US government shutdown concerns, while gold hit a record high ($3,764/oz) as investors shifted to a defensive.
Tech momentum cooled, and the Nasdaq slipped as investors balanced Fed signals, policy risks, and stretched valuations.
Key Support and Resistance Levels
Resistance Level 1: 24830
Resistance Level 2: 24950
Resistance Level 3: 25055
Support Level 1: 24412
Support Level 2: 24300
Support Level 3: 24190
This communication is for informational purposes only and should not be viewed as any form of recommendation as to a particular course of action or as investment advice. It is not intended as an offer or solicitation for the purchase or sale of any financial instrument or as an official confirmation of any transaction. Opinions, estimates and assumptions expressed herein are made as of the date of this communication and are subject to change without notice. This communication has been prepared based upon information, including market prices, data and other information, believed to be reliable; however, Trade Nation does not warrant its completeness or accuracy. All market prices and market data contained in or attached to this communication are indicative and subject to change without notice.

US100 – Bearish Pressure Below 24,768 | Targeting 24,600US100 is showing downside momentum after rejecting the 24,768 zone.
Bears are pushing price lower, with immediate support seen at 24,700.
A clean break below this level could extend the move toward 24,600, which is my near-term target.
If buyers manage to defend 24,700, a short-term bounce is possible, but overall sentiment remains weak.
👉 Do you expect US100 to hit 24,600 this week, or will bulls defend the zone? Share your thoughts below.

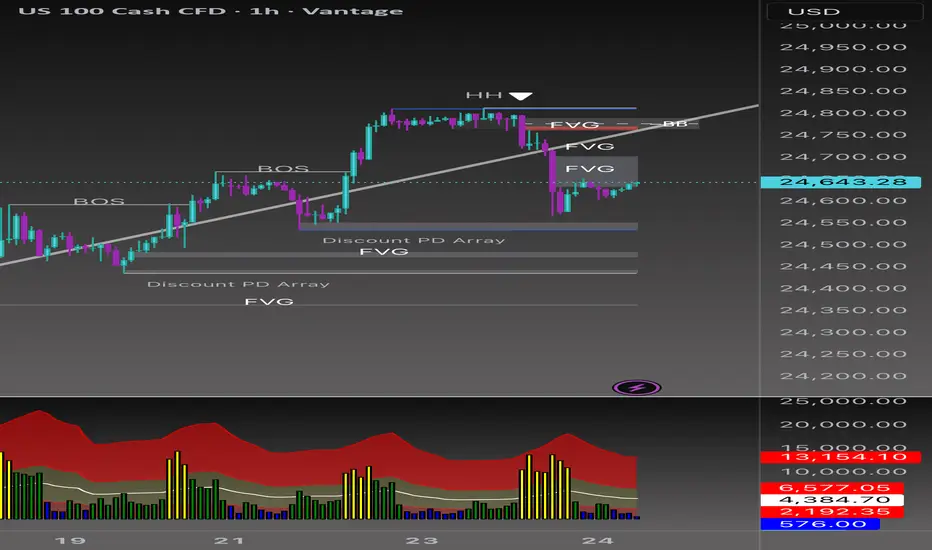
Beyond the Chart - NAS100 Through Technicals & Fundamentals📉 NAS100 VANTAGE:NAS100
Short Bias Analysis (1H Chart)
The market recently formed a Higher High (HH) followed by a Break of Structure (BOS) to the downside, suggesting a potential bearish shift. This move left behind multiple Fair Value Gaps (FVGs), now acting as supply zones.
Key Points
• Liquidity grab above the HH, followed by strong bearish momentum.
• Two FVGs aligning with short bias.
• Current retracement into inefficiencies offers a potential short entry.
• Downside targets: Discount PD Array and lower FVGs (24,480–24,440).
Trade Idea
• Entry Zone: 24,700–24,750 (upper FVG)
• Stop Loss (SL): Above 24,800 (invalidates bearish idea)
• Take Profit 1 (TP1): 24,560
• Take Profit 2 (TP2): 24,440
Risk management remains key 🔑 if price closes above the upper FVG/BB zone, short bias is invalidated.
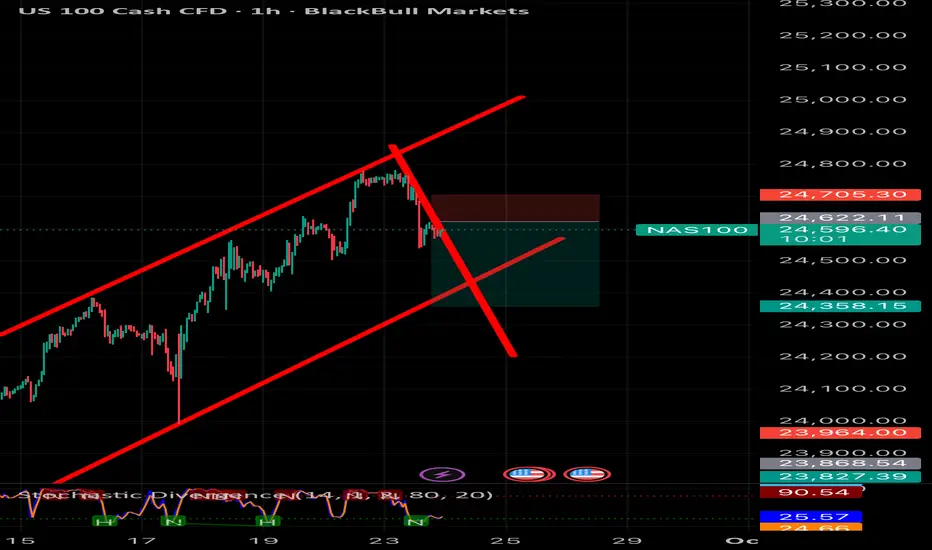
NAS100 rising wedge breakdown short setup The NAS100 recently broke down from a rising wedge formation on the 1H chart, signaling potential bearish momentum. After failing to hold above 24,700, price rejected the upper channel and is now trading below the wedge support.
Here’s my thought process:
• Pattern: Rising wedge, a bearish reversal pattern.
• Rejection Zone: Price failed at 24,705 resistance, confirming sellers stepped in.
• Breakdown Confirmation: A clean break below wedge support increases bearish bias.
Nas100 Trade Set Up Sep 23 2025Price has created a big 4h FVG so if price closes under SSL at London lows i will target 50% of the 4h FVG but if price sweeps SSL and closes above i will look for an 1m IFVG to take buys higher
NAS100 ShortElite Analysis
Price accumulation
Asian liquidity was taken out
Price action in lower time frames read as bearish
Targeting lower liquidity pools

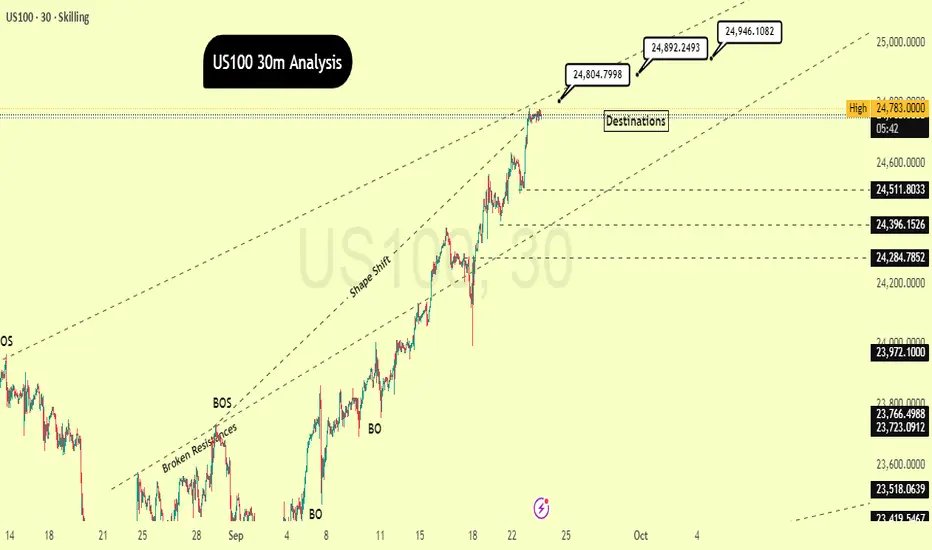
"Reaching Our First Target: What's the Next Step?"By scrutinizing the US100 chart on the30-minutes timeframe, it's evident that the price has initiated a powerful uptrend after surmounting several resistance zones. This is substantiated by the explicit "BOS" (Break of Structure) points, signaling that the market is consistently forging new, higher peaks. The "Shape Shift" noted on the chart indicates a transformation in market character, transitioning from a period of consolidation or a downtrend into a fresh, vigorous bullish impulse.
The price is currently nearing a pivotal resistance point around 24,783.0000. Should the price manage to breach and maintain a position above this threshold, we can anticipate a continuation of the upward trajectory. The prospective targets, labeled as "Destinations," are, 24804.7998, 24,892.2493 and , with an additional high-level objective at 24,946.1082.
I'd appreciate it if you could show your support through likes and comments to encourage me to share more analysis with you, and please share your perspective on the potential direction of this chart with me!
With Respect:
SimarEdgeTrading

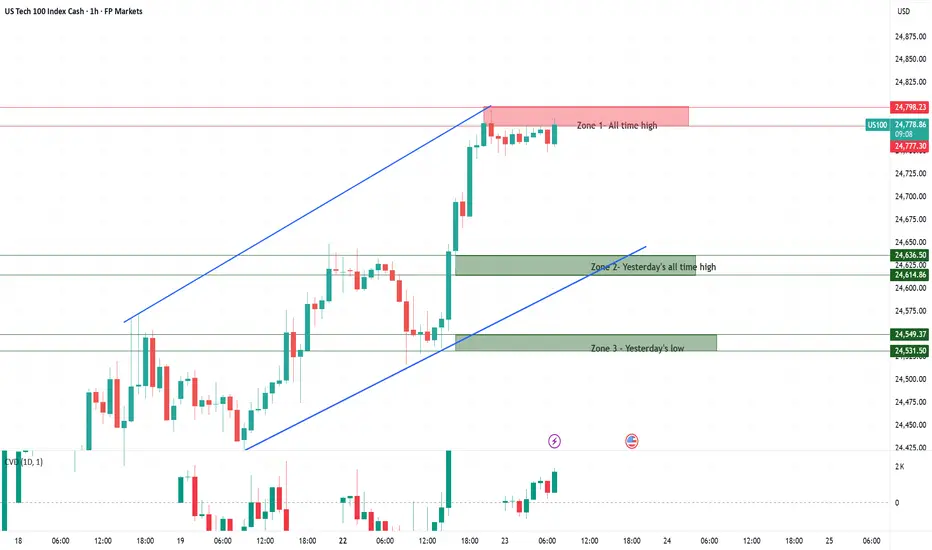
Trading Nas100 at Record Highs The Nasdaq-100 is currently trading at fresh all-time highs, which naturally makes it more difficult to identify strong, well-tested support and resistance levels. With limited historical price action to lean on, these zones should be viewed as guidelines rather than exact buy or sell levels. Traders should remain cautious and flexible in their execution.
Zone 1 – All-time high & yesterday’s high:
This area represents the current record high and the most immediate point of resistance. Price action here is uncharted territory, so reactions can be volatile. A breakout above this zone would confirm continued strength, while rejection could trigger short-term pullbacks.
Zone 2 – Yesterday’s all-time high:
This former high now acts as a potential reference support. If tested, it may attract buyers looking to defend the trend, but given the lack of historical confirmation, reliability remains limited.
Zone 3 – Yesterday’s low:
This marks the lower boundary of recent price action and serves as the next potential support area. If broken decisively, it could indicate fading momentum and open the door for a deeper retracement.
Nas100 is trading near record highs with strong momentum driven by the tech sector, especially AI leaders like Nvidia. The overall sentiment remains bullish, but traders should watch for potential consolidation as the index approaches resistance and technical indicators signal overbought conditions. Regulatory headlines and Fed rate-cut expectations could act as key catalysts for volatility.
USTEC - Trading Edge TodayDear Friends in Trading,
🎯Trading Edge:
Tech leading breakout momentum with institutional accumulation above POC
Key Level: 24,800 (volume gap fill)
Pivot: 24,650 – 24,700
Bias: Bullish above pivot
Bull target: 24,800 → 25,000
Bear target: 24,600 → 24,400
Correlation: +88% with US30, +52% with Gold (Fed trade)
Risk Assets Alignment:
GOLD🔄USTEC🔄US30
✅Gold + USTEC + US30 all bullish above pivots = Fed dovish trade confirmed
✅Unusual Gold/equity positive correlation suggests monetary policy driving both higher
Assets Overbought:
🔴USTEC - 4HR Overbought Divergence Detected
I sincerely hope my point of view offers a valued insight.
Thank you for taking the time study my analysis.

NasdaqNasdaq consolidated another support level at 24740 in today's session. If the price remains above this support, buyers remain in control, and we could reach 25000, an important level that could signal the end of the bullish rally. An H1 candlestick closing above 24800 could confirm continuation.


same stratlooking for first 1m resistance in this order block.
short it back to thsi main support zone
Nas100 Trade Set Up Sep 22 2025www.tradingview.com
Price is trading in between PDH/PDL and is approaching a 4h FVG so if it respects it i will look for internal bearish structure IFVG on the 1m to take sells to SSL levels

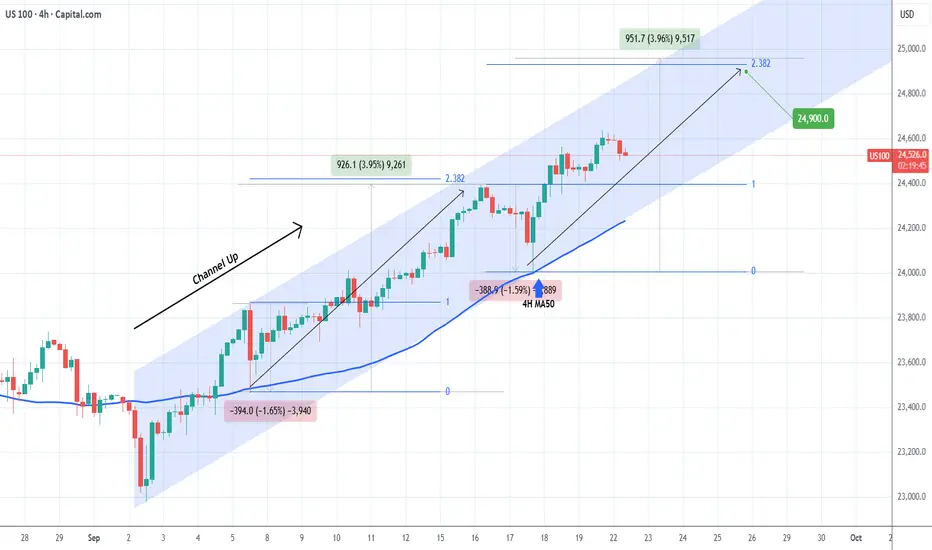
NASDAQ September's Channel Up targets 24900.Nasdaq (NDX) has been trading within a Channel Up since the September 02 Low and at the moment it is unfolding its 2nd Bullish Leg following the 4H MA50 (blue trend-line) bounce on September 17.
Based on the previous 4H MA50 Bullish Leg, the sequence should peak below the 2.382 Fibonacci extension at a maximum +3.96% rise. Our Target is slightly below those at 24900.
-------------------------------------------------------------------------------
** Please LIKE 👍, FOLLOW ✅, SHARE 🙌 and COMMENT ✍ if you enjoy this idea! Also share your ideas and charts in the comments section below! This is best way to keep it relevant, support us, keep the content here free and allow the idea to reach as many people as possible. **
-------------------------------------------------------------------------------
💸💸💸💸💸💸
👇 👇 👇 👇 👇 👇

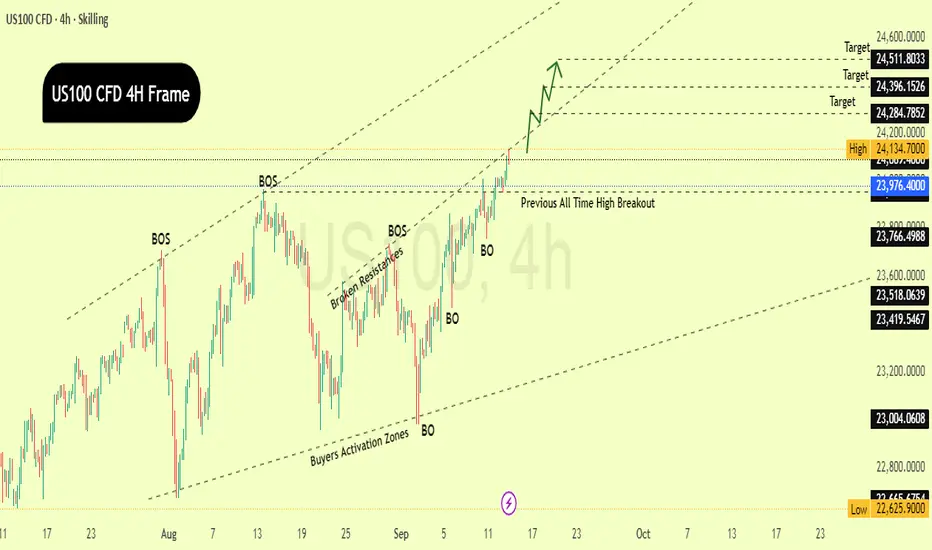
US100 Breaks All-Time High – Bullish Targets Ahead!This 4-hour chart of the US100 (Nasdaq) shows a strong bullish trend supported by multiple breakouts (BO) and break of structure (BOS) signals over the past few weeks. After retesting and bouncing from key buyer activation zones, the price has consistently broken through previous resistance levels.
Most notably, the index has just broken above its previous all-time high around 23,976, signaling strong momentum and potential for further upside. The price is currently hovering near 24,089, with key short-term targets marked at:
Target : $24,284
Target : $24,396
Target : $24,511
These targets align with the upper boundary of a rising parallel channel, suggesting the bulls are in control for now.
The chart projects a continuation of this bullish move, with a stair-step rally expected if the current breakout holds. As long as the price stays above the breakout zone and respects the structure, the upside targets remain in play.
In short: US100 is showing solid bullish strength, breaking above its previous highs with clear upside potential.
Educational Idea.
NAS100 - Stock Market, After the Fed Meeting!The index is above the EMA200 and EMA50 on the one-hour timeframe and is in its long-term ascending channel. If the drawn ascending trend line holds, we can expect the continuation of its previous upward path, but in case of a valid break, its downward path will be smoothed to the indicated support area.
A week filled with significant events in global markets came to an end, with the Federal Reserve’s decision to cut interest rates by 25 basis points standing out as the most important development. Although this move temporarily boosted the U.S. dollar, it failed to reverse its multi-day downtrend. Fed Chair Jerome Powell sought to frame the decision as a “risk management” measure, but the dot plot indicated that policymakers hold a different outlook, keeping the possibility of further cuts by year-end alive.
Meanwhile, Paul Atkins, Chairman of the U.S. Securities and Exchange Commission (SEC), announced that in response to President Donald Trump’s request, he would propose a rule change to replace quarterly corporate reporting with semiannual reporting. In an interview with CNBC, he said this matter has been placed on the SEC’s immediate agenda. With Republicans holding a 3-1 majority on the commission, such a change could be approved by a simple majority vote. This move would disrupt the traditional reporting and disclosure cycle, making investors wait longer intervals for corporate financial information.
In a Truth Social post, Trump wrote: “This change will cut costs and allow executives to focus on running companies properly instead of worrying about quarterly reports.” He also added: “You’ve heard people say China takes a 50- to 100-year perspective on corporate management, yet we run our companies quarter by quarter. That’s not good at all!” Atkins stressed that the matter remains only a proposal for now and requires review, meaning it is not yet finalized. Significant lobbying efforts are expected around this issue.
Following a week dominated by central bank decisions, markets in the coming days will shift their attention to a wide range of inflation, industrial, and housing data. Alongside these releases, the speech of Steven Miran, the newly appointed Fed member, is set to be a pivotal moment for investors.
Monday will be packed with monetary policy remarks, with Andrew Bailey and Huw Pill from the Bank of England, Rogers and Kozicki from the Bank of Canada, and Williams, Musalem, Barkin, and Harker from the Fed scheduled to speak. Nevertheless, the spotlight will be on New York, where Miran will deliver a speech at the Economic Club at noon local time. Having consistently advocated for faster and deeper rate cuts, his comments are being watched closely by markets.
On Tuesday morning, the release of the preliminary S&P Global PMI for September will coincide with Jerome Powell’s first remarks following the recent FOMC meeting. A day later, U.S. new home sales data will be published.
Thursday will bring the Swiss National Bank’s monetary policy decision. At the same time, markets will receive final U.S. Q2 GDP figures, durable goods orders, weekly jobless claims, and existing home sales data.
The week will conclude on Friday morning with the release of the Personal Consumption Expenditures (PCE) price index for August, the Fed’s preferred inflation gauge. On the same day, the revised University of Michigan consumer sentiment survey for September will also be released, offering a fuller picture of consumer confidence.
Currently, many leading financial institutions expect further consecutive rate cuts in the Fed’s two remaining meetings of 2025. In this context, upcoming speeches from key Fed members could shape expectations. Markets are particularly focused on comments from Waller and Bowman, who previously opposed Miran’s proposal for a 50-basis-point cut. On the political side, it is anticipated that President Trump will once again direct sharp criticism at Powell, a factor that could weigh further on market sentiment.
Separately, Berkshire Hathaway, led by Warren Buffett, has fully exited its investment in Chinese automaker BYD, ending a 17-year-long position. The divestment followed a gradual reduction of shares starting in 2022, and according to Berkshire’s energy unit, the investment had fallen to zero value by the end of Q1 2025.
A company spokesperson confirmed that the position was fully closed. Meanwhile, BYD’s head of public relations expressed gratitude for Berkshire’s long-term support since 2008, noting that the ownership stake began shrinking in 2022 and fell below 5% by mid-2024. This investment is regarded as one of Berkshire’s most successful ventures in Asia.
