Nasdaq - USTEC: Trading Edge TodayDear Friends in Trading,
Experimental Test Phase Week:
Correlation Logic & Daily Efficiency - GOLD🔄NASDAQ🔄DOW JONES
🔎 Previous Week Observations -
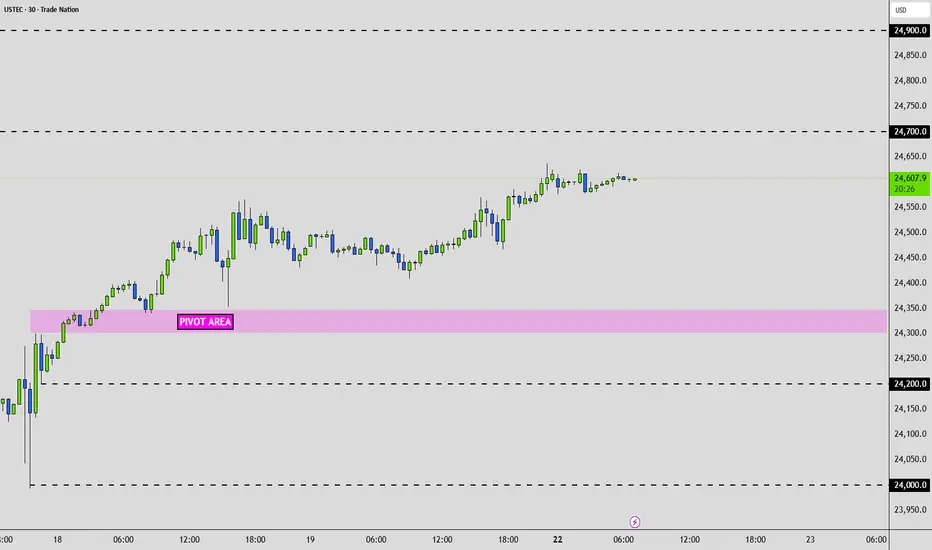
Strong accumulation & clustered trading between 24,300 – 24,350.
This is where most volume likely sat (clustered POC zone).
Breakout above 24,400 carried price strongly higher.
Current price (~24,615) is sitting above last week’s value area, riding momentum.
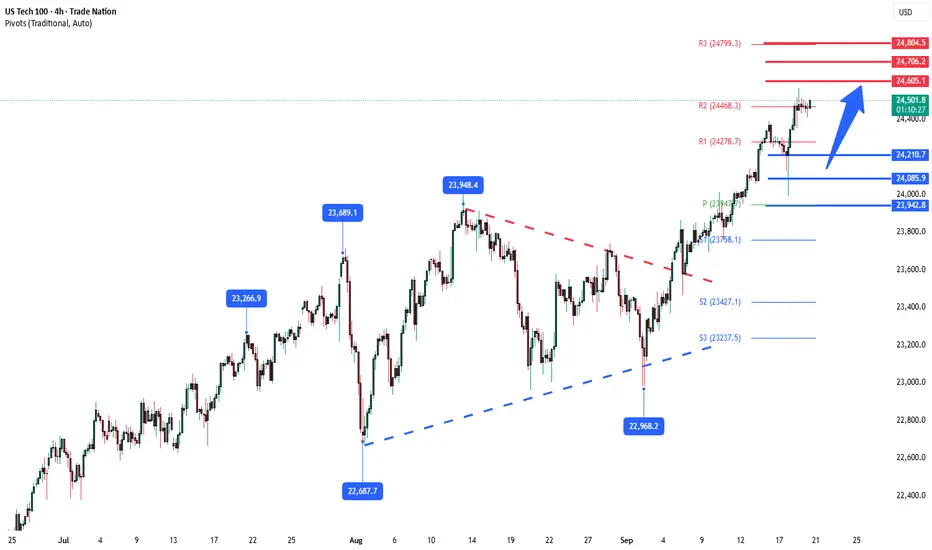
USTEC - 22Sept:
Pivot: 24,300 – 24,350
Bias: Bullish while above pivot
Bull targets: 24,700 → 24,900
Bear targets: 24,200 → 24,000
👉 Nasdaq leading tech momentum.
Stronger risk appetite = supports US30 as well, usually opposite Gold.
I sincerely hope my point of view offers a valued insight.
Thank you for taking the time study my analysis.
NAS100 trade ideas
NASQAD Weekly NASQAD 📊 Weekly Market Outlook
On this pair, we see a strong confluence forming on the Weekly timeframe:
✔️ Weekly Fair Value Gap (FVG)
✔️ Strong Weekly Order Block
✔️ Fibonacci retracement alignment
This zone is a high-probability area to watch. If price taps into this level, we’ll look for confirmation on lower timeframes before executing a buy setup.
Smart traders wait for price action to confirm before entering patience here can make all the difference.

NAS100Success in forex and stocks comes from a combination of knowledge, discipline, and patience. Understanding market trends, economic factors, and company
fundamentals is crucial, but equally important is controlling emotions and sticking to a well-planned strategy. Continuous learning, adapting to changing conditions, and managing risk wisely can turn opportunities into consistent growth over time.
Consistency, not luck, separates successful traders from the rest.

Nasdaq-100 (NDX) Weekly Chart 2025 Chart Context
This weekly timeframe analysis of the Nasdaq-100 Index (NDX) forms a key pillar in our 2025 macro analysis series. Following the breakout structure seen in TOTAL, TOTAL2, BTC.D, and US10Y, this chart utilizes 2 Fibonacci tools (1 trend-based extensions and 1 retracement) to project potential corrective and expansion scenarios.
Fibonacci Tools Used:
Fibonacci Retracement : Applies to the recent smaller swing to determine micro retracement zones and cluster supports.
0=20674 and 100=10504
Trend-Based Fibonacci Extension: Drawn using a three-leg structure (point A= 3993 to B=16724 to C10504) to forecast upside targets beyond ATH.
All take-profit (TP) levels: TP1 (~23,400), TP2 (~26,700), and TP3 (~30,344.49)—are located at confluence zones where Fibonacci levels from different tools align, reinforcing their validity and strength.
There is a 4TP above all the Visible TPs
Key price references:
0% retracement: ~20,674.71
Next Resistance ~23,400 (confluence of extensions and psychological resistance)
Projected TPs:
1TP=~23,400,
2TP=~26,700,
3TP=~30,344.49,
4TP=44000
Support/Resistance:
Red zone: ~16,700–18,300 (historical S/R and correction target and Fib Confluences)
Resistance zone: ~23,000–23,400 ,
22000(ATH area)
Key Technical Observations:
Fibonacci Retracement from ~20674 to ~15732 marks the initial corrective range.
Trend-Based Extensions forecast:
TP1 (~23,400): First breakout resistance
TP2 (~26,700): Medium-term expansion zone
TP3 (~30,344): Long-term target if macro tailwinds persist
Scenario Pathways:
Bullish Continuation: Breaks above ATH to reach TP2/TP3
Healthy Correction: Pullback to ~20,600 or deeper ~18,300 before resumption
Deep Correction: Revisits ~16,700 zone if macro environment deteriorates
Fundamental Context:
Tech Stocks & Economic Sentiment: NDX is often the first to move during liquidity expansions. Its performance signals risk-on behavior across global equity markets.
Rate Cuts in 2025: With anticipated Fed rate cuts, tech stocks are primed for inflows. Forward earnings valuations rise, justifying extended upside in high-beta tech.
AI Boom & Earnings Growth: Nasdaq is heavily weighted toward AI, cloud, and semiconductors—sectors expected to lead earnings surprises.
NDX Influence on Gold and Crypto
When NDX rallies:
Crypto: Risk appetite improves. Capital rotation flows into altcoins and layer-1 assets.
Bitcoin: Often sees parallel inflows, especially during strong tech rallies (e.g., 2020).
TOTAL & TOTAL3: Begin breakout patterns if NDX continues to surge.
Gold: May stall or correct as investors favor risk assets. However, gold still holds due to macro hedging and real yield pressures.
When NDX corrects:
Crypto: Volatility spikes. Altcoins bleed faster.
Bitcoin: Short-term dip but may decouple if viewed as digital gold.
Gold: Benefits from flight-to-safety behavior.
US10Y: Often reacts inversely to NDX moves—used for confirmation.
Search Highlights (2024–2025):
Institutions view NDX correction as signal to rotate into commodities (incl. gold).
Cross-market correlations show NDX peaks often precede crypto mini-rallies.
De-risking from NDX often triggers gold strength, especially in geopolitical or inflationary backdrops.
Bias & Strategy Implication
Primary Bias: Bullish
Expecting upside continuation to 26,700–30,000 zone
Multiple correction opportunities are present even during rally
Strategic Actions:
Monitor for correction to yellow/red zones for accumulation
Use NDX behavior as leading macro signal for crypto rotations
Watch resistance at 23,400 closely; breakout confirms trend extension
Time Horizon
Short-Term (1–2 months): Watch for breakout or correction to ~20,600–18,300
Mid-Term (3–6 months): Probable test of ~26,700
Long-Term (6–12 months): Potential expansion to ~30,344.49

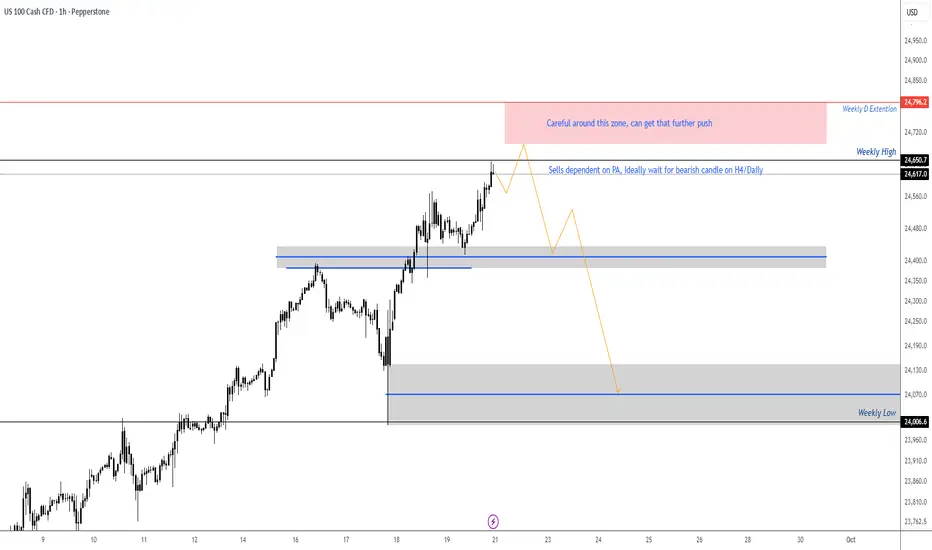
NASDAQ - setting up for Bearish SetupLooking for the bearish signal or the H4/Daily time frame, might get that final push for the D extension on the weekly timeframe, opening of the week might get a small pullback then continuation to the upside. Trade will be validated only if we get bearish PA setup on the H4/Daily. Looking for the setup to create a turn shape then can look for potential entries. If price does not present a bearish setup on the H4/Daily then the plan is no longer valid.
Who find this 3monthly candle trend line fascinating?short term 26665 long term 30030
26665 Oct 2025 if not 27958 Jan 2026 if not then April 2026
s3.tradingview.com

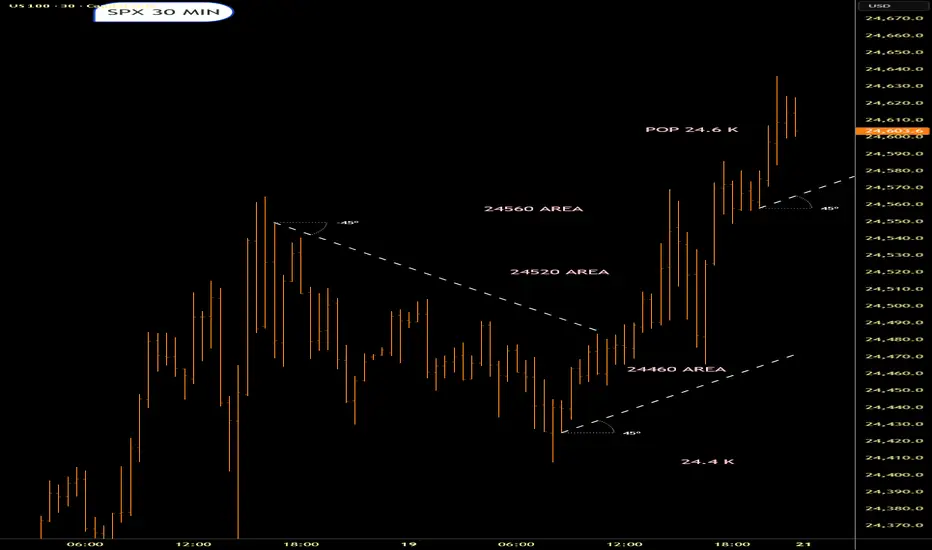
Naz 100 into the new weekWe either pop 24.6K or test those lower poss supp areas.Lets see what happens

nas100 4hTrading Perspectives for the Upcoming Week
In this series of analyses, we have reviewed short-term trading perspectives and outlooks.
As can be seen, in each analysis there is a significant support/resistance zone near the current asset price. The market’s reaction to or break of this level will determine the future price trend up to the next specified levels.
Important Note: The purpose of these trading perspectives is to examine key price levels and the market’s potential reactions to them. The analyses provided are by no means trading signals!

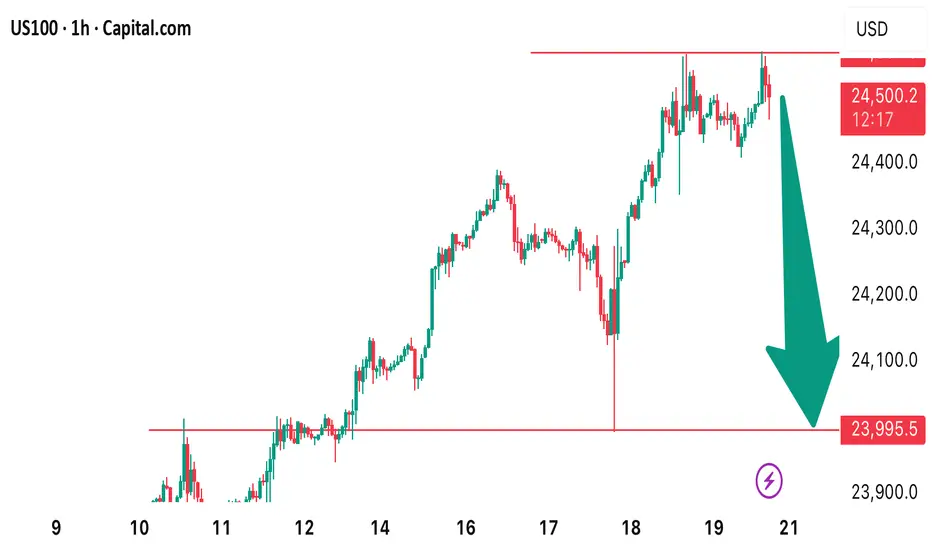
Buy Opportunity Nas100Nas100 is bullish, therefore, this coming week we still looking for buys.
A lot of buyers will step into the market on the 3rd touch of the trend line, but the market will take those buyers out because there is a demand zone and liquidity below the trend line.
I believe the market will break the trend line, go towards the demand zone, and grab liquidity below that demand zone before continuing in its bullish momentum. It might even go towards the daily key level at 23900 before continuing up. Therefore, once we reach the demand zone, it is important that we drop to lower time frames and look for buying opportunities, being mindful of the liquidity zone. Do not take an aggressive entry, look for change of character on lower time frames before taking a buy position.

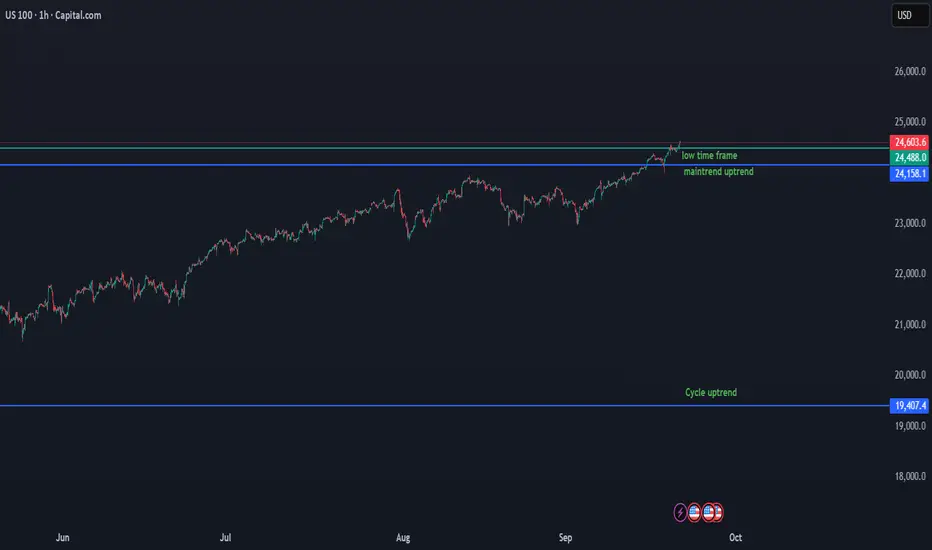
US100 Key Levels & Trend OutlookUS100 Update
We use advanced data that counts the start of the cycle and all important key levels.
On the low time frame, Nasdaq is consolidating just above the 24,516 – 24,488 support zone, which now acts as the key base for continuation.
Key levels:
24,516 – 24,488 → critical short-term support. Holding above confirms continuation of the uptrend.
24,603+ → current resistance. A clean breakout and hold above this level would extend bullish momentum and push toward new highs.
Downside risk: If price breaks back below 24,488, the next support sits around 24,158. A deeper breakdown from there could open a correction toward 23,404.
Cycle support: 19,407 is the major cycle uptrend level. Nasdaq must stay above this to keep the long-term bullish structure intact.
📌 Summary
Above 24,516 – 24,488 → bullish continuation in play.
Break & hold above 24,603 → signals further upside.
Below 24,488 → correction risk, first support at 24,158, then 23,404.
19,407 → cycle-level support for the long-term trend.
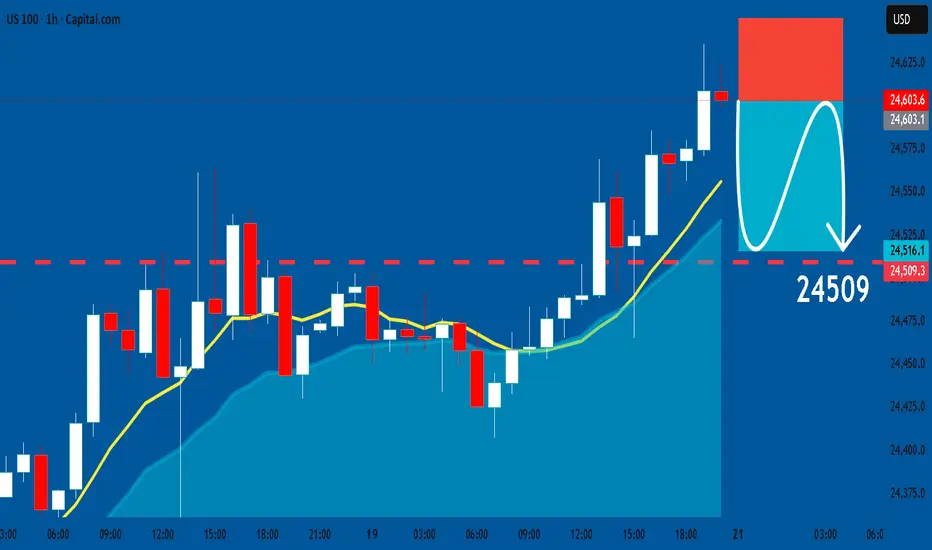
US100: Short Signal with Entry/SL/TP
US100
- Classic bearish formation
- Our team expects fall
SUGGESTED TRADE:
Swing Trade
Sell US100
Entry Level - 24603
Sl - 24651
Tp - 24509
Our Risk - 1%
Start protection of your profits from lower levels
Disclosure: I am part of Trade Nation's Influencer program and receive a monthly fee for using their TradingView charts in my analysis.
❤️ Please, support our work with like & comment! ❤️
3 CANDLE PUSH?Will this be a three candle push higher before we retrace to the order block below with a FVG, or will we immediately take the highs of the current daily candle and then draw back below? Only Monday can tell I envy those that will be here to witness it all

Nasdaq bullish trendThe Nasdaq trend is quite bullish, but we must be very cautious in selling positions and not take trades against the trend. The best ranges for buying MPLs have been identified.

NAS100 Technical Forecast: Key Levels & Traps🚀 NAS100 Technical Forecast: Key Levels & Traps 🐻
*Analysis as of Sept 20, 2025 (12:50 AM UTC+4)*
📊 Overall Market Context:
Price: 24,610. Geopolitical events remain a key volatility driver. Current price action suggests a cautious market seeking direction after recent moves.
🔍 Key Technical Indicators:
• RSI (14): Neutral zone (~50). No strong overbought/oversold signal.
• Bollinger Bands (20): Price near the middle band, indicating balanced volatility.
• Moving Averages: Watching for a potential bearish crossover on the 4H chart. Key resistance at the 50-EMA.
• VWAP: Current price trading around the session's VWAP; a break above signals intraday bullish bias.
🎯 Critical Support & Resistance:
• Immediate Resistance: 24,800 -> 25,000 (Psychological)
• Strong Resistance: 25,250 (Previous High)
• Immediate Support: 24,500 -> 24,300
• Strong Support: 24,000 (Key Level)
⚠️ Pattern Watch:
• Bull Trap Risk: A false breakout above 24,800 could lure buyers before a drop.
• Bear Trap Risk: A sharp rejection from 24,300 could trap sellers before a rally.
• No clear Harmonic or Elliott Wave pattern on lower timeframes; monitoring for setup.
📈 Intraday Trading (5M-1H Charts):
• BUY (Long): Above 24,650, targeting 24,800. Stop Loss: 24,550.
• SELL (Short): Below 24,500, targeting 24,300. Stop Loss: 24,650.
*Confirmation: Use 5-min RSI divergence and volume spikes.*
📉 Swing Trading (4H-Daily Charts):
• BUY Swing: On a bullish reversal candle at 24,300 support, target 25,000+. SL below 24,000.
• SELL Swing: On a rejection at 24,800 resistance, target 24,000. SL above 25,100.
*Wait for a 4H close above/below key levels for confirmation.*
🎲 Risk Management:
Always use a 1:2 Risk/Reward ratio. Protect your capital.
For individuals seeking to enhance their trading abilities based on the analyses provided, I recommend exploring the mentoring program offered by Shunya Trade. (Website: shunya dot trade)
I would appreciate your feedback on this analysis, as it will serve as a valuable resource for future endeavors.
Sincerely,
Shunya.Trade
Website: shunya dot trade
📝 TRADING CHECKLIST
Before entering any position:
- ✅ Confirm volume supports move
- ✅ Check RSI for divergences
- ✅ Verify multiple timeframe alignment
- ✅ Set stop loss before entry
- ✅ Calculate position size
- ✅ Review correlation with DXY/SPX
- ✅ Check economic calendar
- ✅ Assess market sentiment
⚠️Disclaimer: This post is intended solely for educational purposes and does not constitute investment advice, financial advice, or trading recommendations. The views expressed herein are derived from technical analysis and are shared for informational purposes only. The stock market inherently carries risks, including the potential for capital loss. Therefore, readers are strongly advised to exercise prudent judgment before making any investment decisions. We assume no liability for any actions taken based on this content. For personalized guidance, it is recommended to consult a certified financial advisor.

NasdaqNasdaq After breaking through 24500, it broke through 24550 with a pullback confirming consolidated support. Buying pressure continues; we can wait for the resistance at 24600 to break and reach 24750.

US100 is Forming equal highs- possible sell opportunity!Price is forming a double top in H1 timeframe. We high a high probability to see a sell off from that all time high. A sell opportunity is envisaged from the current market price.
NAS100 Short SetupTrend: Bullish
Divergence: Bearish
Continuation Pattern : None
Reversal Pattern: Double Top
Bias: Bearish
Scenario: Sell Stop at Neckline breakout
Trade Plan
Stop Loss 24750
Entry Level 24400
TP1 24230

3rd Short term trade with NASDAQAfter two consecutive profits on the NASDAQ, I hope this third trade will also yield satisfactory result. A good risk-reward ratio is crucial in trading.

NAS100 ShortElite analysis
Discretionary trade with confirmations
Targeting London liquidity
Executed on the 30 second time frame

NSDQ100 volatility, triple-witching could exaggerate swings.Nasdaq 100 Trading Drivers
Macro backdrop:
US data came in strong:
Jobless claims fell to 231k (vs. 240k exp; prior 264k).
Continuing claims declined to 1.92m (vs. 1.95m exp).
Philly Fed survey surged to 23.2 (vs. 1.7 exp), an 8-month high.
This eased US slowdown fears and reinforced risk-on sentiment.
Equities:
Nasdaq +0.94% → new record high.
Tech/semis led: Intel (+22.8%) strongest S&P performer after Nvidia’s $5bn investment and US gov’t stake news. Philadelphia Semiconductor Index +3.6%.
Momentum broadened → Russell 2000 +2.5%, first record high since 2021.
Rates:
Treasuries sold off on strong data → 10yr yield +1.7bps to 4.11%, 30yr +3.4bps. Higher yields a potential headwind if sustained.
Event risk:
Trump–Xi call (9 a.m. ET): key for TikTok’s US future & broader trade tone. Risk of mixed headlines given tensions (China soybeans skip, Gaza criticism, Taiwan aid freeze).
BoJ surprise: announced unwind of $4.2bn/year ETF holdings → dampened global risk tone.
US triple-witching: options/futures expiries today → elevated intraday volatility likely.
Nasdaq 100 Trading Takeaway
Bullish momentum intact: record highs fueled by tech & semiconductor leadership.
Short-term watchpoints: Trump–Xi headlines and BoJ shift may inject volatility; triple-witching could exaggerate swings.
Key risk: rising US yields may cap upside if bond sell-off deepens.
Bias: Still risk-on / buy dips near-term, but position sizing should account for headline-driven volatility today.
Key Support and Resistance Levels
Resistance Level 1: 24600
Resistance Level 2: 24710
Resistance Level 3: 24800
Support Level 1: 24210
Support Level 2: 24085
Support Level 3: 24940
This communication is for informational purposes only and should not be viewed as any form of recommendation as to a particular course of action or as investment advice. It is not intended as an offer or solicitation for the purchase or sale of any financial instrument or as an official confirmation of any transaction. Opinions, estimates and assumptions expressed herein are made as of the date of this communication and are subject to change without notice. This communication has been prepared based upon information, including market prices, data and other information, believed to be reliable; however, Trade Nation does not warrant its completeness or accuracy. All market prices and market data contained in or attached to this communication are indicative and subject to change without notice.
NAS100Nasdaq-100 (NAS100) Performance on September Options Expiration Days (2015–2024)
Based on historical data for the Invesco QQQ ETF (which tracks the Nasdaq-100), below is the daily performance on the third Friday of September each year—the standard options expiration day. The result is "Rise" if the closing price increased from the previous trading day's close, or "Fall" if it decreased. Data is sourced from reliable financial records, including adjusted closing prices.
- 2015: Fall (-0.45%)
- 2016: Rise (+0.32%)
- 2017: Rise (+0.62%)
- 2018: Fall (-0.20%)
- 2019: Rise (+0.11%)
- 2020: Fall (-1.18%)
- 2021: Fall (-1.25%)
- 2022: Fall (-1.69%)
- 2023: Fall (-1.13%)
- 2024: Fall (-0.19%)

NasdaqNasdaq has just broken through the 24500 level. Candlestick wicks have shown selling interest at this level, but buyers are still in control. This will soon become consolidated support, and we could reach 24750.
