NAS100 Trade Set Up Nov 28 2025Price remains bullish making HH/HL on the 1h. I will want to see a tap in the 4h gap followed but 1m-5m IFVG/CISD to continue higher BSL
Trade ideas

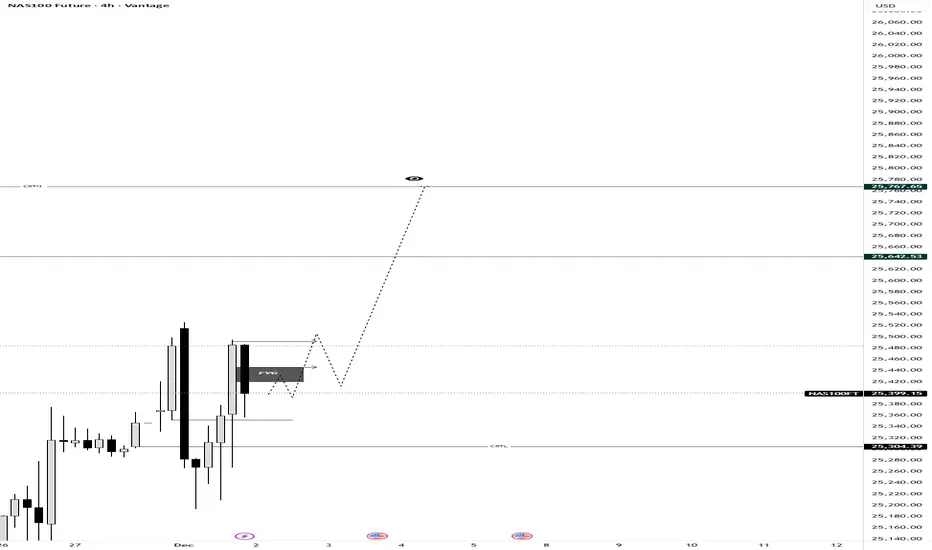
NAS100 Decoded: The Anatomy of a CRT SetupMost traders see random candles; we see a structured story. On this 4H NAS100 chart, we are witnessing a textbook example of Candle Range Theory (CRT) in motion.
If you understand the "Three-Phase Engine" inside every candle, the next move becomes clear.
The 3-Step Logic Behind This Setup:
The Purge (Accumulation): Notice how price dipped to sweep the CRTL (Candle Range Theory Low). This wasn't a random breakdown; it was a Purge Phase designed to grab liquidity and trap retail shorts. By sweeping the low (PL), the market collects the necessary fuel for the reversal.
The Mitigation (The Current Trap): Price has reclaimed the range and is currently mitigating within the FVG (Fair Value Gap). In CRT, this is the Mitigation Phase, where price returns to balance or "Equilibrium" (EQ) to fill imbalances before the real move begins. This phase often confuses traders, but it is simply smart money rebalancing positions.
The Expansion (The Delivery): With the internal liquidity harvested and the imbalance filled, the logic dictates a move toward the CRTH (Candle Range Theory High). This is our Expansion Phase, targeting the "Expansion Level" (EL). The "eye" icon on the chart represents the Draw on Liquidity (DOL)—the magnetic attraction pulling price toward the liquidity pools resting above the highs.
💡 The Lesson: Don't chase the red candles during the purge. Wait for the mitigation. As the theory states:
"The Purge phase creates the opportunity, the Mitigation phase provides the entry, and the Expansion phase delivers the profit".
Are you watching this FVG hold, or are you waiting for a break of structure confirmation? Let me know in the comments! 👇
Greetings,
MrYounity
NSDQ100 - Soft ADP employment figuresUS equities showed tentative stabilisation, with the S&P 500 up modestly and Nasdaq futures also edging higher this morning. Markets remain cautious ahead of a heavy US data slate and next week’s FOMC, with rate-cut expectations already priced at over 90%, limiting upside momentum for growth stocks.
Focus today is firmly on ADP private payrolls and the ISM services survey, especially the prices paid component, which is seen as an important inflation proxy in the absence of official CPI data. A soft ADP print would reinforce the view of a cooling labour market and be supportive for rate-sensitive Nasdaq tech, while any upside surprise risks pressuring the index via higher yields.
Treasury yields are drifting lower, offering some support to mega-cap tech, but overall trading conditions remain fragile. Crypto volatility continues to spill into risk sentiment after sharp moves in Bitcoin and crypto-related equities.
Geopolitics adds background risk, with no breakthrough on Ukraine talks and renewed threats from Russia, but for Nasdaq traders the near-term direction is likely to hinge almost entirely on today’s US data and its implications for Fed policy next week.

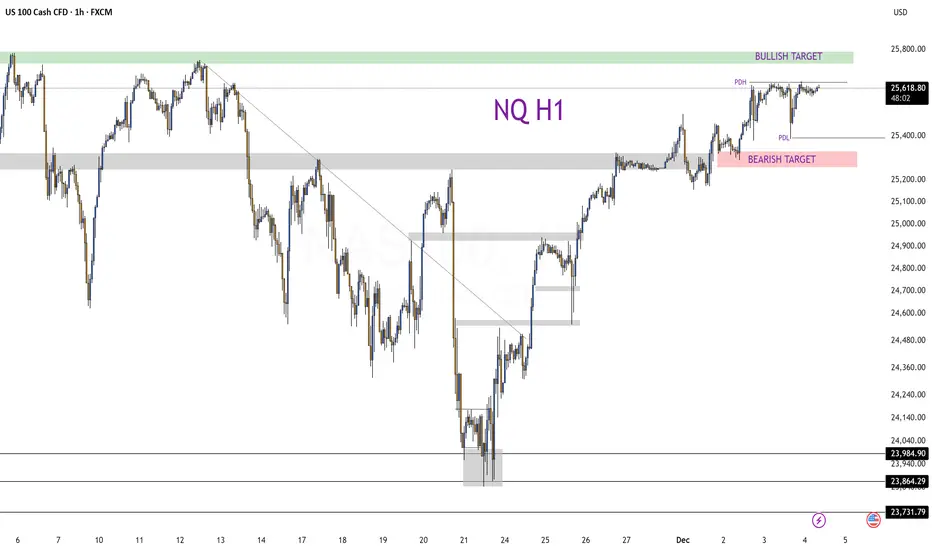
2 DEC 2025: US100 MARKET RECAPJUST JOURNALLING
DISCLAIMER:
The owner of this page is an authorised Representative under supervision of TD MARKETS (PTY) LTD, an authorised Financial Services Provider (FSP No. 49128) licensed by the Financial Sector Conduct Authority (FSCA) under the Financial Advisory and Intermediary Services Act (FAIS).
The FSP is licensed to provide advice and intermediary services in respect of Category I financial products, including but not limited to derivative instruments, long-term deposits, and short-term deposits.
All investment ideas are provided in accordance with the scope of the FSP's license and applicable regulatory requirements. Derivative instruments is a leveraged products that carry high risks and could result in losing all of your capital, and past performance is not indicative of future results.
This idea and any attachments are informational/education and does not constitute a recommendation to buy/sell.
No guarantee is made regarding the accuracy or outcome of this trade idea.
If you choose to accept this idea, please do so at your own risk.

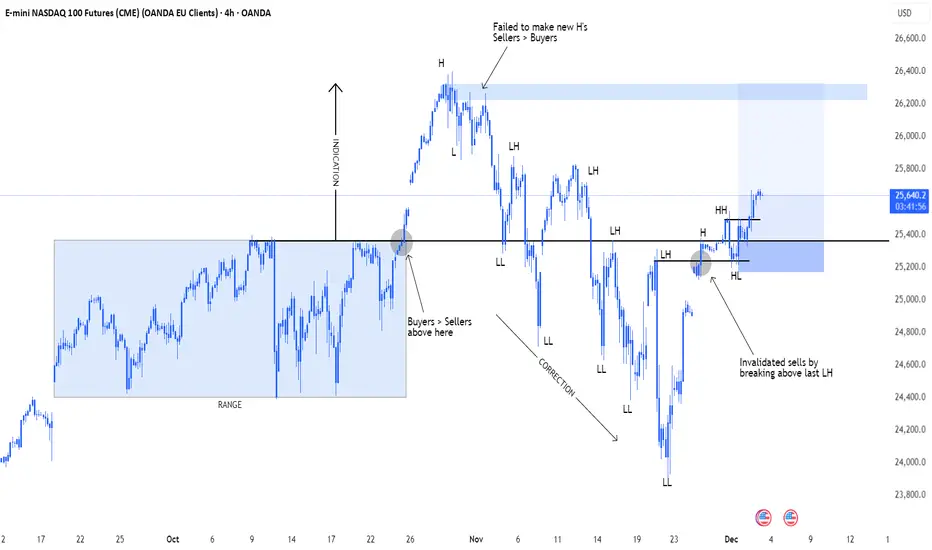
NAS100 LONG setupNas has been ranging for over a month back in Sep-Oct, buyers won the battle and pushed price to 26,3k.
Sellers kicked in again and price corrected for another month.
Recently price has broken back above the level and from here I'm looking for buys, as long as it keep making HHs and HL's during the next couple of weeks, during next New York sessions.
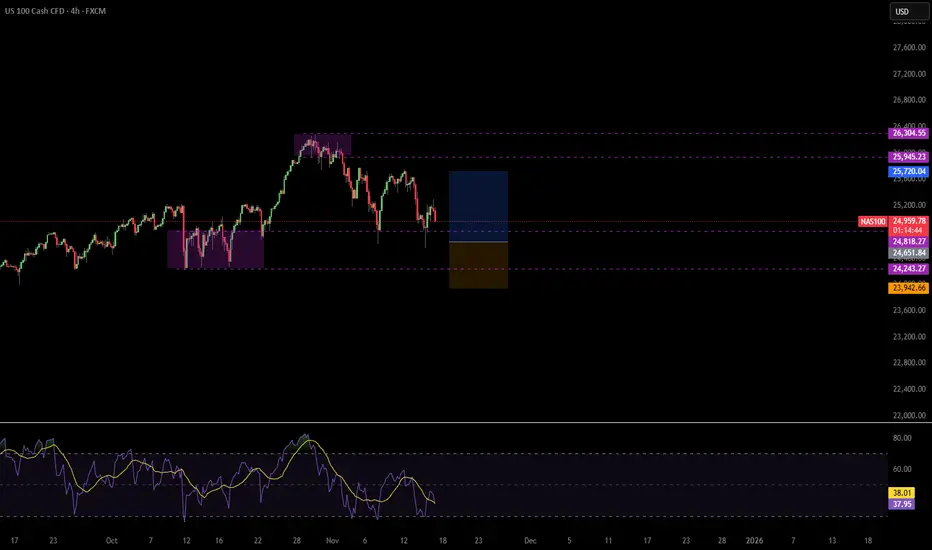
Sell Nass100Price rejected strongly from the upper supply zone and slipped back below it. As long as price stays under that zone, bears stay in control. I’m expecting a deeper correction toward the demand zone around 24 690 – 24 700.
Bias: Bearish
Entry Zone: Below the broken supply
Target: 24 700
Invalidation: Break and hold above the supply zone

Buys or Sells1)Bullish Trend
2)Break of Structure
3)Above 50Moving Average.
I see a bullish start of the week for most markets, but very well could go to the downside to continue a very uncharacteristic 4th quarter. I believe fundamentals will play a huge part in trading decisions through the holiday season for most traders. I'm thinking about not trading at all the market is looking choppy.

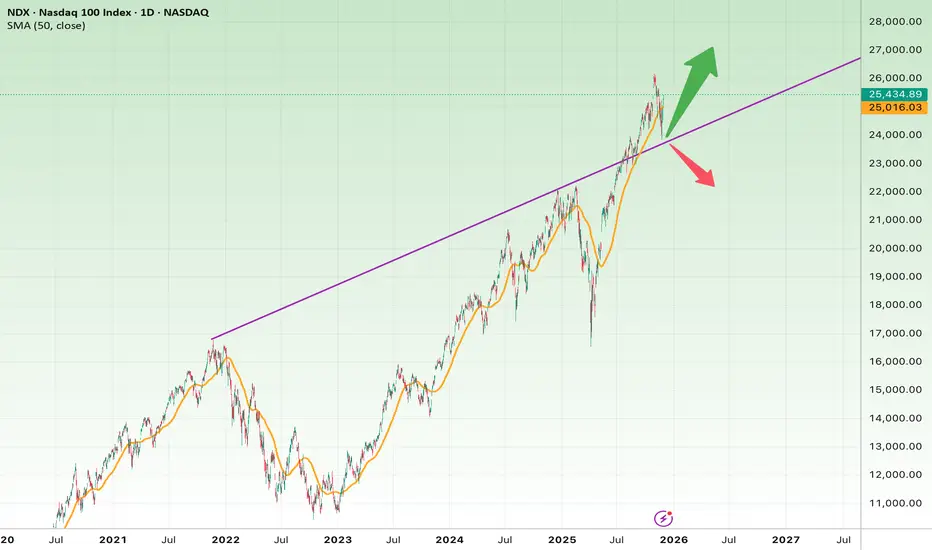
Nasdaq 100 (NDX) – Daily Chart AnalysisThe chart shows that the Nasdaq 100 has been in a strong multi-year uptrend from 2023 to 2025 and is now touching a major long-term ascending trendline (purple line).
This is one of the most critical decision zones for the index.
Bullish Scenario (More Likely at the Moment)
Price is currently holding above the long-term trendline and is also trading above the SMA50 (orange line), which still has a positive upward slope.
If the price continues to respect this trendline:
Bullish Targets
• 26,600
• 27,200
• 28,000 (major upside target)
Signals that strengthen the bullish case:
• A breakout above the previous high near 25,900–26,000
• Strong closing candles above the trendline
• Increasing bullish volume
Bearish Scenario (If the Trendline Breaks)
If the index breaks below the ascending trendline and then loses the SMA50, it could enter a broader corrective phase.
Bearish Targets
• 23,800 – first major support
• 22,500
• 20,800 – key structural support
Bearish confirmation signs:
• A strong breakdown candle below the trendline
• Failure to reclaim the SMA50
• Weak or failed retest (pullback) of the broken trendline
Logical Stop-Loss Zones
• Long positions: Below 24,600
• Short positions: Above 25,900
Quick Summary
• NDX is sitting right on a major long-term trendline.
• Bullish scenario remains stronger as long as the trendline holds.
• Breaking the trendline would likely trigger a deeper correction.
• Holding above it could push price toward 27K–28K.
Nasdaq — Current Setup & What Could Happen Next📈 Nasdaq — Current Setup & What Could Happen Next
🔹 Technical Setup
Nasdaq has been accumulating between 25,600–25,650 since Tuesday, marking a clear base where buyers stepped in.
I’m watching for a break to the upside with pullback entries, aiming to complete the fractal toward 25,770, a level with previous supply/resistance.
Yesterday’s -1% drop after negative news from Microsoft was gradually erased by steady buying — a sign that underlying demand remains resilient.
The accumulation and rebound off that base may signal a renewed bullish leg, provided we see clean technical confirmation.
🌎 Fundamental & Market Context
Rate-cut hopes are returning: Traders are increasingly betting on a potential cut by the Federal Reserve next month, which tends to support growth and tech sectors.
That expectation has helped lift sentiment across U.S. equities, including the Nasdaq.
On the flip side, rising Treasury yields and macroeconomic uncertainty remain a risk; any hawkish Fed hints or weak corporate earnings could challenge the bullish view.
🎯 Trading Scenarios
➡️ Bullish:
Break of accumulation zone → long entries on pullback → target 25,770.
⚠️ Bearish / Cautious:
Failure to break up, or a sharp reversal → fallback toward lower liquidity zones/Potential PDL.
TVC:DXY SP:SPX CAPITALCOM:US100

NAS100: Momentum Weakening — Watching for a Short Into Recent LoNASDAQ is showing signs of short-term exhaustion, with momentum favouring another attempt lower. A deeper pullback into the trendline is possible but uncertain.

NAS100 Sits at Key LevelPrice is sitting right on top of major support. This level has been holding up nicely before, and it's also a strong psychological round number, which means buyers naturally defend it harder.
This is where buyers stepped in aggressively the last time. And where reactions tend to be violent.
This is the market literally waiting for a catalyst.
And here’s the important part:
If buyers manage to hold this zone?
We could easily see price pushing back toward 24,750.
BUT…If this support gives way…Then everything changes.
A breakdown here would invalidate the bullish structure entirely and starts a larger bearish move. When a level this strong breaks, it usually drops hard and strong.
So right now, the market is at a crossroads.
A clean break + retest below this level would confirm it.
In short:
👉 Hold the zone → bullish push toward 24,750
👉 Lose the zone → strong bearish continuation

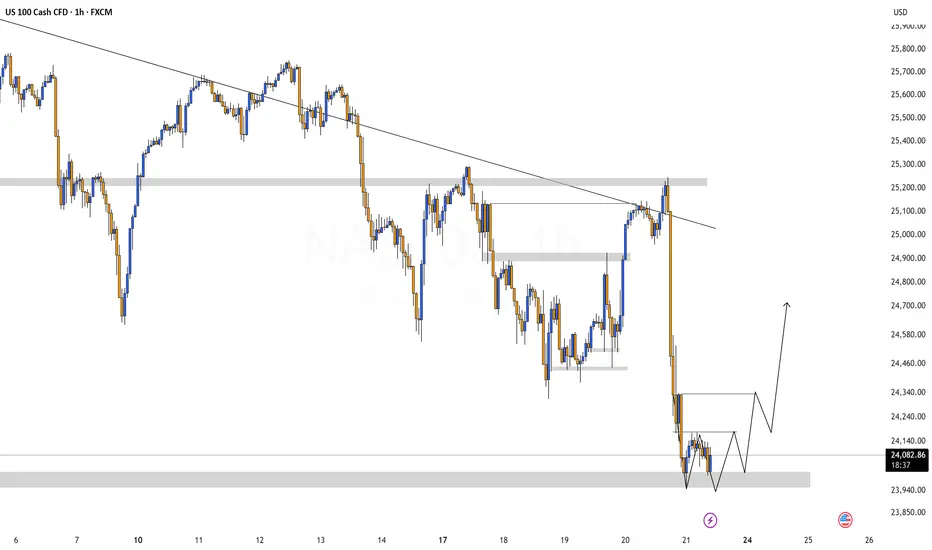
NASDAQ Analysis – Recovery Expected After an Overextended DropYesterday’s sharp Nasdaq drop was surprising, especially considering Nvidia’s exceptional earnings, renewed confidence that we’re not in a bubble, and the strong labor data from NFP. Under normal conditions, the market would likely have reacted with a 2%+ rally.
However, investors are now pricing in the idea that the Fed will not cut rates in December, which created fear-driven selling and an exaggerated move to the downside.
Today, I would like to see a relief recovery, as the index has started to form a double-bottom pattern, a typical structure before liquidity grabs to the upside. If confirmed, price could push back up to take out recent highs.
Historically, after large impulsive drops, the stock market tends to open in green, as investors take advantage of discounted prices. If momentum shifts, the Nasdaq could quickly reclaim lost ground.

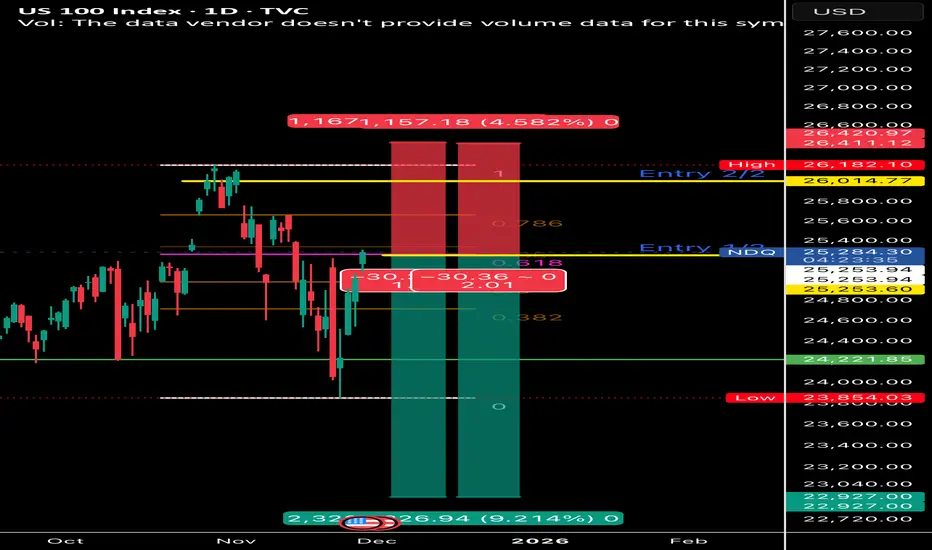
Short **Hedge** Predicting the double top on NDQ.Predicting the double top on NDQ.
I have longed a couple of assets i have been eying for a while during the correction at a good price, so this short is part of a hedging strategy I am taking.
2 entries, first (1/2) at fib 0.618 (reversed) the second (2/2) aiming for a double top.
My thought logic is like that:
If I fail to predict the double top on NDQ than my longs will most likely be much more profitable than my short.
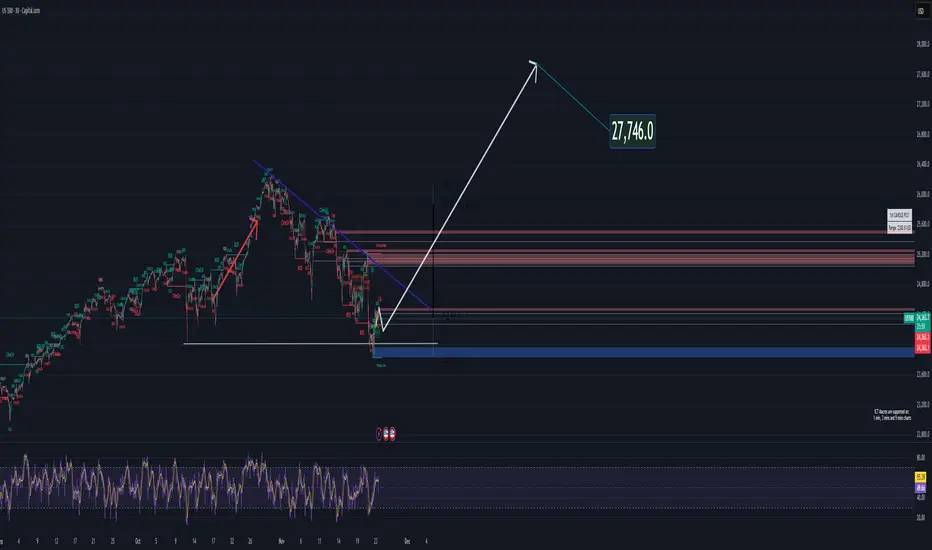
NASDAQ – Bullish Triangle Breakout LoadingI’m currently seeing a bullish ascending triangle forming on the Nasdaq indicating a strong accumulation phase before a potential breakout to the upside price has already started to bounce upward from this compression zone suggesting that buyers are taking control and preparing for a clean bullish continuation
If the breakout confirms, my target is around 27750$ aligns with
The projected target of the ascending triangle
A strong technical resistance zone
A logical extension given the current bullish structure
As long as price stays above the triangle support the bullish scenario remains the primary expectation
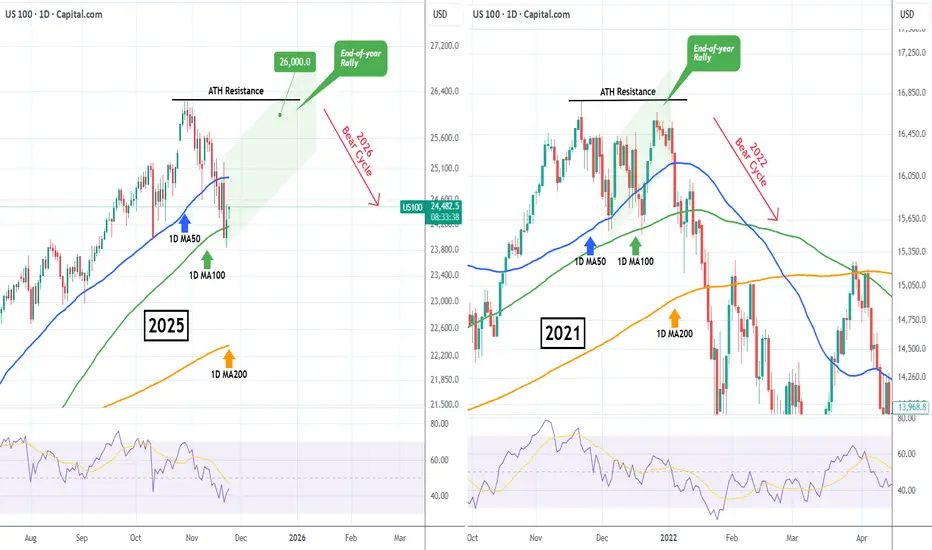
NASDAQ Santa Rally back to 26000 started?Nasdaq (NDX) rebounded on Friday after marginally breaching below its 1D MA100 (green trend-line) for the first time since May 09! The continuation today is a sign of a potentially strong rebound, the traditional end-of-year rally that is know as 'Santa's rally'.
Based on the 2021 Bull Cycle, which after touching its own 1D MA100 it started a final rally that almost tested its ATH Resistance, we can expect Nasdaq to now rise towards the end of the year to potentially 26000.
Could this be the last rally before a new Bear Cycle in 2026?
---
** Please LIKE 👍, FOLLOW ✅, SHARE 🙌 and COMMENT ✍ if you enjoy this idea! Also share your ideas and charts in the comments section below! This is best way to keep it relevant, support us, keep the content here free and allow the idea to reach as many people as possible. **
---
💸💸💸💸💸💸
👇 👇 👇 👇 👇 👇
NAS100 Trade Set Up Nov 26 2025Price remains in a bullish trend so as long as it stays closed above 1h swing low/London low i will look for internal SSL sweep to then target buys to higher BSL

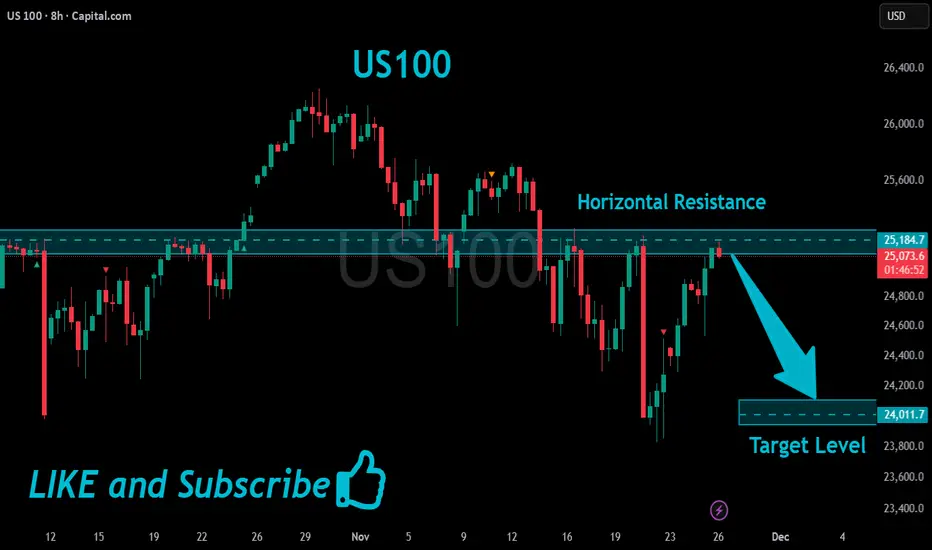
US100 Will Go Down!
HI,Traders !
#US100 already made a retest
Of the horizontal resistance
Of 25184.7 from where we
Are seeing a bearish reaction
And we will be expecting a
Further bearish move down !
Comment and subscribe to help us grow !
NAS100 Bullish Setup on 1hrNAS100 Bullish Setup on 1hr
Bullish Setup presented on 1hr
- Bullish divergence
- 1hr FVG created in this crazy sell off
- 1hr unfinished candle at my TP level
Entry: 24160
TP: 25000
SL: 23980
RR: 1:5.71

USNAS100: Key Breakdown Levels Ahead — 24150 Next?USNAS100 | Technical Overview
The Nasdaq index continues to show weakness below 24460, keeping bearish pressure dominant in the short and medium term.
Technical Outlook
As long as the price remains below the pivot line at 24460, the bearish momentum is expected to continue toward 24150.
A break below 24150 opens the door for a deeper move toward 23930.
If the market closes a 4H candle below 23930, this will confirm a stronger bearish trend targeting 23700.
On the other hand, bullish momentum will only be activated if the price closes a 1H or 4H candle above 24760, which would signal a reversal toward higher levels.
Key Levels
Pivot Line: 24460
Support: 24150 · 23930 · 23700
Resistance: 24580 · 24760 · 25200

NAS100 LONG SETUP These pair previously banged our sl with a temporary breakout of the uptrend channel. Now the price is back on the uptrend, safe entries above 25.217
