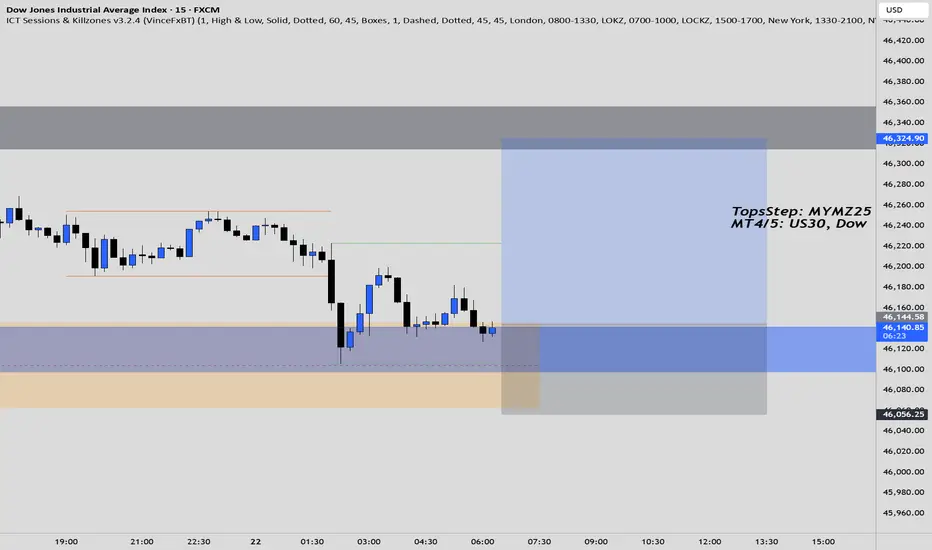
Us30 1500 Pips Securedwww.tradingview.com
price swept SSL/PDL, created 1m IFVG and CISD, retested CISD, targeted BSL to secure 1500 pips!
Trade ideas

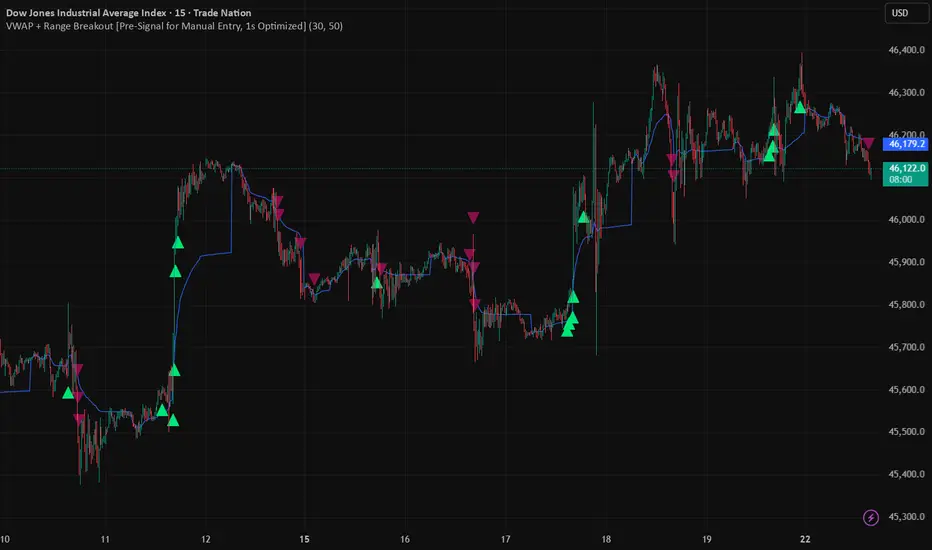
US30 NY Open | VWAP + Range Breakout Signal → Confirmed EntryWHAT THIS SHOWS
This idea highlights early pre-signals and confirmed breakout entries when price sweeps the previous day’s high or low (PDH/PDL) and aligns with VWAP and short-term range levels. Focus is on US30 around NY Open, when volume and liquidity are at peak levels.
HOW TO USE (NY OPEN FLOW)
1. Ahead of NY Open, mark PDH/PDL and watch how price builds a short-term range.
2. Best setups occur after liquidity is swept (PDH/PDL taken). Look for a pre-signal (early warning), then confirmation when a bar closes above/below the range and VWAP in the direction of trend.
3. Apply filters: SMA trend filter to stay aligned with bias; session filter to focus on London/NY hours.
4. Manage risk with stops beyond range edges or confirmation candle; partials at key intraday levels.
SETTINGS TIPS
Range Lookback → shorter for fast intraday charts, longer for higher TF.
SMA length → adapt to fit your bias framework.
Session filter → on for London/NY, off for continuous monitoring.
NOTES
Educational demonstration only. No financial advice.
For advanced versions with extra confirmations and filters → see my profile signature.
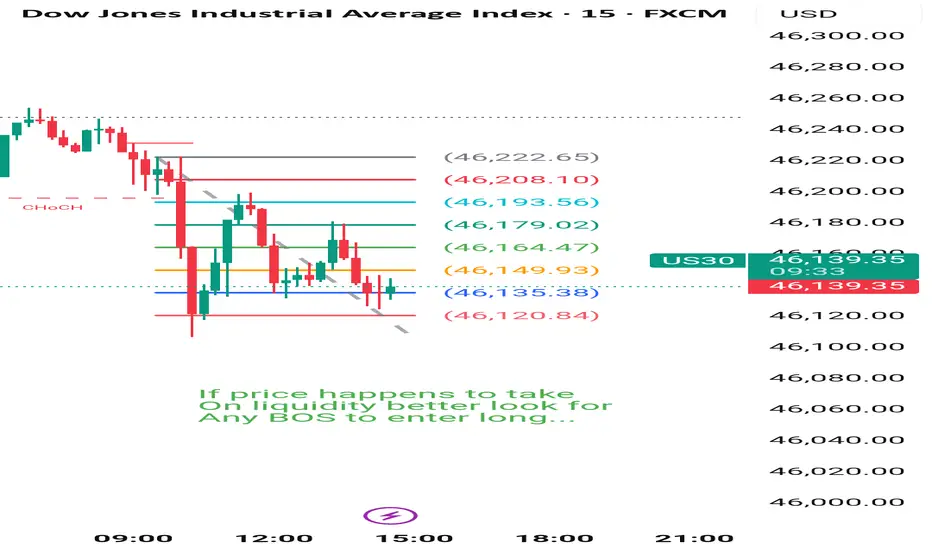
Us30 Trade Set Up Sep 22 www.tradingview.com
price is making LH/LL so overall it is bearish but it is approaching PDL so if price sweeps it and closes above i will look for a reversal IFVG on the 1m-2m to target the 4h FVG before looking for sells back down

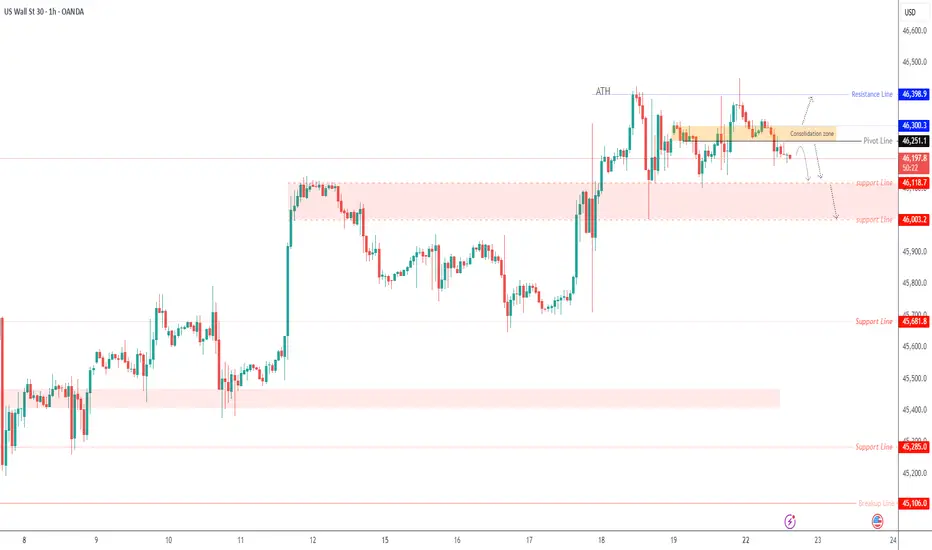
US30 – Key Pivot Zone Signals Next MoveUS30 – Overview
The Dow Jones remains under bearish momentum while trading below the 46,250 – 46,300 pivot zone, keeping pressure toward key supports.
📉 Bearish Scenario
Price targets a move toward 46,120 as long as it stays below 46,250 – 46,300.
🔻 A confirmed 1H close below 46,120 would strengthen the bearish trend, opening the path to 46,000.
📈 Bullish Scenario
If price pushes higher and achieves a 1H close above 46,300, bullish momentum would return, with upside targets at 46,400 and beyond.
Key Levels
Pivot: 46,250
Resistance: 46,300 – 46,400
Support: 46,120 – 46,000
US30 Day-trading Day 001Here we see price has been falling since the beginning of the day.
We can enter a short position on the
fib level ( .75 / .625 )
It all depends on your risk reward ratio.
Here price may also reverse only by targeting liquidity seen almost at the daily high.
Patience is key.
Lets wait for NY session where we may be able to have a clear confirmation of today's session.
US30 LongElite Analysis
Discretionary Trade with Confirmations
Targeting Structural liquidity at the top
US30 BEARISH SETUP After breaking into a new level, price managed to find resistance and made couple of attempts to break it but failed. A fall back to previously broken level is anticipated to test it as new support

[Short] Dow 30 (September 21, 2025)Entry: 46256.15
SL: 46288.65
TP: 46191.15
Trying another strategy what I found.
Backtest was done.
Live trade is on.

This may turn down soonThis channel is not providing individualized trading or investment advice, nor is it a banking service, brokerage service, trading service, investment service or money management service

Dow Jones - US30: Trading Edge TodayDear Friends in Trading,
Experimental Test Phase Week:
Correlation Logic & Daily Efficiency - GOLD🔄NASDAQ🔄DOW JONES
🔎 Previous Week Observations -
Price built a volume base / cluster around 45,950 – 46,050 last week (multiple rotations here).
Breakout rallies on the 18th and 19th pushed price above 46,200, which is now acting as resistance/acceptance.
Current level (~46,273) is sitting right at this balance edge.
🎯US30 - 22Sept:
Pivot Area: 46,000 ± 50
Bias: Neutral-Bullish above pivot
Bull targets: 46,400 → 46,600
Bear targets: 45,800 → 45,600
👉 Gold and indices are inversely correlated intraday; if one pivots, the other confirms.
Dow showing slower but steady grind.
Needs >46,400 to confirm breakout continuation.
I sincerely hope my point of view offers a valued insight.
Thank you for taking the time study my analysis.
US 100Dow Jones ( DJI )
- Completed " 123 " Impulsive Waves
- Break of Structure
- Change of Characteristics
- Bullish Channel as an corrective pattern in Short Time Frame and Long Time Frame
- Resistance Level

US30We looking for bullish momentum as we still inside the uptrend which results in bullish opportunities as long we are still inside the bullish trend| 1H Timeframe

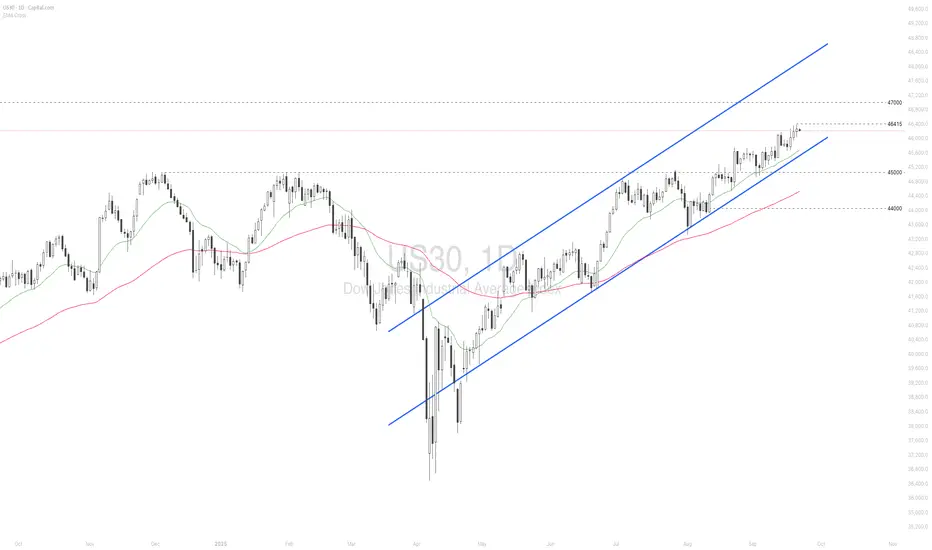
US30 hits new all-time high amid robust AI fever
US equities rallied to fresh record highs, fueled by the Fed’s rate cut, resilient US economic data, and optimism over progress in US-China trade negotiations. Ongoing enthusiasm for AI also boosted technology stocks.
Nvidia (NVDA) drove the strongest market reaction after announcing a \$5 bln purchase of more than 4% of Intel (INTC). Sentiment was further buoyed by reports that Chinese regulators halted their antitrust probe into Google (GOOGL), ending a long-running investigation into Android’s dominance.
US30 maintained a solid uptrend within the ascending channel, setting a new high. The index holds above both EMAs, indicating the potential continuation of the bullish momentum. If US30 breaches above the 46415 high, the index may gain upward momentum toward the psychological resistance at 47000. Conversely, if US30 breaks below EMA21 and the channel’s lower bound, the index could retreat toward 45000.
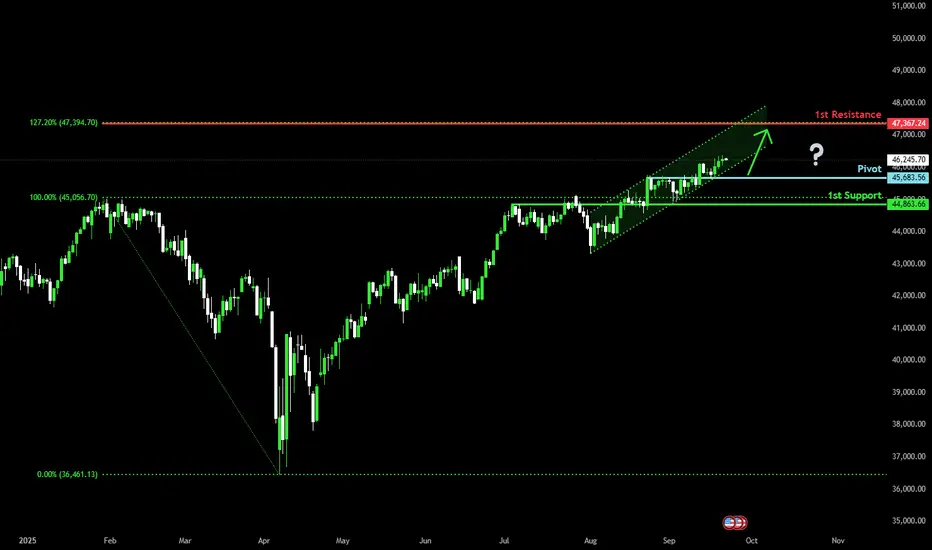
Bullish momentum to extend?Dow Jones (US30) is falling towards the pivot and oculd bounce to the 1st resistance.
Pivot: 45,683.56
1st Support: 44,863.66
1st Resistance: 47,367.24
Disclaimer:
The above opinions given constitute general market commentary, and do not constitute the opinion or advice of IC Markets or any form of personal or investment advice.
Any opinions, news, research, analyses, prices, other information, or links to third-party sites contained on this website are provided on an "as-is" basis, are intended only to be informative, is not an advice nor a recommendation, nor research, or a record of our trading prices, or an offer of, or solicitation for a transaction in any financial instrument and thus should not be treated as such. The information provided does not involve any specific investment objectives, financial situation and needs of any specific person who may receive it. Please be aware, that past performance is not a reliable indicator of future performance and/or results. Past Performance or Forward-looking scenarios based upon the reasonable beliefs of the third-party provider are not a guarantee of future performance. Actual results may differ materially from those anticipated in forward-looking or past performance statements. IC Markets makes no representation or warranty and assumes no liability as to the accuracy or completeness of the information provided, nor any loss arising from any investment based on a recommendation, forecast or any information supplied by any third-party.
US30Success in forex and stocks comes from a combination of knowledge, discipline, and patience. Understanding market trends, economic factors, and company
fundamentals is crucial, but equally important is controlling emotions and sticking to a well-planned strategy. Continuous learning, adapting to changing conditions, and managing risk wisely can turn opportunities into consistent growth over time.
Consistency, not luck, separates successful traders from the rest.

uptrend It is expected that the resistance area will be broken and the continuation of the upward trend will be formed and will continue until the specified Fibonacci levels.
If the support area is broken, a continuation of the downtrend is possible.

US30 - Bullish Path Toward 48,000The market remains strongly bullish with no clear signs of correction, even in lower timeframes.
Active targets are 46,550, 47,300 (key level), and 47,690, with the next major target at 48,000.
Beyond this, 48,920 has also been identified as a potential extension.
While higher targets exist, they belong to a larger fractal and are not yet confirmed.
The deepest possible correction could reach the 45,300 area, which may provide a good long opportunity.
Short positions are not recommended due to high risk and strong buying pressure.

US30US30 needs a small drop and another push up towards 46.5K level.
Disclosure: We are part of Trade Nation's Influencer program and receive a monthly fee for using their TradingView charts in our analysis.

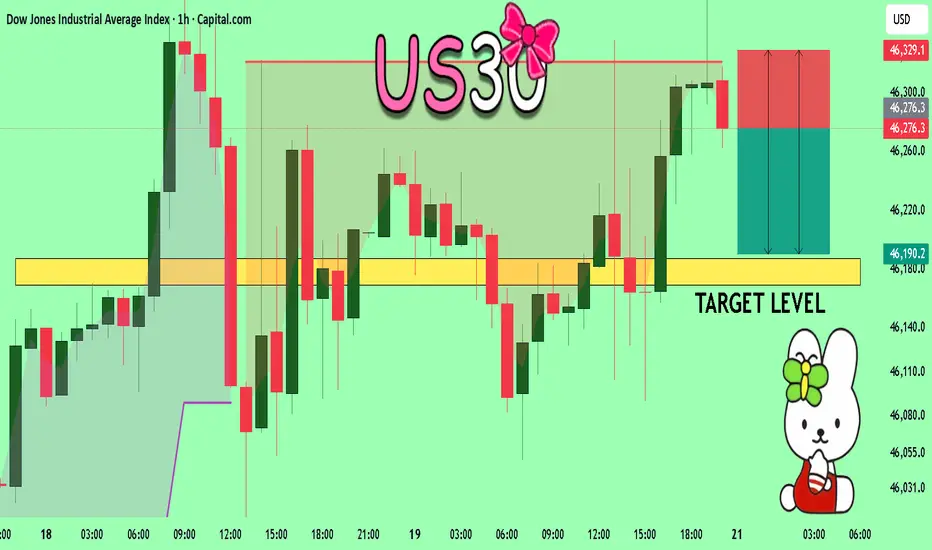
US30 Will Collapse! SELL!
My dear friends,
My technical analysis for US30 is below:
The market is trading on 46276 pivot level.
Bias - Bearish
Technical Indicators: Both Super Trend & Pivot HL indicate a highly probable Bearish continuation.
Target - 46187
Recommended Stop Loss - 46329
About Used Indicators:
A pivot point is a technical analysis indicator, or calculations, used to determine the overall trend of the market over different time frames.
Disclosure: I am part of Trade Nation's Influencer program and receive a monthly fee for using their TradingView charts in my analysis.
———————————
WISH YOU ALL LUCK
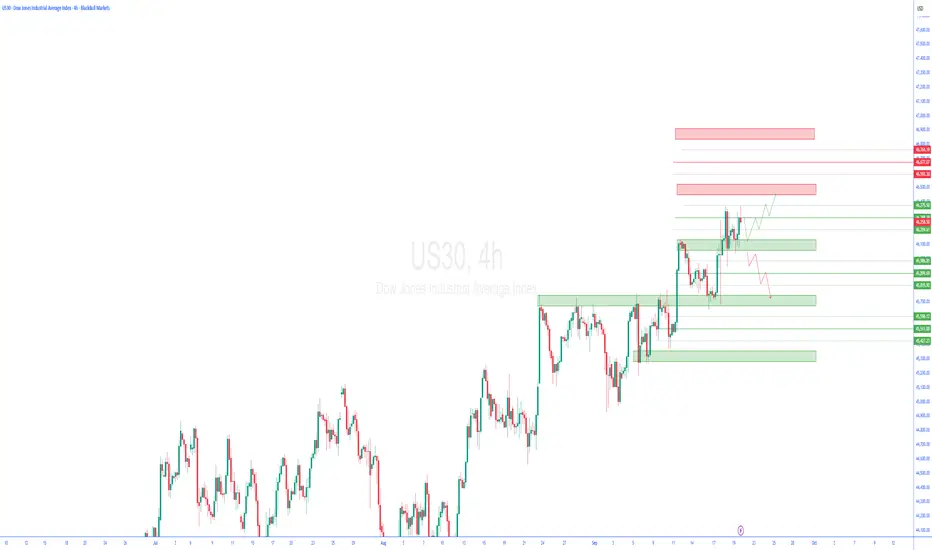
us30 4hTrading Perspectives for the Upcoming Week
In this series of analyses, we have reviewed short-term trading perspectives and outlooks.
As can be seen, in each analysis there is a significant support/resistance zone near the current asset price. The market’s reaction to or break of this level will determine the future price trend up to the next specified levels.
Important Note: The purpose of these trading perspectives is to examine key price levels and the market’s potential reactions to them. The analyses provided are by no means trading signals!
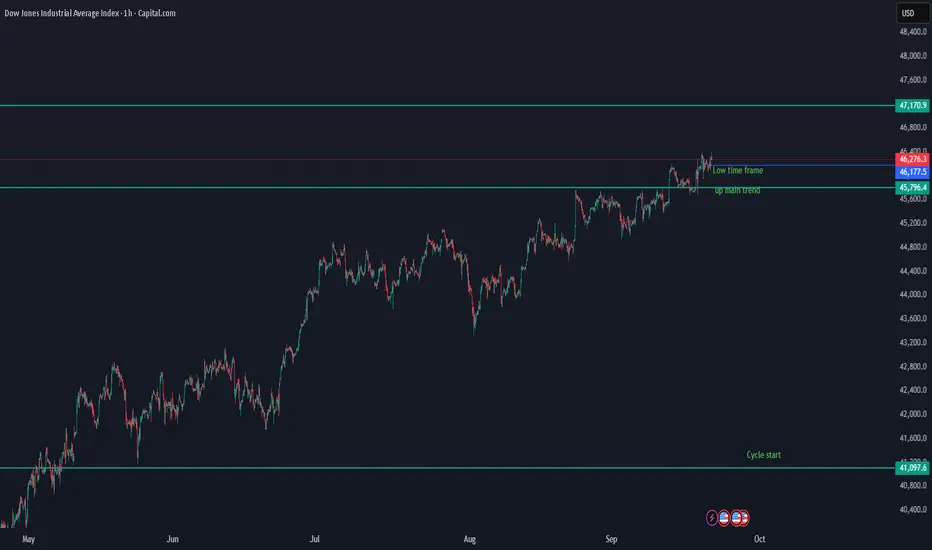
Key Levels & Trend Confirmation – US30US30 Update
We use advanced data that counts the start of the cycle and all important key levels.
On the low time frame, US30 is holding above the breakout zone (46,177 – 46,214), showing early signs of continuation.
Key levels:
46,214 → first support on the low time frame. Holding this level keeps bullish momentum intact.
46,177 → important confirmation level for the main uptrend. If US30 closes below this, it could trigger a deeper pullback.
As long as price holds above these zones, US30 remains in a bullish structure with potential to push higher.
Downside risk: A breakdown below 46,177 would invalidate the current momentum and open space for correction toward 45,796 support.
Major cycle level: 41,097 remains the cycle start and must-hold support in the bigger picture. Losing this level would shift the cycle to red.
📌 Summary
Above 46,214 – 46,177 → bullish continuation remains in play.
Break below 46,177 → correction risk, watch 45,796 as next support.
Cycle start at 41,097 → key long-term level to keep the broader bullish cycle alive.
US30: Short Signal Explained
US30
- Classic bearish formation
- Our team expects pullback
SUGGESTED TRADE:
Swing Trade
Short US30
Entry - 46276
Sl - 46316
Tp - 46203
Our Risk - 1%
Start protection of your profits from lower levels
Disclosure: I am part of Trade Nation's Influencer program and receive a monthly fee for using their TradingView charts in my analysis.
❤️ Please, support our work with like & comment! ❤️
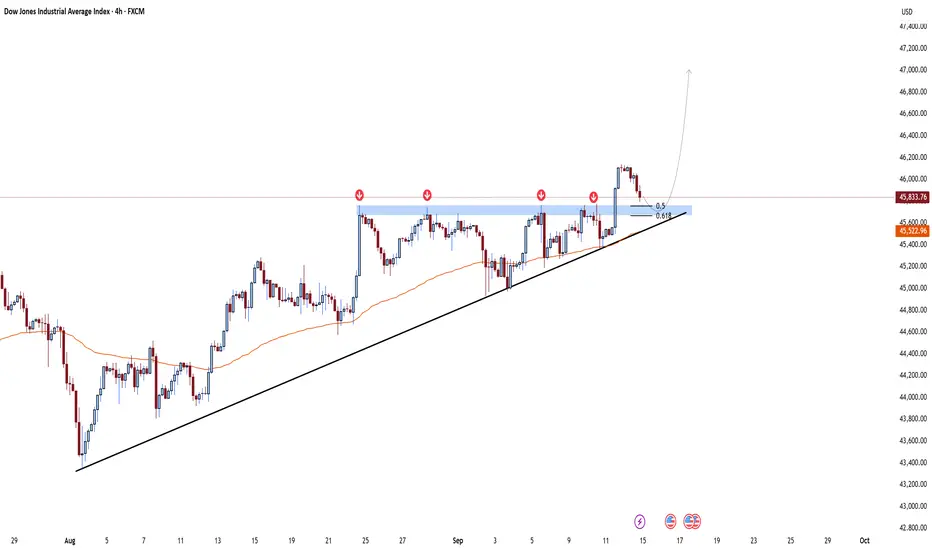
US30 4H📊 Dow Jones (4H) Analysis
The Dow just broke through the 45,700 resistance and is now pulling back to retest that same level as support.
✅ Key points:
The 45,700 zone, which acted as resistance before, could flip into strong support now.
Fibonacci retracements (0.5 & 0.618) line up right in this area, adding more confluence.
The ascending trendline and moving average are also sitting below price, keeping the bullish structure intact.
🎯 Targets:
Short-term: 46,200 – 46,400
Medium-term (measured move from the ascending triangle): 47,000 – 47,200
⚠️ Invalidation:
If price loses the 45,500 – 45,600 zone, we could see a deeper correction back to 45,000 – 45,200.
---
📌 Summary:
As long as the pullback into 45,700 holds, the bullish scenario stays in play and higher targets remain on the table.
---
🔥 What do you think? Is this just a clean retest before a push to 47,200, or will the Dow drop back below support?