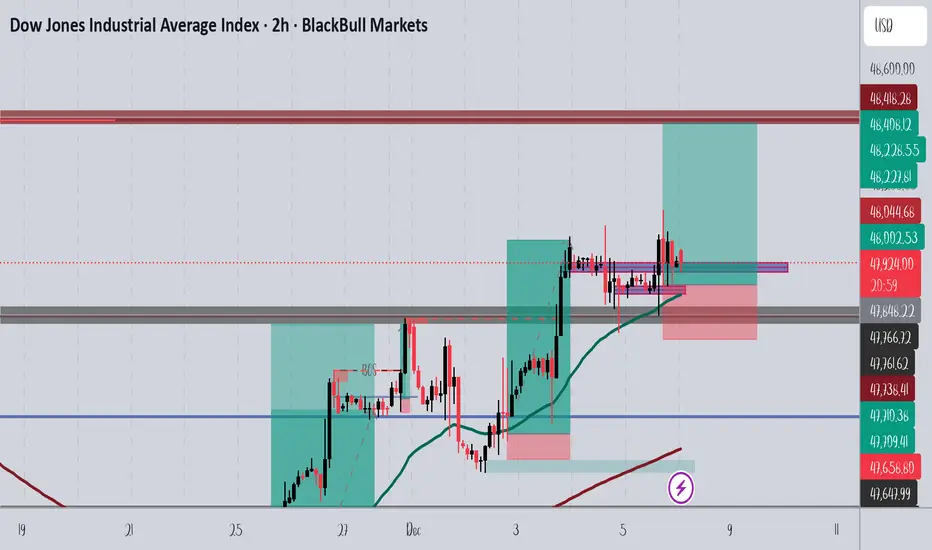
US30 -2HR SetupPrice is holding above the demand zone after a clean break of structure. As long as this level is maintained, bullish continuation toward the next resistance remains in play.
Trade ideas
Dow Jones (US30) a break of 47,759 will confirm downside momentu
The rally was sold in the dip was bought, resulting in a doji-style candle being posted at the high. This highlights investor indecision at current levels.
Big Picture analysis suggests we are currently trading within the BC leg of a Butterfly formation. This pattern will be invalidated on a move through the previous swing high of 48,460. Formation will be completed on a move to 43,946.
The trend of higher highs and the previous change of structure is located at 47,759.
It should be noted that the US2000 has just hit a 261.8% extension level
Conclusion: the value trade is to the downside. A break of 47,759 will confirm downside momentum. (edited)Friday, 5 December 2025 06:45

US30 Short Bias | Resistance Rejection SetupUS30 is showing bearish pressure near the 48,000 zone, which is acting as a short-term resistance area. Price rejection from higher levels suggests weakening bullish momentum and potential continuation to the downside. Lower highs on the intraday timeframe indicate sellers are in control.
Trade Plan:
As long as price remains below 48,050, the bearish setup stays valid. A move toward 47,200 is expected if selling pressure continues. Trail stop once price moves in profit to secure gains.
KEY LEVELS
Entry 48,000
Target 47,200
Stop Lose 48,050

Bullish continuation setup?Dow Jones (US30) is reacting off the pivot and could bounce to the 1st resistance which is a swing high resistance.
Pivot: 47,730.53
1st Support: 47,204.31
1st Resistance: 48,435.66
Disclaimer:
The opinions given above constitute general market commentary and do not constitute the opinion or advice of IC Markets or any form of personal or investment advice.
Any opinions, news, research, analyses, prices, other information, or links to third-party sites contained on this website are provided on an "as-is" basis, are intended to be informative only, and are not advice, a recommendation, research, a record of our trading prices, an offer of, or solicitation for, a transaction in any financial instrument and thus should not be treated as such. The information provided does not involve any specific investment objectives, financial situation, or needs of any specific person who may receive it. Please be aware that past performance is not a reliable indicator of future performance and/or results. Past performance or forward-looking scenarios based upon the reasonable beliefs of the third-party provider are not a guarantee of future performance. Actual results may differ materially from those anticipated in forward-looking or past performance statements. IC Markets makes no representation or warranty and assumes no liability as to the accuracy or completeness of the information provided, nor any loss arising from any investment based on a recommendation, forecast, or any information supplied by any third party.

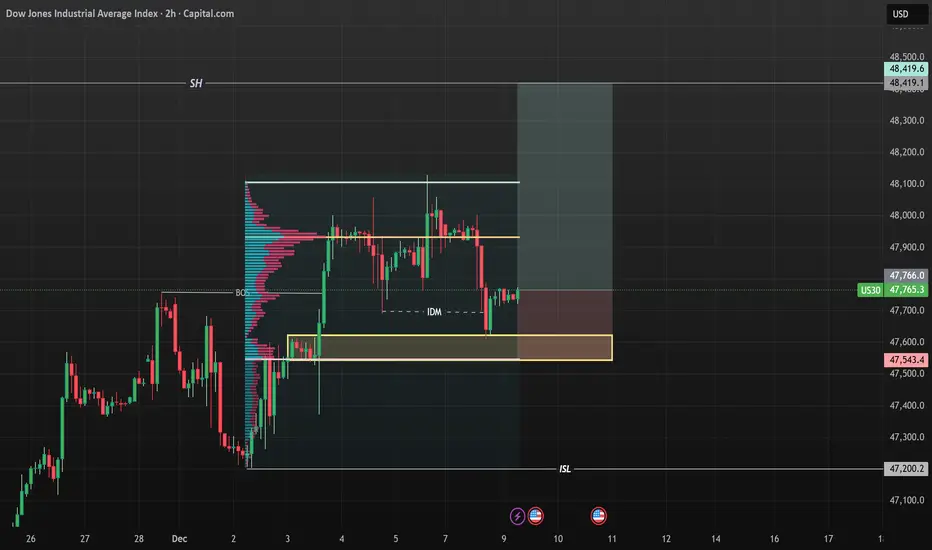
US30 BUY NOW!!!!!!!US30 take out the recent previous internal structure high and made an inducement with a proper price rejections off the demand zone am looking forward to see price maintain a bullish bias moves till price arrives 48,419....
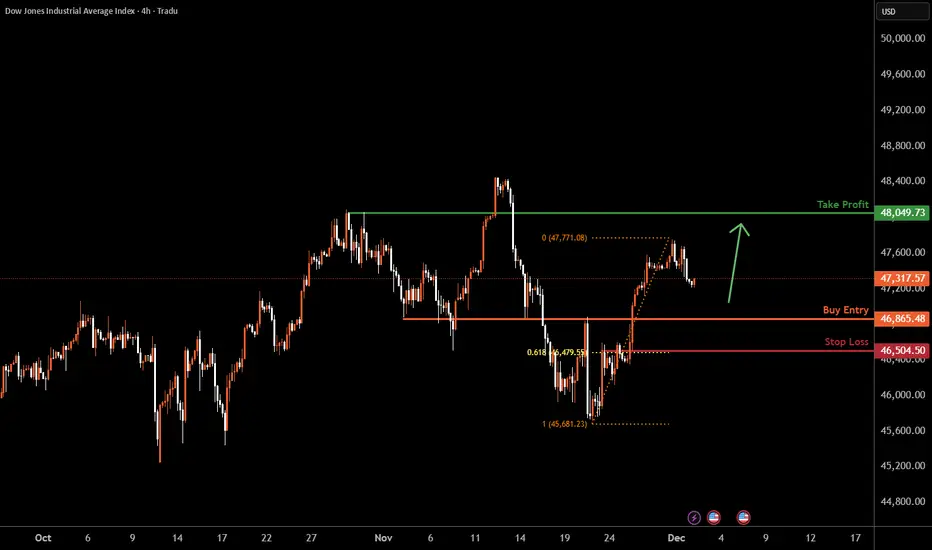
US30 H4 | Falling Towards Key SupportMomentum: Bullish
Price is pulling back toward our buy entry, which has been identified as an overlap support zone.
Buy Entry: 46,865.48
Strong overlap support
Stop Loss: 46,504.50
Pullback support
61.8% Fibonacci retracement
Take Profit: 48,049.73
Pullback resistance
High Risk Investment Warning
Stratos Markets Limited (tradu.com ), Stratos Europe Ltd (tradu.com ):
CFDs are complex instruments and come with a high risk of losing money rapidly due to leverage. 70% of retail investor accounts lose money when trading CFDs with this provider. You should consider whether you understand how CFDs work and whether you can afford to take the high risk of losing your money.
Stratos Global LLC (tradu.com ): Losses can exceed deposits.
Please be advised that the information presented on TradingView is provided to Tradu (‘Company’, ‘we’) by a third-party provider (‘TFA Global Pte Ltd’). Please be reminded that you are solely responsible for the trading decisions on your account. Any information and/or content is intended entirely for research, educational and informational purposes only and does not constitute investment or consultation advice or investment strategy. The information is not tailored to the investment needs of any specific person and therefore does not involve a consideration of any of the investment objectives, financial situation or needs of any viewer that may receive it. Past performance is not a reliable indicator of future results. Actual results may differ materially from those anticipated in forward-looking or past performance statements. We assume no liability as to the accuracy or completeness of any of the information and/or content provided herein and the Company cannot be held responsible for any omission, mistake nor for any loss or damage including without limitation to any loss of profit which may arise from reliance on any information supplied by TFA Global Pte Ltd.
US30 reflected by the upper bandIn my opinion, the upper band will reflect US30 and will go down to the lower one.
If the lower is crossed, expect more bearish.
The US 30 could stay more days between this interval - expected end of the week.

DJI: Dow jones industrial index bear trend in makingDue to divergence on RSI and MCAD, the price will have a pull back as showed. its simple but i think it will follow my idea

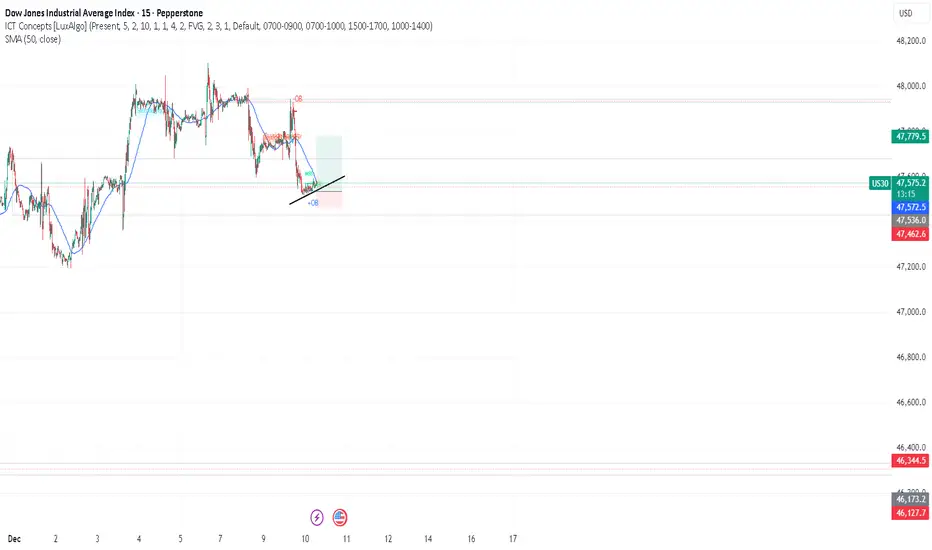
US30 Trade Set Up Dec 11 2025Price is making HH/HL so now in a bullish trend but it currently at a supply and approaching PDH so if it sweeps it i will look for internal IFVG/CISD to target Asia lows before continuing a bullish trend but if price closes above PDH price can go higher to BSL and higher supply

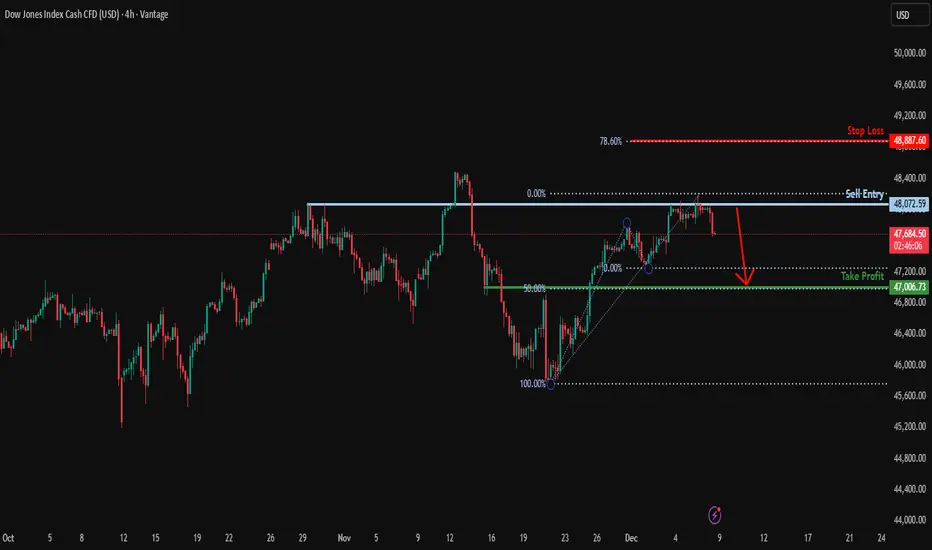
Could we see a reversal from here?NAS100 has rejected off the resistance level, which is a pullback resistance and could potentially drop from this level to our take profit.
Entry: 48,072.59
Why we like it:
There is a pullback resistance level.
Stop loss: 48,887.60
Why we like it:
There is a resistance level at the 78.6% Fibonacci projection.
Take profit: 47,006.73
Why we like it:
There is a pullback support that aligns with the 50% Fibonacci retracement.
Enjoying your TradingView experience? Review us!
Please be advised that the information presented on TradingView is provided to Vantage (‘Vantage Global Limited’, ‘we’) by a third-party provider (‘Everest Fortune Group’). Please be reminded that you are solely responsible for the trading decisions on your account. There is a very high degree of risk involved in trading. Any information and/or content is intended entirely for research, educational and informational purposes only and does not constitute investment or consultation advice or investment strategy. The information is not tailored to the investment needs of any specific person and therefore does not involve a consideration of any of the investment objectives, financial situation or needs of any viewer that may receive it. Kindly also note that past performance is not a reliable indicator of future results. Actual results may differ materially from those anticipated in forward-looking or past performance statements. We assume no liability as to the accuracy or completeness of any of the information and/or content provided herein and the Company cannot be held responsible for any omission, mistake nor for any loss or damage including without limitation to any loss of profit which may arise from reliance on any information supplied by Everest Fortune Group.
DOW/US30 - BEAUTIFUL CHART Team, I am looking at the US30/DOW - whatever you call it
look beautiful on the 5/15 minutes channel
Sorry, i been too lazy to post because lately I've been doing scalping
I am about to prove another challenge where $1000 turns into a million
Last account $1000 turned into 100k, took 6 months
But this challenge, I am not sure.
Anyway lets focus on the trade right now
the price is 47590-99 - long entry
STOP LOSS at 47550
Target 1 at 47650-47666
Target 2 at 47701-47715
Target 3 at 47760-47781
LETS GO
DowJones Key support at 47530 Key Support and Resistance Levels
Resistance Level 1: 48132
Resistance Level 2: 48276
Resistance Level 3: 48420
Support Level 1: 47530
Support Level 2: 47366
Support Level 3: 47185
This communication is for informational purposes only and should not be viewed as any form of recommendation as to a particular course of action or as investment advice. It is not intended as an offer or solicitation for the purchase or sale of any financial instrument or as an official confirmation of any transaction. Opinions, estimates and assumptions expressed herein are made as of the date of this communication and are subject to change without notice. This communication has been prepared based upon information, including market prices, data and other information, believed to be reliable; however, Trade Nation does not warrant its completeness or accuracy. All market prices and market data contained in or attached to this communication are indicative and subject to change without notice.

US30 patienceSells? This is a setup I tend to look for. As I explained in my previous post. I look for clear direction obvious pull back and a continue in that direction. I'm watching this on a 30min TF. I'm still waiting on confirmation of continuation even if its 600 points. It's already touched 3 quarter levels since 5AM. If I get in for sells my first target it 47,625.

US30 Trade Set Up Dec 8 2025Price is currently in a 1h range so first i want to see either a sweep of SSL/Asia and London lows to then look for 1m-5m IFVG/CISD to target BSL and supply

DowJones Bullish above support at 47530 Key Support and Resistance Levels
Resistance Level 1: 48132
Resistance Level 2: 48276
Resistance Level 3: 48420
Support Level 1: 47530
Support Level 2: 47366
Support Level 3: 47185
This communication is for informational purposes only and should not be viewed as any form of recommendation as to a particular course of action or as investment advice. It is not intended as an offer or solicitation for the purchase or sale of any financial instrument or as an official confirmation of any transaction. Opinions, estimates and assumptions expressed herein are made as of the date of this communication and are subject to change without notice. This communication has been prepared based upon information, including market prices, data and other information, believed to be reliable; however, Trade Nation does not warrant its completeness or accuracy. All market prices and market data contained in or attached to this communication are indicative and subject to change without notice.

US30 Trade Set Up Dec 5 2025Price has shifted to bearish structure failing to close higher and now making LL/LH with SSL and Daily FVGs below to target so first i want to see internal 5m-15m bearish structure to continue lower

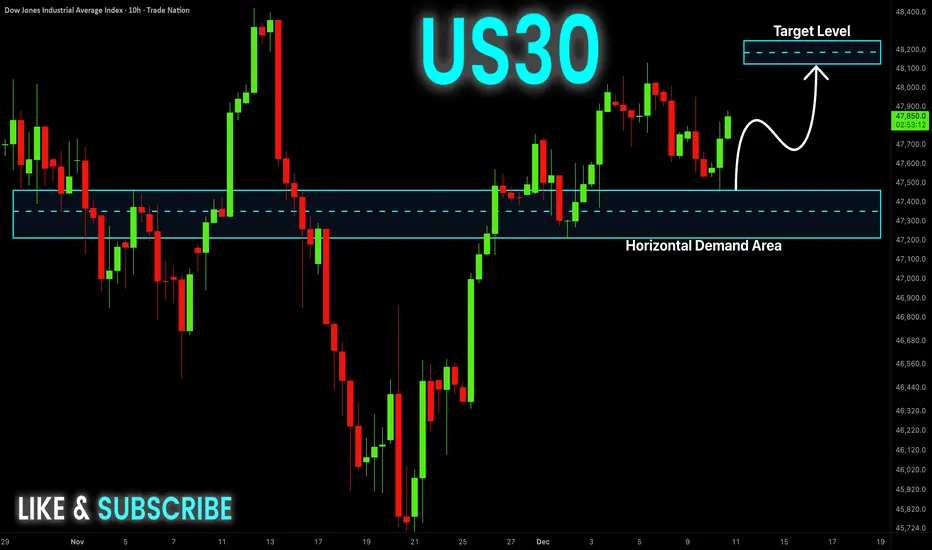
US30 Will Go UP! Buy!
Hello,Traders!
US30 has rebounded cleanly from the horizontal demand area after sweeping sell-side liquidity, confirming an SMC accumulation reaction that shifts order-flow bullish and draws price toward the next buy-side target above. Time Frame 10H.
Buy!
Comment and subscribe to help us grow!
Check out other forecasts below too!
Disclosure: I am part of Trade Nation's Influencer program and receive a monthly fee for using their TradingView charts in my analysis.
SHORT ON US30Us30 has created a head and shoulder pattern at a major supply area/zone.
FOMC is coming out in a few minutes and this could be a major catalyst to US30 falling.
Strictly going off technical's with the chart. Looking to make 1k-2k points.

DowJones key support at 47530Key Support and Resistance Levels
Resistance Level 1: 48132
Resistance Level 2: 48276
Resistance Level 3: 48420
Support Level 1: 47530
Support Level 2: 47366
Support Level 3: 47185
This communication is for informational purposes only and should not be viewed as any form of recommendation as to a particular course of action or as investment advice. It is not intended as an offer or solicitation for the purchase or sale of any financial instrument or as an official confirmation of any transaction. Opinions, estimates and assumptions expressed herein are made as of the date of this communication and are subject to change without notice. This communication has been prepared based upon information, including market prices, data and other information, believed to be reliable; however, Trade Nation does not warrant its completeness or accuracy. All market prices and market data contained in or attached to this communication are indicative and subject to change without notice.

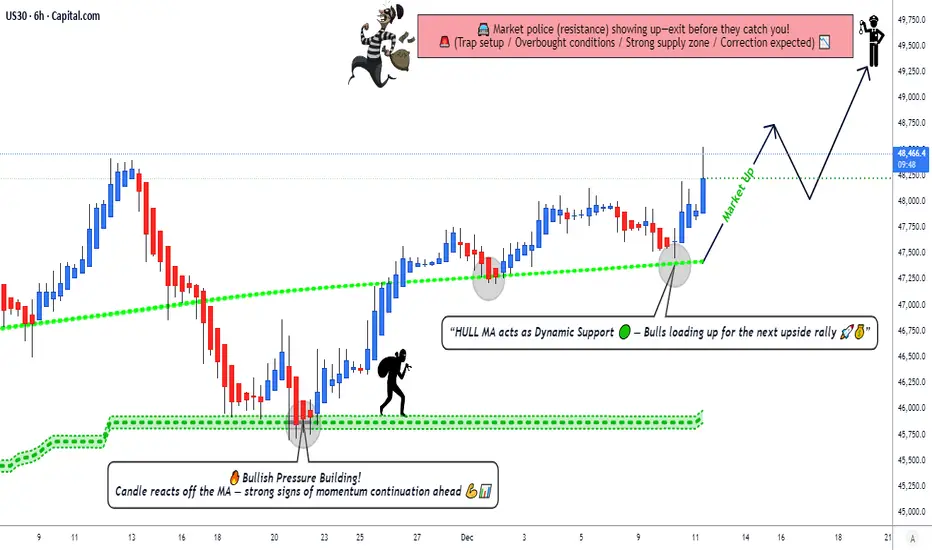
US30 Momentum Rebuild: Breakout Retest Signals Potential Upside📈 DJI30 / US30 – Dow Jones Industrial Average Trade Opportunity Guide
🏛️ Market Context
The index is showing strong accumulation pressure, with buyers stepping back in as volatility narrows. Momentum tools and trend metrics continue to lean toward the upside, creating a setup where disciplined layering becomes highly effective for precision entries.
🔥 Trade Plan – Bullish Strategy in Play
✅ Technical Confirmation
KIJUN MA accumulation indicates steady buy-side pressure building beneath price.
HULL Moving Average breakout completed with a clean pullback + retest, confirming trend continuation strength.
Market structure remains constructive with higher lows forming consistently.
🎯 Entry Plan (Layering Method Included)
Any price level can be used, but this plan uses Thief Layering Strategy for controlled scaling:
💠 Buy Limit Layers:
47,000
47,250
47,500
47,750
48,000
(Traders can add more layers depending on personal risk and capital allocation style.)
🛡️ Stop Loss (SL)
Thief SL → 46,750
Dear Ladies & Gentlemen (Thief OGs): Please adjust according to personal strategy and risk. This SL is an example, not a fixed rule. Trade with your own management principles.
🎯 Target (TP)
Main Target → 49,500
The market is approaching major moving-average resistance + overbought zones + potential trap regions. It’s wise to secure profits as the index reaches upper supply levels.
Again, Ladies & Gentlemen (Thief OGs): TP is flexible. Manage your profit bookings based on your personal approach.
🌍 Related Pairs to Watch & Correlations
1️⃣ SP:SPX / S&P 500
Often moves in high correlation with US30.
Strong bullish momentum here typically supports US30 upside.
Watch for divergence → if SPX stalls while US30 pushes, upside may weaken.
2️⃣ NASDAQ:NDX / NAS100 (Nasdaq 100)
Tracks tech sentiment, which influences overall US risk appetite.
If NAS100 shows weakness while Dow is rising, expect mixed flows → Dow may slow down but still hold structure.
3️⃣ TVC:VIX (Volatility Index)
Inverse correlation to US30.
Falling VIX = stronger risk-on behavior, supporting bullish Dow positions.
Sudden VIX spikes signal caution on existing long positions.
4️⃣ TVC:DXY (US Dollar Index)
Strong Dollar sometimes suppresses equity momentum.
If DXY drops, US30 tends to gain strength as liquidity flows to equities.
5️⃣ CBOT_MINI:YM1! (Dow Futures)
The closest real-time mirror of US30 price action.
Useful for re-entry timing during pullbacks and session gaps.
🧭 Final Notes
Stay disciplined with your own SL/TP logic, manage exposure through layered entries, and monitor correlation assets for confirmation. This is a flexible play designed for DAY & Swing traders who thrive in momentum-driven environments.
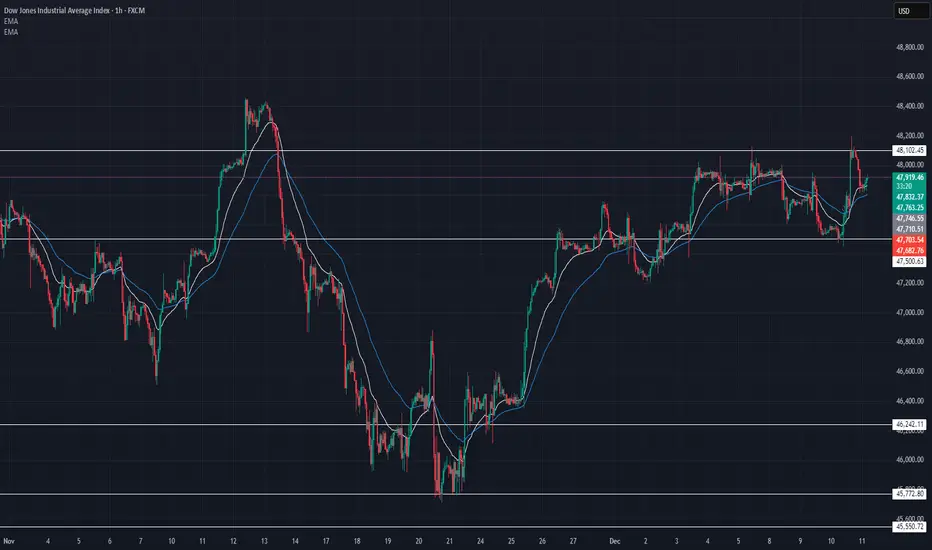
US30 Technical Breakdown – 12/11/2025📍 US30 Technical Breakdown – 12/11/2025
US30 rejected sharply from the 48,100–48,200 resistance zone, creating a clean wick rejection before pulling back into the mid-range. Despite the selloff, the broader structure remains bullish as long as price holds above 47,700, but momentum has clearly cooled with EMAs flattening out 🔍📉.
📊 Market Behavior:
🔹 Strong rejection from 48,150 — sellers defending heavy supply
🔹 EMAs tightening → momentum slowing after the push
🔹 Price stuck in a wide consolidation between 47,700–48,150
🔹 Bulls still defending higher-timeframe structure
📌 Key Levels:
🔹 Resistance:
48,150 → major supply / rejection zone
48,000 → intraday reaction level
47,930 → current retest zone
🔹 Support:
47,700 → immediate support (key for trend continuation)
47,500 → deeper intraday demand
46,960 → strong structural support if market breaks down
🧠 Bias:
Neutral-to-bullish above 47,700 📈
📈 Break & close above 48,150 → opens path to 48,300 → 48,500
📉 Lose 47,700 → downside opens toward 47,500 → 47,000
💡 Trade Ideas:
🔹 Bullish Setup:
Entry: 48,020 (break + retest above resistance)
TP1: 48,180
TP2: 48,320
SL: 47,820
🔹 Bearish Setup:
Entry: 47,680 (loss of support)
TP1: 47,500
TP2: 47,300
SL: 47,850
🎯 Summary:
US30 rejected the 48,100 resistance zone and is now rotating back toward support. Bulls remain in control on the higher timeframe, but short-term momentum has slowed. Watch 47,700 closely — hold = continuation, break = correction 🔥📊
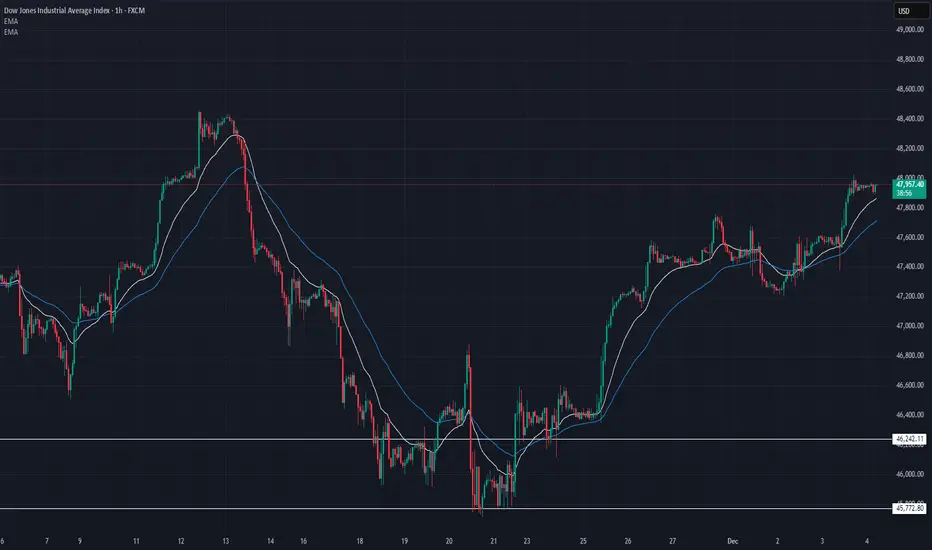
US30 Technical Breakdown – 12/04/2025📍 US30 Technical Breakdown – 12/04/2025
US30 pushed back into the 47,950–48,000 resistance zone after a clean trend continuation, with price now stalling near the highs. Bulls remain firmly in control as EMAs continue to slope upward, but momentum is slowing as we approach a major supply area 🔍📈.
📊 Market Behavior:
🔹 Strong push into 48,000 → buyers testing major resistance
🔹 EMAs wide + rising → bullish momentum still intact
🔹 Small consolidation forming → early signs of exhaustion
🔹 Higher lows consistently defended → bulls still holding structure
📌 Key Levels:
🔹 Resistance:
48,000 → major psychological level + current rejection
47,955 → intraday supply (current stall zone)
47,780 → key prior breakout level
🔹 Support:
47,720 → immediate intraday support
47,560 → secondary support / EMA zone
46,960 → deeper demand if trend breaks
🧠 Bias:
Bullish while above 47,720 📈
📈 Break & hold above 48,000 → continuation toward 48,200 → 48,350
📉 Break below 47,720 → opens path to 47,560 → 47,300
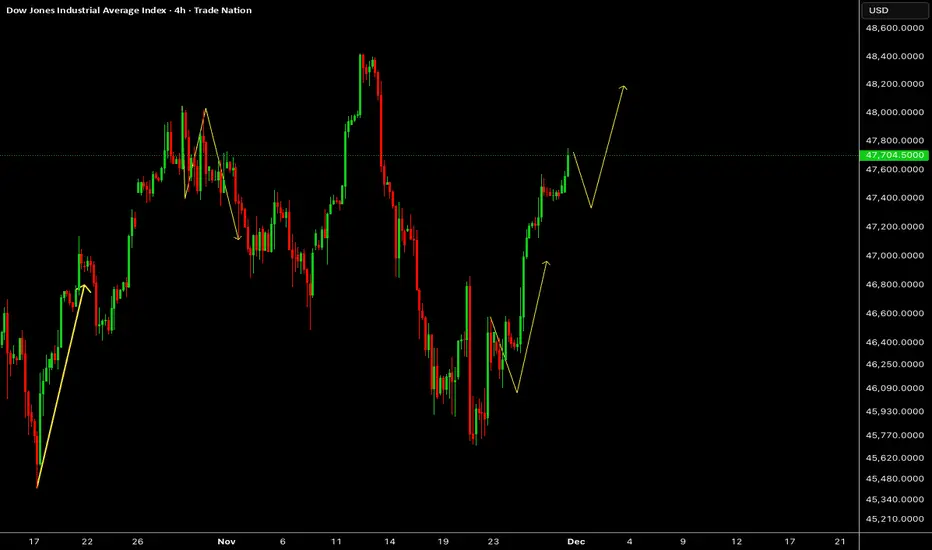
US30 : Bullish Continuation SetupThe Dow Jones Index continues to climb steadily on the 4-hour timeframe, with recent momentum reinforcing a constructive bullish sequence. Price action is shaping a potential continuation phase heading into December, as market sentiment remains supportive following the recent recovery leg.
Disclosure: We are part of Trade Nation's Influencer program and receive a monthly fee for using their TradingView charts in our analysis.