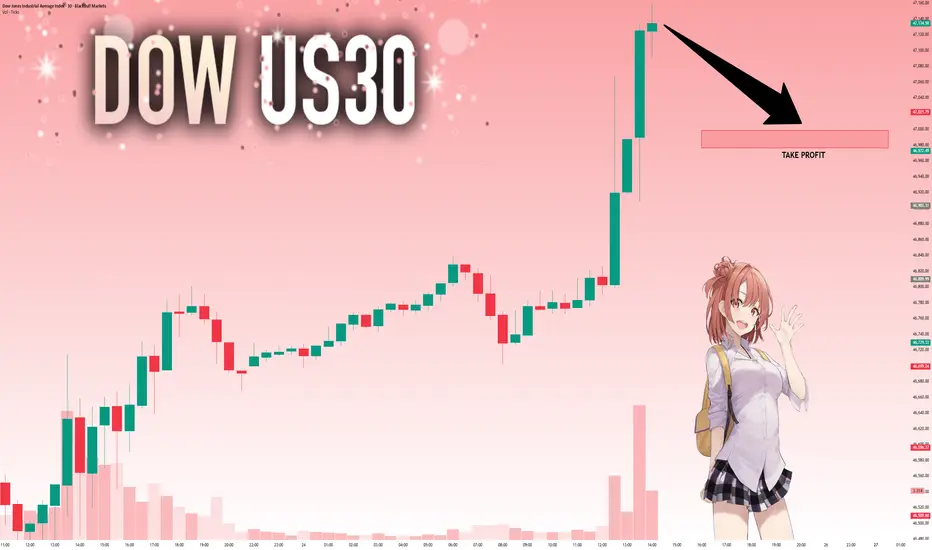
US30: Move Down Expected! Short!
My dear friends,
Today we will analyse US30 together☺️
The recent price action suggests a shift in mid-term momentum. A break below the current local range around 47,135.50 will confirm the new direction downwards with the target being the next key level of 46,998.29 and a reconvened placement of a stop-loss beyond the range.
❤️Sending you lots of Love and Hugs❤️
Trade ideas
DJI (US30) SPOT TECHNICAL ANALYSIS 📊 DJI (US30) SPOT TECHNICAL ANALYSIS | Oct 27-31, 2025 | Intraday Swing Trading Blueprint 🚀
Current Price: 42,210.7 | Timeframe Focus: 5M, 15M, 30M, 1H, 4H & 1D ⏰
━━━━━━━━━━━━━━━━━━━━━━━━━━━━━━━━━━━━━━━━━━━━━━━
🔍 DAILY (1D) ANALYSIS - Swing Trade Framework
On the daily timeframe, DJI exhibits strong bullish momentum with price trading above key exponential moving averages (EMA 50 & 200). 📈 The Ichimoku Cloud shows bullish alignment with price above the cloud, indicating sustained uptrend. Elliott Wave analysis suggests we're in Wave 3 or Wave 5 of an impulse sequence.
Key Support: 41,800-42,000 | Key Resistance: 42,500-42,800
Bollinger Bands on 1D are expanding, confirming rising volatility . RSI hovers near 60-70 zone (approaching overbought but not critical). Volume profile shows accumulation phases at lower levels with distribution emerging at current price action. Dow Theory confirms higher highs and higher lows pattern intact. 💪
━━━━━━━━━━━━━━━━━━━━━━━━━━━━━━━━━━━━━━━━━━━━━━━
⚡ 4-HOUR (4H) SWING TRADE Setup - PRIMARY ENTRY SIGNAL
4H chart displays bullish breakout potential above 42,400 resistance. Harmonic Pattern analysis reveals potential Gartley reversal at support (41,950-42,050). RSI at 65 indicates strong momentum without extreme overbought conditions. 📊
Wyckoff Accumulation: Identified spring pattern suggesting buyers in control
VWAP Analysis: Price above VWAP = bullish bias maintained
Volume Breakout: Watch for volume spike above 42,400 for confirmation
Gann Theory Angle: 45° resistance level aligns with psychological 42,500 mark. Entry on breakout with stop loss at 42,050. Target: 42,650 for quick swing profits! 🎯
━━━━━━━━━━━━━━━━━━━━━━━━━━━━━━━━━━━━━━━━━━━━━━━
🎯 1-HOUR (1H) INTRADAY SCALP SETUP
Hourly timeframe shows consolidation within 42,100-42,300 range . Elliott Wave suggests completion of Wave 2 correction with Wave 3 breakout imminent. 💥 Bollinger Bands are contracting = volatility squeeze incoming!
RSI oscillates near 50 (neutral zone) - PERFECT setup for directional bias confirmation. Support holds at 42,150 (VWAP cluster). Resistance breakout at 42,350 triggers aggressive long entry.
Harmonic Pattern Recognition: Butterfly reversal pattern forming near support zone. Risk/Reward ratio: 1:3 on breakout trades! 📈
━━━━━━━━━━━━━━━━━━━━━━━━━━━━━━━━━━━━━━━━━━━━━━━
⏱️ 30-MINUTE (30M) TACTICAL ENTRY GUIDE
30M timeframe is CRITICAL for entry timing ! Currently showing micro-consolidation with 3 candle reversal pattern forming. Ichimoku Cloud on 30M provides dynamic support around 42,200.
Watch for: Channel breakout above 42,280 for aggressive long setup
Simple Moving Average (SMA 20) acts as dynamic support. Exponential Moving Average (EMA 9) shows bearish crossover risk - key reversal indicator! ⚠️ RSI dip below 50 offers contrarian entry for counter-trend scalps.
Volume Spike Incoming: Wyckoff Distribution phase detected - anticipate volatility expansion into London/US session open! 🌍
━━━━━━━━━━━━━━━━━━━━━━━━━━━━━━━━━━━━━━━━━━━━━━━
🚀 15-MINUTE (15M) MOMENTUM BREAKOUT SETUP
Perfect swing trade entry timeframe ! 15M displays textbook Elliott Wave 5-wave pattern completing. Price oscillating in 42,150-42,350 box. 📦
Bollinger Band Squeeze: Expansion breakout imminent this week
RSI Divergence: Bullish reversal divergence between last two lows
VWAP Bounce: Strong rejection from VWAP = trend resumption likely
Dow Theory Confirmation: Higher lows maintained perfectly. Harmonic Pattern (Gartley) completion nearing 42,050-42,100. Gann angles converge at 42,420 - MAJOR BREAKOUT ZONE! 🎯
━━━━━━━━━━━━━━━━━━━━━━━━━━━━━━━━━━━━━━━━━━━━━━━
⚡ 5-MINUTE (5M) ULTRA-SCALP ENTRIES - EXECUTION TIMING
5M chart = TRADE EXECUTION window ! Shows tight consolidation within 15 pips range (42,210-42,225). Japanese candlestick patterns reveal Doji + Hammer reversal formations. 🔨
Ichimoku Cloud on ultra-low timeframe provides micro S&R; levels. RSI oscillating 45-55 zone = prepare for directional breakout. Volume surge on breakout candle = GREEN LIGHT for entry! 💚
Bollinger Bands on 5M are at tightest compression - expect violent move incoming! Stop losses tight at 42,190 for risk management.
Target 1: 42,280 | Target 2: 42,350 | Target 3: 42,420
━━━━━━━━━━━━━━━━━━━━━━━━━━━━━━━━━━━━━━━━━━━━━━━
📌 WEEKLY TRADING STRATEGY (Oct 27-31)
BULLISH BIAS DOMINATES across all timeframes! Wyckoff accumulation + Elliott Wave Wave 3 setup = explosive move likely. RSI proximity to overbought (not yet extremes) = continuation room.
Key Trading Rules:
Harmonic Pattern targets hit first = take 50% profits
Gann angles breached = add to position
VWAP rejection at support = reversal setup triggered
Volume confirmation on breakouts = only trade valid entries
Volatility Expected: Bollinger Band width expansion + options expiry week = 150-200 pips potential range! 🔥
Reversals Watch: Identifying overbought RSI extremes above 75 triggers pullback potential. Support zones (42,050-42,100) act as reversal pivots. Breakout failures at 42,500 = harmonic reversal zones activate.
Risk Management Critical: Use tight stops at 42,190. Take profits at Gann angles. Scale in using Wyckoff distribution signals. Ichimoku Cloud breakouts = strong follow-through probability.
━━━━━━━━━━━━━━━━━━━━━━━━━━━━━━━━━━━━━━━━━━━━━━━
🎯 FINAL VERDICT: BUY breakout above 42,400 | HOLD through 42,500-42,650 targets | EXIT on harmonic reversal signals
#DJI #US30Spot #TechnicalAnalysis #ElliottWave #SwingTrading #IntraDayTrading #Harmonic #WyckoffMethod #TradingView #ForexAnalysis #StockMarket #CryptoCommunity #TradersOfTwitter #TechnicalAnalyst #BreakoutTrade #MomentumTrading #VolumeAnalysis #VWAP #BollingerBands #RSI #Ichimoku #GannTheory #DowTheory #TradingSignals #Oct2025 🚀📊💹
━━━━━━━━━━━━━━━━━━━━━━━━━━━━━━━━━━━━━━━━━━━━━━━
Disclaimer: This analysis is educational only. Not financial advice. Always trade with proper risk management and your own analysis. Past performance ≠ future results. Trade at your own risk! ⚠️
Study the charts, confirm setups, and execute with precision! Happy trading! 🎯💰
US30By the end of the week, a minor upward movement is expected in the index to form the second high node, after which, to complete the current upward cycle, the price will decline to levels around 45,600. This is a personal analysis, and naturally, the responsibility for any trading decisions rests solely with the individual.

US30: Price fails to break high, sellers step inSPREADEX:DJI – Price Rejects Previous High, Possible Pullback Ahead
🕒 Timeframe: 30-Minute Chart
📊 Data Source: Spreadex
💵 Currency: USD
________________________________________
🧠 Short Summary (SEO Preview)
US30 (Dow Jones) has rejected its previous swing high near 47,100 after a strong bullish recovery. Price action now shows early signs of weakness from the supply zone, suggesting a potential short-term correction before the next directional move.
#US30 #DowJones #WallStreet #PriceAction #SupplyAndDemand #TechnicalAnalysis #TradingViewIdeas
________________________________________
📈 Market Overview
After forming a solid base around 46,250 – 46,300, the Wall Street Index (US30) has staged a strong V-shaped recovery.
However, recent candles show that price was rejected at the previous high around 47,100, indicating that buying momentum may be fading as the market hits a strong supply zone.
________________________________________
🔍 Key Technical Zones
Supply Zone (Resistance):
47,000 – 47,150
This zone aligns with the previous swing high where strong selling pressure emerged.
The rejection from this level signals potential exhaustion of buyers in the short term.
Demand Zone (Support):
46,750 – 46,850
This is a former resistance area turned support. A retest here could trigger a short-term bullish reaction before the market decides its next move.
________________________________________
🎯 Trading Scenarios
Scenario 1 – Rejection from Supply Zone (Main Bias)
1. Price has tested the 47,000 – 47,150 zone and rejected the previous high.
2. If sellers remain in control, a pullback toward 46,750 – 46,850 is likely.
3. A deeper correction could extend toward 46,600 – 46,650 if momentum builds.
Scenario 2 – Breakout Above Supply Zone
1. A confirmed candle close above 47,150 would invalidate the short-term bearish bias.
2. In that case, 47,150 may flip into support, opening room for 47,300 – 47,400 as the next bullish targets.
________________________________________
🧭 Technical Outlook
• The rejection of the previous high at 47,100 confirms a key resistance zone.
• Momentum is slowing, suggesting a likely short-term pullback before any new highs.
• Potential strategy: Wait for bearish confirmation (e.g., rejection candle, lower-high formation) around 47,000 – 47,150 before making any decision.
________________________________________
Disclaimer
This analysis is for educational and technical purposes only — not financial advice.
Always manage risk and follow your own trading plan before taking any trades.
Please like and comment below to support our traders. Your reactions will motivate us to do more analysis in the future 🙏✨
Harry Andrew @ ZuperView

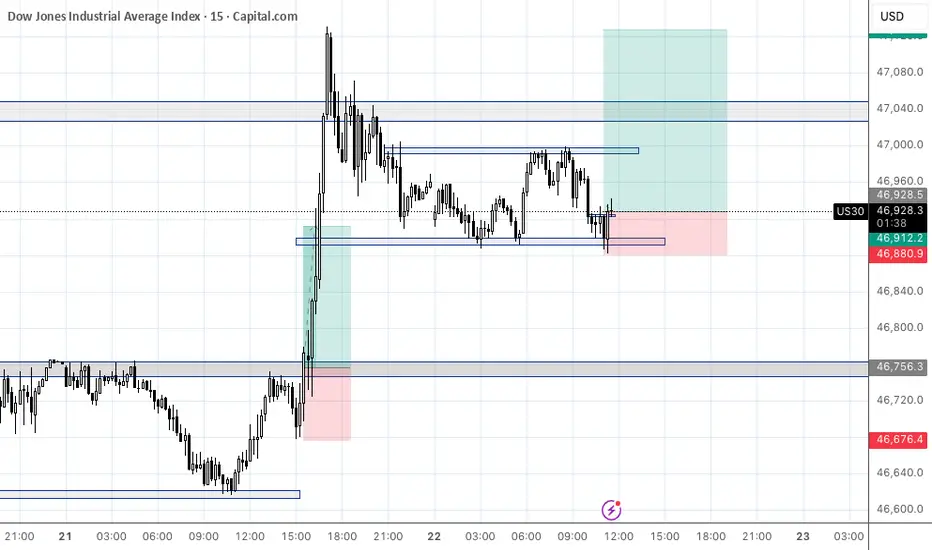
24-10-2025 Intraday Plan (CPI + NY Open Scenario) – US30 5M/1M💬 Intraday Plan (CPI + NY Open Scenario) – US30 5M/1M
📍 Bias remains bullish above 46,700 (structure still forming higher lows).
📍 Expecting CPI at 13:30 to create a liquidity grab — ideally sweeping lows into the ascending trendline/support.
📍 After CPI spike settles, looking for a NY Open breakout above 46,850 (key resistance).
📍 If we get a break + retest of 46,850, I’ll look for long entries targeting:
✅ TP1: 47,000
✅ TP2: 47,100
✅ TP3: 47,200 (liquidity extension)
❌ If CPI breaks below 46,700 and fails to recover, I’ll reassess for a bearish scenario.
🕒 No trades during initial CPI spike – waiting for structure confirmation post-news & into NY session.
📌 Plan: CPI grab → NY breakout → retest entry → continuation.

US30 longI see great buying power coming.
sentiments are looking risk on and positive for US stocks as Us and china look to be interested in making a trade deal.
technicals show that at the current price levels buyers have come in to purchase driving price up
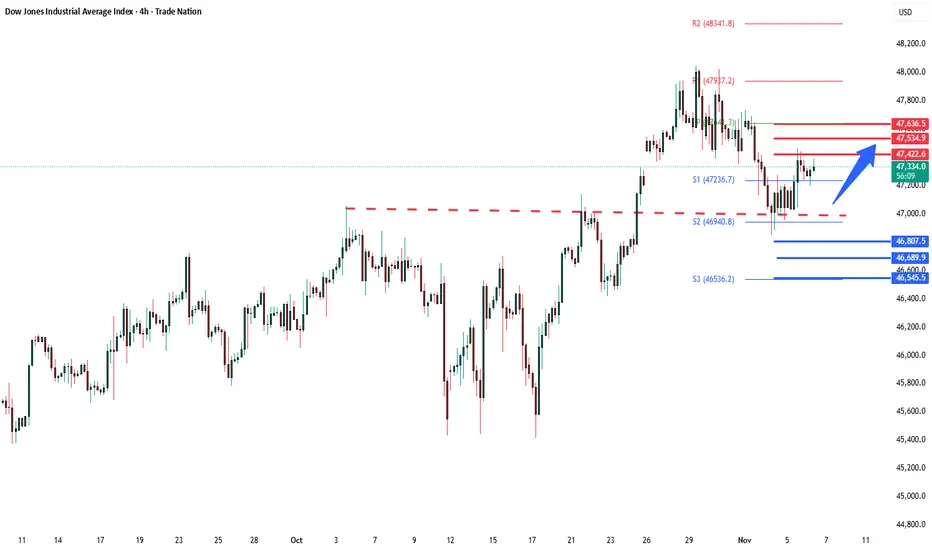
Dow Key Trading levels Key Support and Resistance Levels
Resistance Level 1: 47433
Resistance Level 2: 47534
Resistance Level 3: 47636
Support Level 1: 46807
Support Level 2: 46690
Support Level 3: 46545
This communication is for informational purposes only and should not be viewed as any form of recommendation as to a particular course of action or as investment advice. It is not intended as an offer or solicitation for the purchase or sale of any financial instrument or as an official confirmation of any transaction. Opinions, estimates and assumptions expressed herein are made as of the date of this communication and are subject to change without notice. This communication has been prepared based upon information, including market prices, data and other information, believed to be reliable; however, Trade Nation does not warrant its completeness or accuracy. All market prices and market data contained in or attached to this communication are indicative and subject to change without notice.
US30 Trade Set Up Nov 6 2025Price is bullish making HH/HL on the 1h and BOS of the Asia range so i will want to see price come to sweep SSL and/or tap into 1h FVG to then make 1m-5m IFVG/CISD to target PDH

DOW JONES HIGH PROBABILITY SETUPS SOON!!!🚨 DOW30 HIGH PROBABILITY SELL/BUY SETUP 🚨
* Here We Can See Clearly The Next Potential Moves For US30 Coming Hours/Days.
* Keep Your Eyes Close On Your Trading Positions.
* Happy PIP Hunting Traders.
FXKILLA.

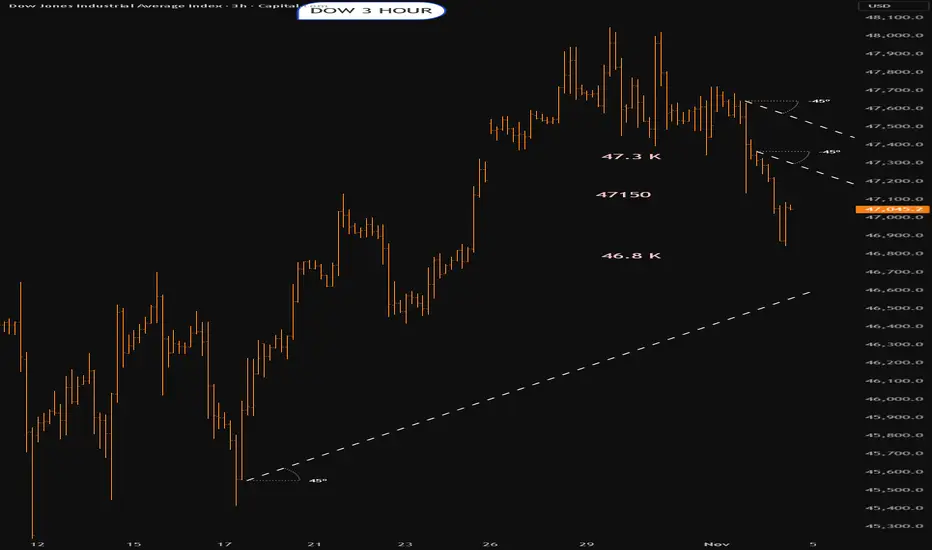
Dow into the open.Thursday 6th NovemberCould go either way
Lets see what happens
Trend is up
Plenty of rez
US30 — Bullish Fib Retracement Reaction from Demand ZoneUS30 is showing a potential bullish continuation setup after retesting the key demand zone near 46,800–46,600, aligned with the Fib 0.5–0.618 retracement levels and structural support. Price rejected from this area with strong momentum, signaling that buyers may be preparing for another push toward the 48,000 resistance zone.
Key Technical Highlights:
Resistance: 48,040 (recent high)
Support: 46,800–46,600 (Fib confluence + demand zone)
Trendline: Long-term ascending structure remains intact
Extension Targets: 47,800 → 48,000
Trade Outlook:
The market is holding structure above the retracement zone, with buyers defending the bullish trendline. A confirmed 4H close above 47,360 would validate continuation toward the next upside leg.
If price dips again, 46,600–46,400 remains the ideal re-entry zone for longs.
A daily close below 46,000 would invalidate the bullish scenario and shift focus toward the 45,200 region.
Bias:
Bullish continuation favored while price remains above 46,600 — expecting buyers to target 48,000 in the next impulsive move.

US30 Trade Set Up Nov 5 2025Price is overall still bearish making LH/LL on the 1h and 15m but is consolidating on the 1h and 15m. So to see more sells i would want to see price continue to respect this 4h FVG, sweep BSL/London highs to then form 1m-5m IFVG/CISD to target SSL/Asia lows and even PDL

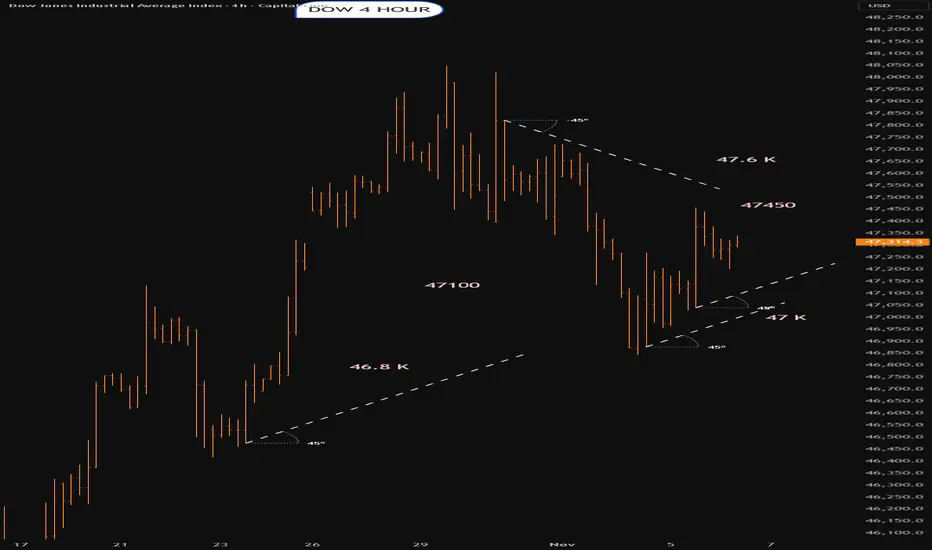
Dow into the open.Tuesday 4th NOVEMBERIn a possible bounce area
47150 seems to be some sort of pf pivot area
Lets see what happens
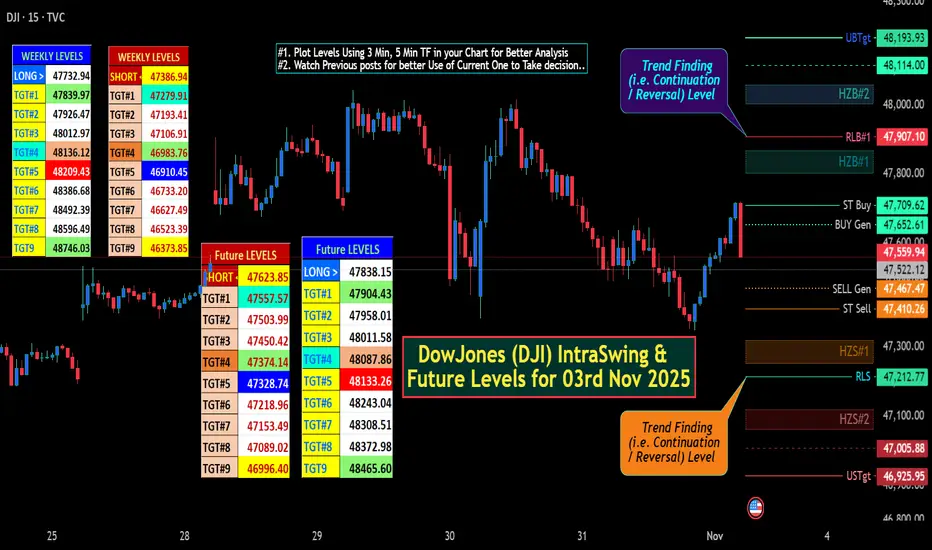
DowJones (DJI) IntraSwing & Future Levels for 03rd Nov 2025✍🏼️ "Future IntraSwing Levels" mentioned in BOX format.
✍🏼️ "WEEKLY Levels" mentioned in BOX format.
L#1: If the candle crossed & stays above the “Buy Gen”, it is treated / considered as Bullish bias.
L#2: Possibility / Probability of REVERSAL near RLB#1 & UBTgt
L#3: If the candle stays above “Sell Gen” but below “Buy Gen”, it is treated / considered as Sidewise. Aggressive Traders can take Long position near “Sell Gen” either retesting or crossed from Below & vice-versa i.e. can take Short position near “Buy Gen” either retesting or crossed downward from Above.
L#4: If the candle crossed & stays below the “Sell Gen”, it is treated / considered a Bearish bias.
L#5: Possibility / Probability of REVERSAL near RLS#1 & USTgt
HZB (Buy side) & HZS (Sell side) => Hurdle Zone,
*** Specialty of “HZB#1, HZB#2 HZS#1 & HZS#2” is Sidewise (behaviour in Nature)
Rest Plotted and Mentioned on Chart
Color code Used:
Green =. Positive bias.
Red =. Negative bias.
RED in Between Green means Trend Finder / Momentum Change
/ CYCLE Change and Vice Versa.
Notice One thing: HOW LEVELS are Working.
Use any Momentum Indicator / Oscillator or as you "USED to" to Take entry.
⚠️ DISCLAIMER:
The information, views, and ideas shared here are purely for educational and informational purposes only. They are not intended as investment advice or a recommendation to buy, sell, or hold any financial instruments. I am not a SEBI-registered financial adviser.
Trading and investing in the stock market involves risk, and you should do your own research and analysis. You are solely responsible for any decisions made based on this research.
"As HARD EARNED MONEY IS YOUR's, So DECISION SHOULD HAVE TO BE YOUR's".
Do comment if Helpful .
In depth Analysis will be added later (If time Permits)
US30How to become successful in forex and stock trading:
1.Master fundamentals and technical analysis.
2.Build and follow a solid trading plan.
3.Apply strict risk management (4–6% rule).
4.Stay disciplined—control fear and greed.
5.Record and analyze every trade.
6.Focus on high-quality setups only.
7.Diversify across assets and markets.
8.Keep evolving—study, adapt, and grow daily.

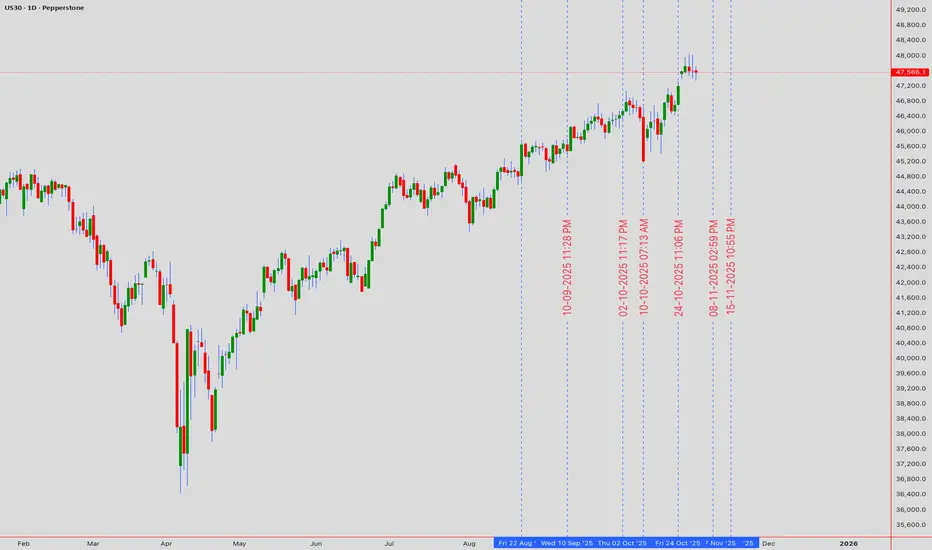
The Dow or gold ?The downward trend in the Dow versus gold ratio is clearly bearish. It's impossible to know when gold will be worth more than the Dow.

US30 DOW JONES | Elite Technical Analysis & Trading Masterclass 🔵 US30 DOW JONES | Elite Technical Analysis & Trading Masterclass | 47,566.1 🔵
📊 INSTITUTIONAL GRADE MULTI-TIMEFRAME BREAKDOWN | NOV 3-7, 2025 FORECAST 📊
Current Level: 47,566.1 | Analysis Timestamp: November 1, 2025, 00:54 UTC+4
▬▬▬▬▬▬▬▬▬▬▬▬▬▬▬▬▬▬▬▬▬▬▬▬▬▬▬▬▬▬▬▬▬▬▬▬▬▬▬▬
🎯 EXECUTIVE MARKET BRIEFING & STRATEGIC OVERVIEW
The Dow Jones Industrial Average trades at 47,566.1 , positioned at a critical inflection point that will define the market's trajectory for Q4 2025. Our institutional-grade analysis reveals a bullish bias with caution as price tests the upper boundary of a major ascending channel. This week's forecast combines classical technical analysis with modern algorithmic insights to deliver precision entry and exit strategies for both scalpers and position traders.
Institutional Support Zones: 🛡️
Primary Defense: 47,450 - 47,480 (High-frequency algo support)
Secondary Buffer: 47,350 - 47,380 (Volume-weighted anchor)
Critical Floor: 47,200 - 47,250 (Weekly pivot cluster)
Major Foundation: 47,000 - 47,050 (Psychological & structural)
Resistance & Target Matrix: 🎯
Immediate Cap: 47,650 - 47,680 (Intraday supply zone)
Secondary Barrier: 47,750 - 47,800 (Daily resistance band)
Breakout Zone: 47,900 - 47,950 (Pattern completion area)
Major Target: 48,100 - 48,150 (Weekly extension objective)
▬▬▬▬▬▬▬▬▬▬▬▬▬▬▬▬▬▬▬▬▬▬▬▬▬▬▬▬▬▬▬▬▬▬▬▬▬▬▬▬
📈 WEEKLY TIMEFRAME (1W) - MACRO STRUCTURE ANALYSIS
Elliott Wave Grand Supercycle: 🌊
We're navigating Intermediate Wave (3) of Primary Wave 5 within the grand supercycle. The current consolidation represents a Wave 4 triangle with explosive Wave 5 potential targeting 48,500-49,000. Alternative bearish count suggests completion of Wave B with Wave C decline risk below 47,000.
Wyckoff Method Application: 📚
Current Phase: Late Stage Re-Accumulation
- Preliminary Support (PS): 46,800
- Selling Climax (SC): 46,500
- Automatic Rally (AR): 47,800
- Secondary Test (ST): Successfully held 46,900
Next: Sign of Strength (SOS) breakout above 47,800
Ichimoku Cloud Master Analysis: ☁️
Weekly cloud remains decisively bullish with price trading above both Senkou spans. Chikou Span shows clear space - no resistance overhead. The lagging span at 47,200 confirms the uptrend integrity. Cloud thickness of 450 points provides substantial support cushion.
Advanced Harmonic Recognition: 🦋
Developing Bullish Bat pattern with critical ratios:
- XA retracement: 0.886 at 47,350 ✅
- AB extension: 0.382-0.5 zone active
- BC projection: Targeting 1.618-2.618 at 48,200-48,500
- Pattern invalidation: Below 47,100
▬▬▬▬▬▬▬▬▬▬▬▬▬▬▬▬▬▬▬▬▬▬▬▬▬▬▬▬▬▬▬▬▬▬▬▬▬▬▬▬
📊 DAILY TIMEFRAME (1D) - SWING TRADING BLUEPRINT
Master Candle Analysis: 🕯️
Yesterday's Hammer candlestick at 47,450 support confirms buyer absorption. The long lower shadow indicates institutional accumulation . Today's confirmation above 47,600 would complete a Morning Star reversal pattern.
Chart Pattern Mastery:
Currently resolving a Symmetrical Triangle with apex at 47,600. Breakout implications:
- Upside breakout: Targets 48,150 (measured move)
- Downside break: Targets 47,100 (risk scenario)
- Volume requirement: 20% above average for validation
Bollinger Bands Strategy: 📈
Upper Band: 47,720 (resistance)
Middle Band (20 SMA): 47,480 (support)
Lower Band: 47,240 (oversold zone)
Band Width: Contracting - Squeeze imminent
%B Reading: 0.72 (bullish momentum)
RSI Divergence Analysis:
Daily RSI at 58 with hidden bullish divergence detected. The RSI trend line from October lows remains intact. Overbought threshold at 70 provides 12 points of upside momentum potential.
▬▬▬▬▬▬▬▬▬▬▬▬▬▬▬▬▬▬▬▬▬▬▬▬▬▬▬▬▬▬▬▬▬▬▬▬▬▬▬▬
⚙️ 4-HOUR TIMEFRAME (4H) - TACTICAL POSITIONING
Gann Theory Application: 📐
Price respecting the 2x1 Gann angle from October low at 46,200. Current intersection at 47,550 acting as dynamic support. Next Gann resistance levels:
- 1x1 angle: 47,750
- 1x2 angle: 47,920
- Square of 9: 48,100
Dow Theory Confirmation:
Primary Trend: Bullish (higher highs/lows intact)
Secondary Trend: Consolidation phase
Minor Trend: Testing resistance
Volume Confirmation: Accumulation on dips
Breadth Analysis: 70% of Dow components bullish
Moving Average Orchestra:
EMA 20: 47,520 (immediate support)
EMA 50: 47,440 (strong support)
SMA 100: 47,350 (critical support)
SMA 200: 47,180 (major trend support)
Pattern Alert: ⚡
Textbook Bull Flag formation with pole from 47,200 to 47,800. Flag consolidation between 47,500-47,650. Breakout above 47,650 projects 48,250 target.
▬▬▬▬▬▬▬▬▬▬▬▬▬▬▬▬▬▬▬▬▬▬▬▬▬▬▬▬▬▬▬▬▬▬▬▬▬▬▬▬
💫 1-HOUR TIMEFRAME (1H) - INTRADAY PRECISION
Micro Pattern Development: 🔬
Inverse Head & Shoulders building:
- Left Shoulder: 47,480
- Head: 47,420
- Right Shoulder: Forming at 47,490
- Neckline: 47,580
- Target upon breakout: 47,740
VWAP Strategy Matrix:
Daily VWAP: 47,535
Weekly VWAP: 47,485
Monthly VWAP: 47,320
Upper Band 1: 47,610 (first target)
Upper Band 2: 47,685 (second target)
Lower Band 1: 47,460 (first support)
Support & Resistance Precision Map:
R3: 47,750 | R2: 47,680 | R1: 47,620
PIVOT: 47,566 (current price)
S1: 47,510 | S2: 47,450 | S3: 47,380
▬▬▬▬▬▬▬▬▬▬▬▬▬▬▬▬▬▬▬▬▬▬▬▬▬▬▬▬▬▬▬▬▬▬▬▬▬▬▬▬
⚡ 30-MINUTE SCALPING LABORATORY (30M)
Micro Structure Dynamics: 🎪
Ascending channel with precise boundaries:
- Upper channel: 47,620-47,640
- Mid-channel: 47,550-47,570
- Lower channel: 47,480-47,500
Volume Profile Insights: 📊
Point of Control (POC): 47,540
Value Area High (VAH): 47,590
Value Area Low (VAL): 47,490
High Volume Node: 47,500-47,550 (accumulation zone)
Scalping Execution Zones:
Long Zone A: 47,520-47,530 (VWAP test)
Long Zone B: 47,490-47,500 (channel bottom)
Short Zone A: 47,620-47,630 (channel top)
Short Zone B: 47,680-47,690 (resistance cluster)
▬▬▬▬▬▬▬▬▬▬▬▬▬▬▬▬▬▬▬▬▬▬▬▬▬▬▬▬▬▬▬▬▬▬▬▬▬▬▬▬
🏃 15-MINUTE & 5-MINUTE HYPERSPEED TRADING
15-Minute Lightning Setups: ⚡
Bullish Pennant completion imminent at 47,580. Breakout targets:
- Target 1: 47,620 (+40 points)
- Target 2: 47,660 (+80 points)
- Stop Loss: 47,540 (-40 points)
5-Minute Algo Trading Signals:
Entry Triggers:
- RSI < 30 + VWAP touch = Long signal
- RSI > 70 + Resistance = Short signal
- MACD crossover + Volume spike = Trend entry
Exit Rules:
- 20-point profit target OR
- RSI extremes (>80 or <20) OR
- VWAP band 2 touch
Session-Based Trading Plan: 🕐
Asian Session: Range 47,520-47,580 (60 points)
London Open: Breakout potential above 47,600
NY Premarket: Volatility increase to 80+ points
NY Session: Directional move 100+ points
NY Close: Position squaring near 47,550
▬▬▬▬▬▬▬▬▬▬▬▬▬▬▬▬▬▬▬▬▬▬▬▬▬▬▬▬▬▬▬▬▬▬▬▬▬▬▬▬
📅 WEEK AHEAD PLAYBOOK (NOVEMBER 3-7, 2025)
Monday, November 3: 🚀
Gap probability: 70% bullish to 47,620+
Strategy: Buy dips to 47,520, target 47,680
Key levels: Support 47,480, Resistance 47,700
Tuesday, November 4: 🗳️
Election Day volatility - 150+ point swings expected
Strategy: Straddle positions, tight stops
Range forecast: 47,350-47,750
Wednesday, November 5: 💥
Post-election directional breakout
Strategy: Follow the breakout with size
Bullish above 47,800, Bearish below 47,300
Thursday, November 6: 📊
Fed speak and data releases
Strategy: Fade extremes with mean reversion
Expected range: 47,500-47,900
Friday, November 7: 🎯
Weekly options expiry - gamma pinning likely
Strategy: Sell premium around 47,750 strike
Weekly close above 47,750 = Bullish continuation
▬▬▬▬▬▬▬▬▬▬▬▬▬▬▬▬▬▬▬▬▬▬▬▬▬▬▬▬▬▬▬▬▬▬▬▬▬▬▬▬
⚖️ PROFESSIONAL RISK MANAGEMENT FRAMEWORK
Intraday Risk Protocol: 🛡️
Position size: 1-2% risk per trade maximum
Risk-Reward: Minimum 1:2, target 1:3
Daily loss limit: -3% circuit breaker
Consecutive losses: Max 3, then stop
Profit protection: Trail stop at 50% of max profit
Break-even: Move stop to entry at +30 points
Swing Position Architecture: 📈
Core position: 40% at 47,450-47,500
Scale-in levels: 30% at 47,350, 30% at 47,250
Stop loss: Below 47,150 (all positions)
Target 1: 47,850 (30% exit)
Target 2: 48,100 (40% exit)
Target 3: 48,350 (20% exit)
Runner: 48,500+ (10% moon bag)
▬▬▬▬▬▬▬▬▬▬▬▬▬▬▬▬▬▬▬▬▬▬▬▬▬▬▬▬▬▬▬▬▬▬▬▬▬▬▬▬
🔴 BEARISH CONTINGENCY & RISK SCENARIOS
Invalidation Triggers: 🐻
Hourly close below 47,450 = Caution signal
4H close below 47,350 = Bearish shift likely
Daily close below 47,200 = Trend reversal warning
Weekly close below 47,000 = Major bearish confirmation
Black Swan Risk Matrix: 🦢
• Geopolitical escalation (200+ point gaps)
• Federal Reserve surprise (150+ point moves)
• Corporate earnings shocks (100+ point swings)
• Technical failures (flash crashes)
• Algorithmic liquidations (cascading stops)
▬▬▬▬▬▬▬▬▬▬▬▬▬▬▬▬▬▬▬▬▬▬▬▬▬▬▬▬▬▬▬▬▬▬▬▬▬▬▬▬
🎯 HIGH-CONVICTION CONFLUENCE ZONES
Golden Buy Zone: ✅
47,450-47,500
(Multi-timeframe support + Fibonacci cluster + Volume POC + Moving average confluence)
Premium Sell Zone: ❌
47,850-47,900
(Major resistance + Pattern targets + Round number + Weekly R1 pivot)
Breakout Confirmation: 🚀
47,680-47,720
(Triangle breakout + Flag completion + Bollinger Band penetration)
▬▬▬▬▬▬▬▬▬▬▬▬▬▬▬▬▬▬▬▬▬▬▬▬▬▬▬▬▬▬▬▬▬▬▬▬▬▬▬▬
💎 MASTER TRADER'S FINAL VERDICT
The Dow Jones at 47,566.1 presents a high-probability bullish setup with clearly defined risk parameters. The convergence of technical indicators, pattern completions, and volume dynamics creates an asymmetric risk-reward opportunity favoring longs above 47,450.
Week's Best Trade Setups: 🏆
Swing Long: 47,450-47,500 zone → Target: 48,100
Breakout Long: Above 47,680 → Target: 47,900
Scalp Long: VWAP touches at 47,535 → Target: 47,620
Success Keys: 🔑
Trade with the trend, but protect your capital. Size positions appropriately. Honor stop losses religiously. Let winners run with trailing stops.
"In trading, the disciplined mind triumphs over the brilliant mind" - Master the process, profits follow! 💰
▬▬▬▬▬▬▬▬▬▬▬▬▬▬▬▬▬▬▬▬▬▬▬▬▬▬▬▬▬▬▬▬▬▬▬▬▬▬▬▬
#US30 #DowJones #DJI #TechnicalAnalysis #Trading #StockMarket #Indices #DayTrading #SwingTrading #ElliottWave #Wyckoff #GannTheory #PriceAction #TradingStrategy #MarketAnalysis #InstitutionalTrading #OrderFlow #VolumeProfile #TradingView #SPX500 #MarketForecast
🔔 Follow for Institutional-Grade Analysis Daily! | Excellence in Execution 📊
Risk Disclosure: Trading involves substantial risk. Past performance is not indicative of future results. Always conduct thorough research and implement strict risk management protocols.

US30: Will Go Up! Long!
My dear friends,
Today we will analyse US30 together☺️
The recent price action suggests a shift in mid-term momentum. A break above the current local range around 47,424.07 will confirm the new direction upwards with the target being the next key level of 47,606.64 and a reconvened placement of a stop-loss beyond the range.
❤️Sending you lots of Love and Hugs❤️

US30 Trade Set Up Oct 31 2025Price already induced SSL and is now trapping buyers at BSL so as long as price respects the 1h FVG i will be looking for sells to PDL and to fill the daily gap

sell to buylooking for price to take down the lows before any major high being taken out as retailer traders are net bullish now and it is late as price is showing signs of decline on key structure areas which will cos retail to react and take early buys.

The Golden trendline of DJIThis golden trendline (which is nothing but the speed of any stock or index) is working fine and DJI is respecting it. Going by it, the resistance seems a good one to break (on closing basis) and the ADX is going to pick up momentum. As long as DJI is below this line, one may look for shorting opportunities. If it stays below this line and ADX goes up, then we may see a sharper correction. (For educational purposes only)

3 us30 trades ready for rumble! last one is gonna make you rich!as trade 1 we got a head and shoulders move on the 1h with a target of 274 pips.
as trade 2 we got a BEAUTIFUL triple bottom move on the 4h/1h/15m with a target of 500 pips.
as trade 3 i call this the blue eyes white dragon! We got a triple top but this one got a trendline that starts from febr 2018 and hit the trendline yesterday for the first time since nov 2021 i took the short yesterday and got 300pips out of it but it looks like it needs to hit it again to make a big move to the downside a big crash will come because of some bad news (i told you guys already!) target of 2000 pips.
it can happen that its skips the first or second trade but focus on the third thats the money move!!
goodluck everyone,
just a retard
