us30 4h🔹 Overall Outlook and Potential Price Movements
In the charts above, we have outlined the overall outlook and possible price movement paths.
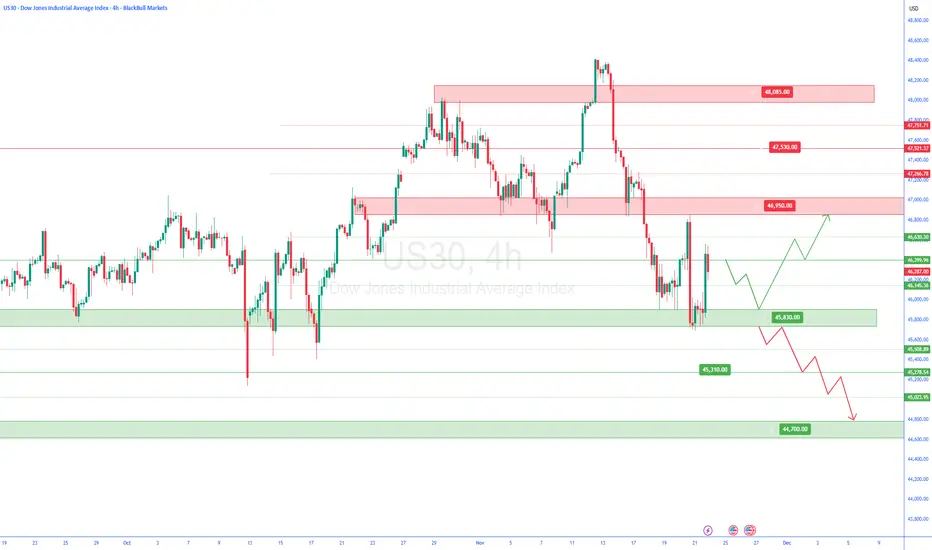
As shown, each analysis highlights a key support or resistance zone near the current market price. The market’s reaction to these zones — whether a breakout or rejection — will likely determine the next direction of the price toward the specified levels.
⚠️ Important Note:
The purpose of these trading perspectives is to identify key upcoming price levels and assess potential market reactions. The provided analyses are not trading signals in any way.
✅ Recommendation for Use:
To make effective use of these analyses, it is advised to manually draw the marked zones on your chart. Then, on the 15-minute time frame, monitor the candlestick behavior and look for valid entry triggers before making any trading decisions.
Trade ideas
Us301. Higher Timeframe Bias (HTF)
Check these 4 only:
• Monthly → Bullish or Bearish?
• Weekly → Bullish or Bearish?
• Daily → Bullish or Bearish?
• 4H → Bullish or Bearish?
👉 Only trade in the direction where most timeframes agree.
⸻
2. 15-Minute Structure
• Did the 15m break structure (BOS) up for buys or down for sells?
• Did price come back to retest that level?
👉 If no BOS → NO TRADE
👉 If no retest → WAIT
⸻
3. 20 EMA Confirmation (15m)
• Buys: Price ABOVE 20 EMA
• Sells: Price BELOW 20 EMA
This confirms momentum in your direction.
⸻
4. Entry Candle Confirmation
Choose your execution timeframe (15m or 5m):
• Buy: Bullish engulfing or strong bullish candle
• Sell: Bearish engulfing or strong bearish candle
This tells you the retest is holding.
⸻
5. Exact Trade Levels
This makes everything crystal clear:
BUY Example
• Entry: 37,920
• Stop-Loss: 37,820 (100 points below)
• Take Profit (2:1): 38,120
• Optional 4:1 target: 38,320 (only if confluence is extremely high)
SELL Example
• Entry: 37,920
• Stop-Loss: 38,020 (100 points above)
• Take Profit (2:1): 37,720
⸻
⭐ Simple 1–2–3 Summary
1. Bias → Are most timeframes all bullish or bearish?
2. Structure → BOS + Retest?
3. Entry → EMA + Strong candle + Clear SL + Clear TP.

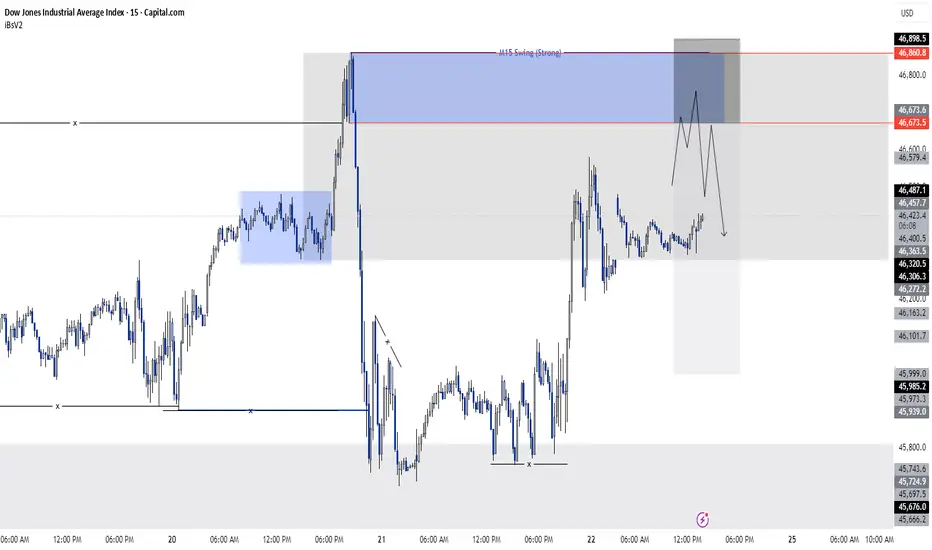
US 30 sell idea As we know, the swing structure on both the H4 and M15 timeframes is bearish. And we also know that we cannot take trades directly from the H4 timeframe, so to refine our entry we move down to the M15 timeframe and take our entry from there.
Now, on the H4 timeframe, we observed that the H4 swing is bearish, and at the same time, the H4 has also swept a fractal zone, after which the market moved downward. Now, for the market to continue its trend, it will make a pullback. We will look for this pullback on the M15 timeframe because we will take our sell entry from the M15 timeframe.
And on the M15 timeframe, when the price comes into our blue zone (46673.5 – 46860.8), we will take a sell trade.
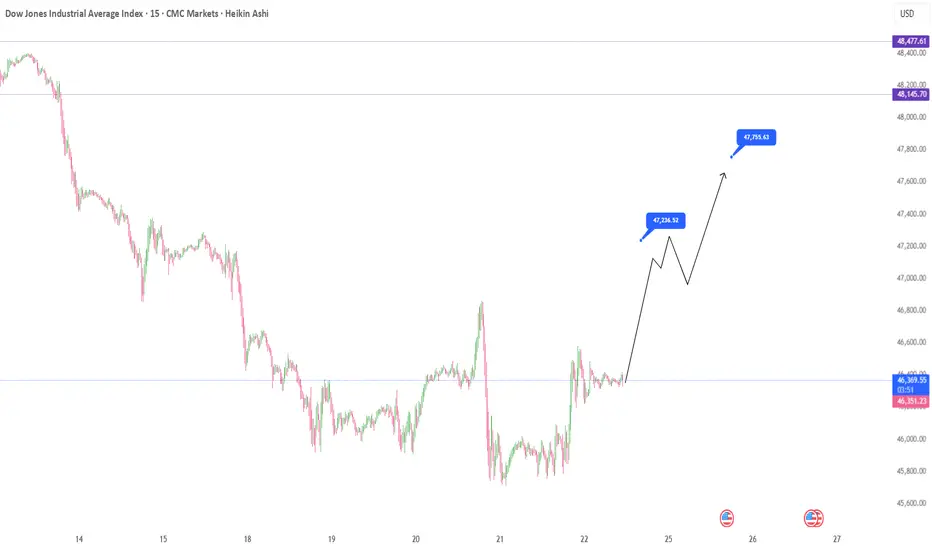
US30 in Start of WeekAfter ranging in Asian session, expect bullish movement to 46,800 levels starting with London session.
US30: Bearish Continuation & Short Signal
US30
- Classic bearish formation
- Our team expects fall
SUGGESTED TRADE:
Swing Trade
Sell US30
Entry Level - 46270
Sl - 46419
Tp - 46011
Our Risk - 1%
Start protection of your profits from lower levels
Disclosure: I am part of Trade Nation's Influencer program and receive a monthly fee for using their TradingView charts in my analysis.
❤️ Please, support our work with like & comment! ❤️

US30 BEARS ARE GAINING STRENGTH|SHORT
US30 SIGNAL
Trade Direction: short
Entry Level: 46,264.6
Target Level: 45,574.0
Stop Loss: 46,722.1
RISK PROFILE
Risk level: medium
Suggested risk: 1%
Timeframe: 4h
Disclosure: I am part of Trade Nation's Influencer program and receive a monthly fee for using their TradingView charts in my analysis.
✅LIKE AND COMMENT MY IDEAS✅

US30 LONG IDEAOverall trend is bullish so why not grabbing the nice bullish continuation opportunity
Dow Jones Wave Analysis – 24 November 2025
- Dow Jones reversed from support area
- Likely to rise to resistance level 47000.00
Dow Jones index recently reversed from support area between the key support level 45800.00 (which has been reversing the price from September), lower daily Bollinger Band and the 50% Fibonacci correction of the upward impulse from July.
The upward reversal from this support area stopped the previous short-term ABC correction 2.
Given the clear daily uptrend, Dow Jones index can be expected to rise to the next resistance level 47000.00 (top of the previous wave B).

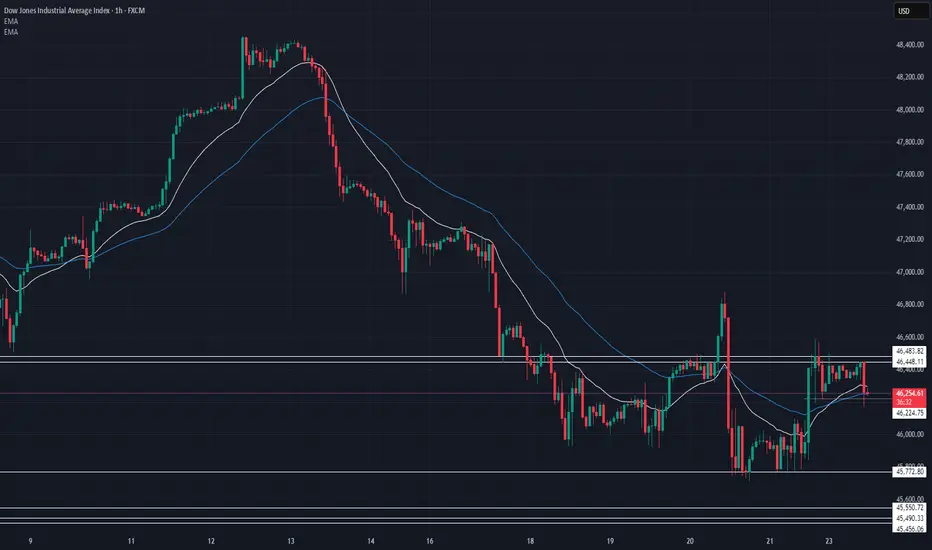
US30 Technical Breakdown – 11/24/2025📍 US30 Technical Breakdown – 11/24/2025
US30 showing signs of early recovery after last week’s heavy selloff, but still struggling to break above the 46,450–46,500 intraday resistance zone. Price remains below key EMAs, meaning sellers still hold the structural advantage unless bulls reclaim higher levels 🔎📉
After tapping demand around 45,770–45,900, buyers stepped in, but momentum is weak as long as the index stays under the 46,500 ceiling.
📊 Market Behavior:
🔹 Price rejecting 46,450–46,500 repeatedly → strong short-term supply
🔹 EMAs still sloping bearish → momentum favors sellers
🔹 Range-style behavior forming between 46,000–46,500
🔹 Bulls need a clean reclaim above EMAs for trend shift
📌 Key Levels:
Resistance:
🔹 46,450–46,500 → major intraday ceiling
🔹 46,780 → breakout extension
🔹 47,000 → structural shift zone
Support:
🔹 46,120 → weak intraday support
🔹 45,900 → key reaction zone
🔹 45,770 → major demand / bottom of range
🔹 45,456 – 45,320 → higher-timeframe demand
🧠 Bias:
Overall structure still bearish unless 46,500 breaks
📉 Sellers hold control beneath EMAs
⬆️ Break & close above 46,500 → opens move toward 46,780–47,000
⬇️ Rejection at 46,500 + break back under 46,120 → signals continuation lower
US30 – AI Bubble Pressure | Bearish Below 46000US30 | OVERVIEW
US30 declined on Friday as major technology stocks — including Nvidia — remained under pressure following the previous session’s sharp selloff.
Concerns over stretched AI-related valuations continued to weigh on market sentiment, despite Nvidia posting stronger-than-expected Q3 revenue and projecting an upbeat Q4 outlook.
Even with bullish forward guidance, the market is increasingly focused on the risk of an “AI bubble”, which remains the primary driver behind the decline.
US30 – Market Outlook | Bearish Below 46000
US30 declined as tech stocks came under pressure again, with concerns over a possible AI bubble overshadowing Nvidia’s strong earnings and positive guidance.
Below 46000: Bearish continuation toward 45680 → 45285 → 44950
Above 46000–46050: Short-term bullish correction toward 46250 → 46420 → 46600
Pivot: 46000
Support: 45680 · 45285 · 44950
Resistance: 46250 · 46400 · 46600
US30 remains bearish while below 46000, with only limited upside if 46050 breaks.

US30 Consolidation bearish trend momentumUS30 is showing signs of price consolidation within a broader bearish trend, with sellers continuing to apply pressure. momentum remains tilted to the downside as the index struggles to regain direction.
Wall Street’s major indices lost ground on Thursday after an early surge—driven by Nvidia’s strong earnings—faded. Investor concerns resurfaced regarding the stretched valuations in the technology sector, limiting risk appetite. In addition, mixed U.S. labour market data added uncertainty to the economic outlook, prompting questions about the likelihood and timing of future Federal Reserve interest rate,
A well-defined ascending channel is drawn, capturing the market’s previous uptrend. Price has recently broken down out of this channel, signalling a potential trend reversal. After the breakdown, the market has fallen sharply into a major support zone around the 45,028 may Price test the resistance and again show weakness and move to downside.
You may find more details in the chart,
Trade wisely best of Luck Buddies.
Ps; Support with like and comments for better analysis thanks for Supporting.

possibility of uptrend If the index breaks through the support range, the continuation of the downward trend to the next support levels will be possible.
Otherwise, with consolidation above the support range, the upward trend will be likely.

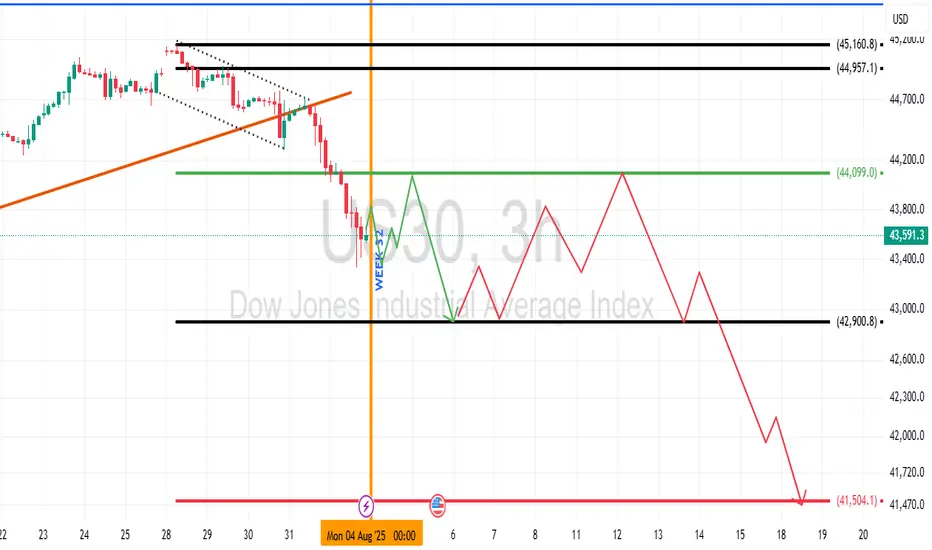
US 30 Dow Jones Industrial Average Week 32 OutlookUS 30, along with related indices, is likely to range for most of the week with early sells to confirm the support of interest. Best interest is in the bearish sentiment right now.
US30 Will Collapse! SELL!
My dear subscribers,
US30 looks like it will make a good move, and here are the details:
The market is trading on 46286 pivot level.
Bias - Bearish
My Stop Loss - 46448
Technical Indicators: Both Super Trend & Pivot HL indicate a highly probable Bearish continuation.
Target - 46034
About Used Indicators:
The average true range (ATR) plays an important role in 'Supertrend' as the indicator uses ATR to calculate its value. The ATR indicator signals the degree of price volatility.
Disclosure: I am part of Trade Nation's Influencer program and receive a monthly fee for using their TradingView charts in my analysis.
———————————
WISH YOU ALL LUCK
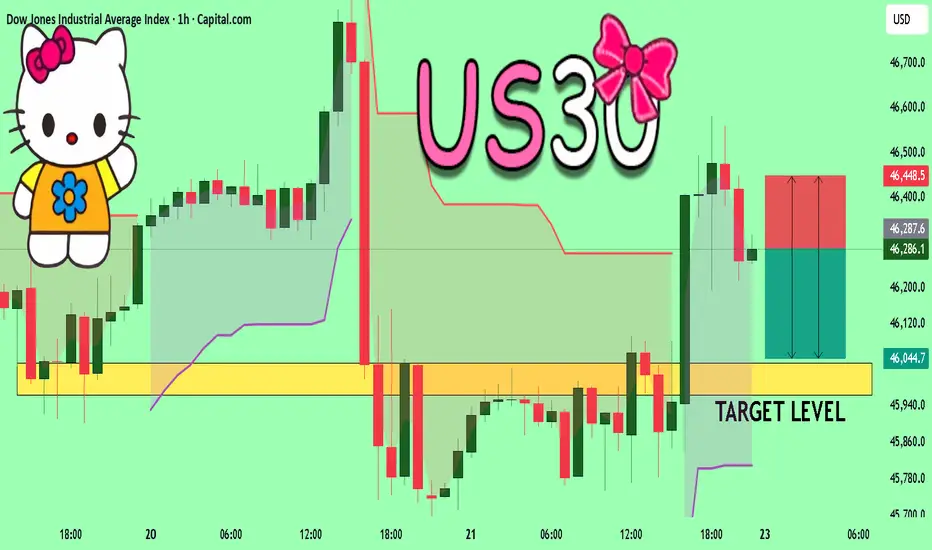
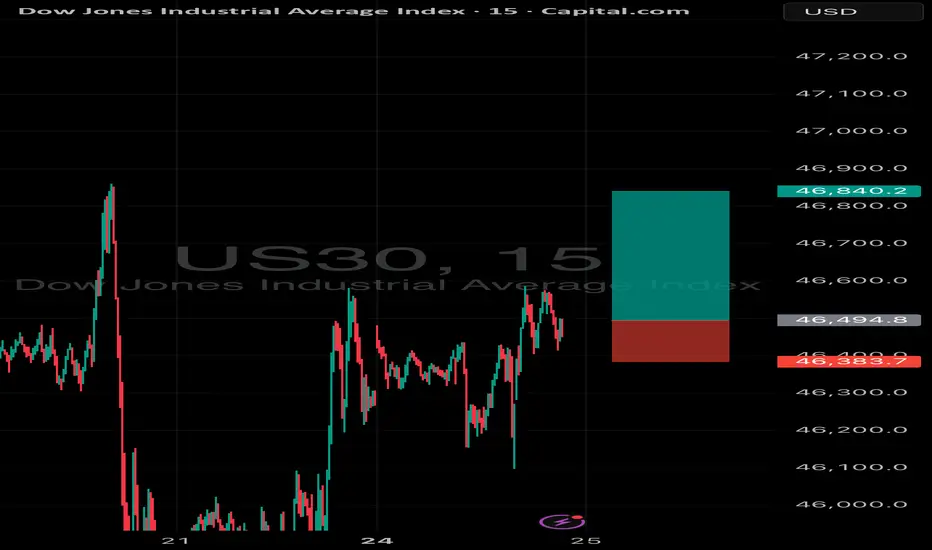
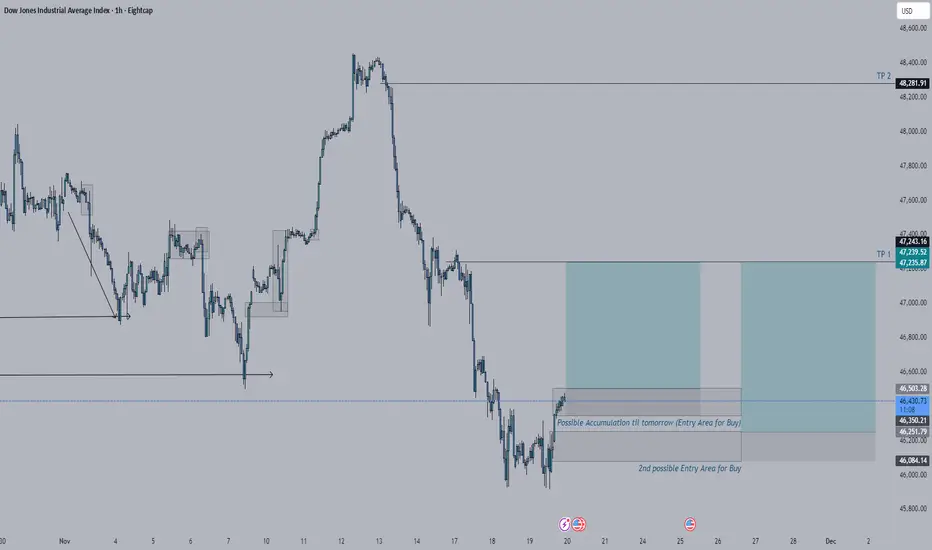
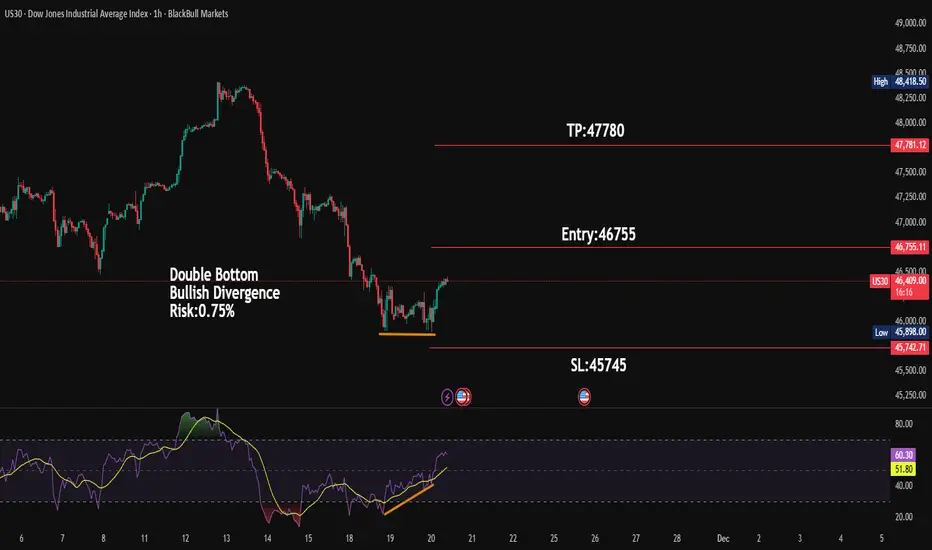
US30 Bullish MovementI'm biased for buy on US30. I have 2 area that I'm watching for entry but I think the market will just be accumulating in one area make a bit of a push to the downside within the area where it is currently accumulating then continue to push the market tomorrow. For TP, I'm actually eyeing more in the TP 2 but there will be going to be a reaction around the TP 1 that will be something to look at for another entry for buy.
DowJones capped at 46550 resistanceKey Support and Resistance Levels
Resistance Level 1: 46550
Resistance Level 2: 46800
Resistance Level 3: 47000
Support Level 1: 45416
Support Level 2: 45240
Support Level 3: 44980
This communication is for informational purposes only and should not be viewed as any form of recommendation as to a particular course of action or as investment advice. It is not intended as an offer or solicitation for the purchase or sale of any financial instrument or as an official confirmation of any transaction. Opinions, estimates and assumptions expressed herein are made as of the date of this communication and are subject to change without notice. This communication has been prepared based upon information, including market prices, data and other information, believed to be reliable; however, Trade Nation does not warrant its completeness or accuracy. All market prices and market data contained in or attached to this communication are indicative and subject to change without notice.

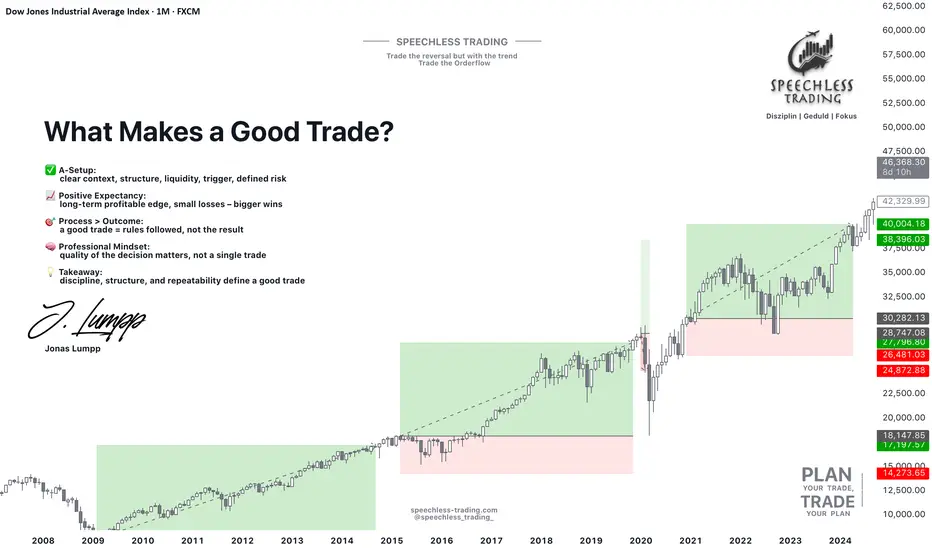
The Anatomy of a Good Trade: Focus on Decisions, Not ResultsLet's find out - what is a good trade?
Most beginners answer: a trade that makes money.
But in professional trading, a good trade has nothing to do with the outcome.
It has everything to do with the quality of the decision.
1️⃣ A good trade starts with an A-Setup:
An A-Setup is not a feeling — it’s a repeatable pattern with structure and logic.
✔ Clear market context
✔ Direction aligned with market structure
✔ Liquidity levels identified
✔ Entry trigger confirmed
✔ Risk defined before the trade
If one of these is missing, it’s no longer an A-Setup — it’s hope.
2️⃣ A good trade has positive expectancy:
Winning one trade means nothing. Winning a sample size of 100 tells you everything.
A positive expectancy means your setup:
loses small - wins bigger - and performs consistently over time
You don’t need to win every trade — you need a system where the average outcome is in your favor.
3️⃣ A good trade follows process, not emotion:
A professional doesn’t judge a trade by profit or loss. They judge it by one question:
“Did I execute my plan without breaking the rules?”
If yes → it was a good trade. Even if it ended in a loss.
Because long-term success comes from repeatable behavior, not from chasing single outcomes.
The Truth:
➡️ A good trade is not defined by green or red.
➡️ A good trade is defined by discipline, structure, and execution.
If beginners understood this idea, half of their frustration would disappear.
Thanks for reading, and have a great start to your trading week!
Let us know in the comments if you found this post valuable - and we might create a full series on applied trading psychology.
Jonas Lumpp
Speechless Trading
Disclaimer: This tutorial is for educational purposes only and does not constitute financial advice. Its goal is to help traders develop a professional mindset, improve risk management, and make more structured trading decisions.
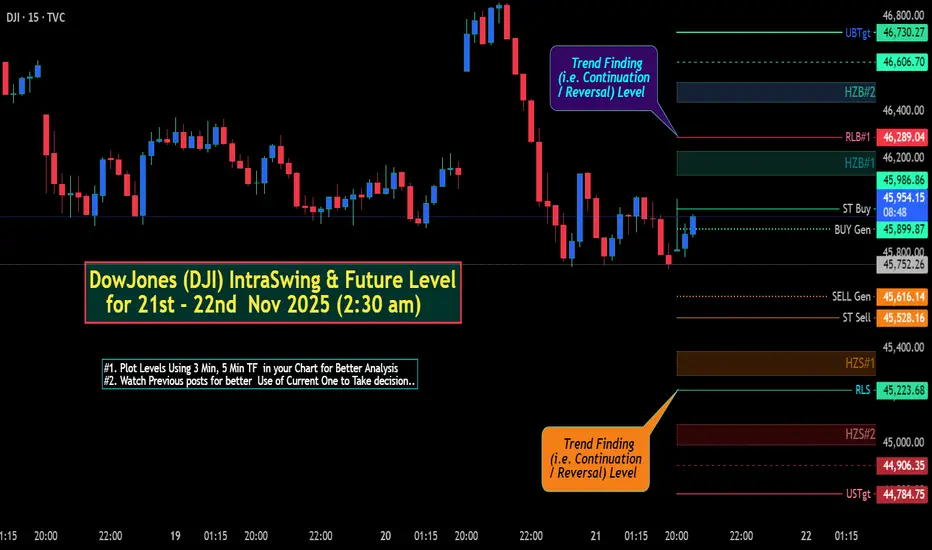
DowJones (DJI) IntraSwing & Future Levels for 21st-22nd Nov'25DowJones (DJI) IntraSwing & Future Level for 21st - 22nd Nov 2025 (2:30 am)
Useful to Tally / Recognize for Next day Trade Plan.
[ Level Interpretation / description:
L#1: If the candle crossed & stays above the “Buy Gen”, it is treated / considered as Bullish bias.
L#2: Possibility / Probability of REVERSAL near RLB#1 & UBTgt
L#3: If the candle stays above “Sell Gen” but below “Buy Gen”, it is treated / considered as Sidewise. Aggressive Traders can take Long position near “Sell Gen” either retesting or crossed from Below & vice-versa i.e. can take Short position near “Buy Gen” either retesting or crossed downward from Above.
L#4: If the candle crossed & stays below the “Sell Gen”, it is treated / considered a Bearish bias.
L#5: Possibility / Probability of REVERSAL near RLS#1 & USTgt
HZB (Buy side) & HZS (Sell side) => Hurdle Zone,
*** Specialty of “HZB#1, HZB#2 HZS#1 & HZS#2” is Sidewise (behaviour in Nature)
Rest Plotted and Mentioned on Chart
Color code Used:
Green =. Positive bias.
Red =. Negative bias.
RED in Between Green means Trend Finder / Momentum Change
/ CYCLE Change and Vice Versa.
Notice One thing: HOW LEVELS are Working.
Use any Momentum Indicator / Oscillator or as you "USED to" to Take entry.
⚠️ DISCLAIMER:
The information, views, and ideas shared here are purely for educational and informational purposes only. They are not intended as investment advice or a recommendation to buy, sell, or hold any financial instruments. I am not a SEBI-registered financial adviser.
Trading and investing in the stock market involves risk, and you should do your own research and analysis. You are solely responsible for any decisions made based on this research.
"As HARD EARNED MONEY IS YOUR's, So DECISION SHOULD HAVE TO BE YOUR's".
Do comment if Helpful .
In depth Analysis will be added later (If time Permits)
US30 H4 | Bearish Reaction off Key ResistanceMomentum: Bearish
Price is currently below the ichimoku cloud, and has broken past the ascending trendline.
Sell entry: 46,971.5
- Strong pullback resistance
- 38.2% Fib retracement
- Fair value gap
Stop Loss: 47,450.69
- Overlap resistance
Take Profit: 46,041.13
- Multi-swing low support
High Risk Investment Warning
Stratos Markets Limited (tradu.com/uk ), Stratos Europe Ltd (tradu.com/eu ):
CFDs are complex instruments and come with a high risk of losing money rapidly due to leverage. 70% of retail investor accounts lose money when trading CFDs with this provider. You should consider whether you understand how CFDs work and whether you can afford to take the high risk of losing your money.
Stratos Global LLC (tradu.com/en ): Losses can exceed deposits.
Please be advised that the information presented on TradingView is provided to Tradu (‘Company’, ‘we’) by a third-party provider (‘TFA Global Pte Ltd’). Please be reminded that you are solely responsible for the trading decisions on your account. Any information and/or content is intended entirely for research, educational and informational purposes only and does not constitute investment or consultation advice or investment strategy. The information is not tailored to the investment needs of any specific person and therefore does not involve a consideration of any of the investment objectives, financial situation or needs of any viewer that may receive it. Past performance is not a reliable indicator of future results. Actual results may differ materially from those anticipated in forward-looking or past performance statements. We assume no liability as to the accuracy or completeness of any of the information and/or content provided herein and the Company cannot be held responsible for any omission, mistake nor for any loss or damage including without limitation to any loss of profit which may arise from reliance on any information supplied by TFA Global Pte Ltd.

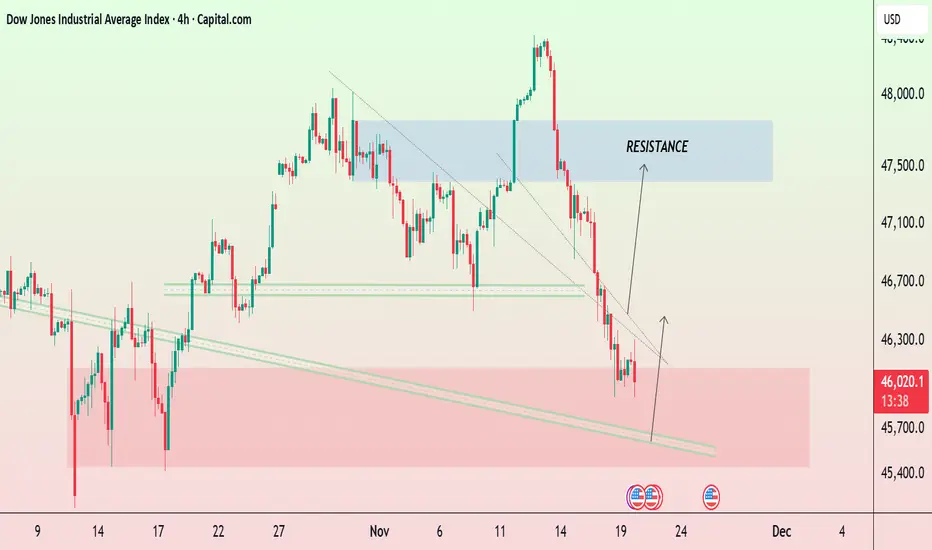
US30 ForecastUS30 Dow Jones is currently declining within a descending channel and approaching a major demand zone near 45,700–45,900 Price has reacted from the lower trendline, signalling potential bullish reversal.
A breakout above the minor descending trendline could trigger a push toward 46,700–47,500 resistance zone the blue zone marks strong supply/resistance where previous rallies were rejected. overall structure shows bearish pressure short-term but potential recovery from support if buyers step in.
"Thank you for your support! If you found this idea valuable or learned something new, please consider liking and leaving a comment. I’d really appreciate hearing your feedback and thoughts."
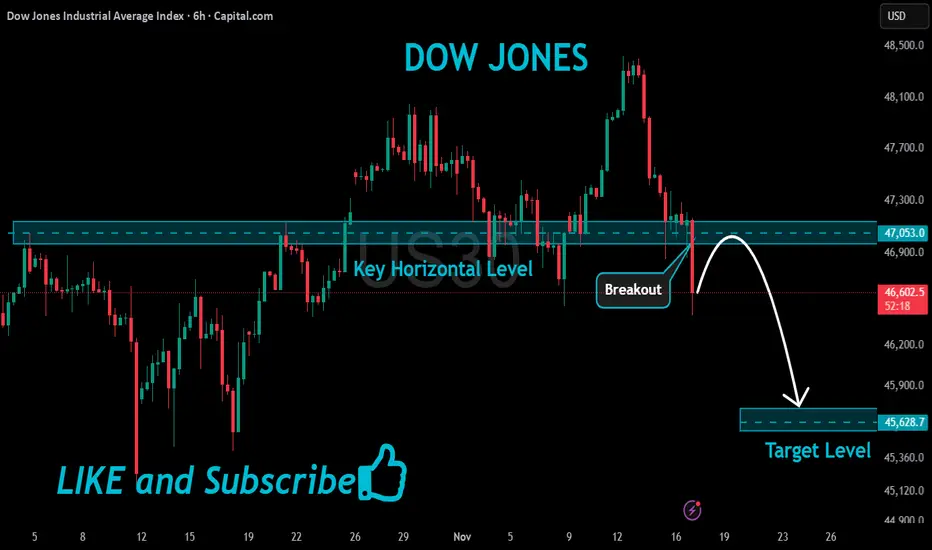
US30 Bearish Breakout!
HI,Traders !
#US30 made a bearish
Breakout of the key horizontal
Level of 47053.0 and the
Breakout is confirmed
So we are bearish biased
And we will be expecting
A further bearish move down !
Comment and subscribe to help us grow !
US30 Trade Secured 2500 Pipsprice manipulated higher into daily FVG and sweeping BSL to then engulf and BOS to the downside to target PDL
