US30 Trade Set Up Nov 28 2025Price remains bullish. Price action isnt the cleanest due to the CME shutdown but i will want to see price sweep PDL, tap into daily FVG to then form 1m-5m IFVG/CISD to continue higher to BSL
Trade ideas

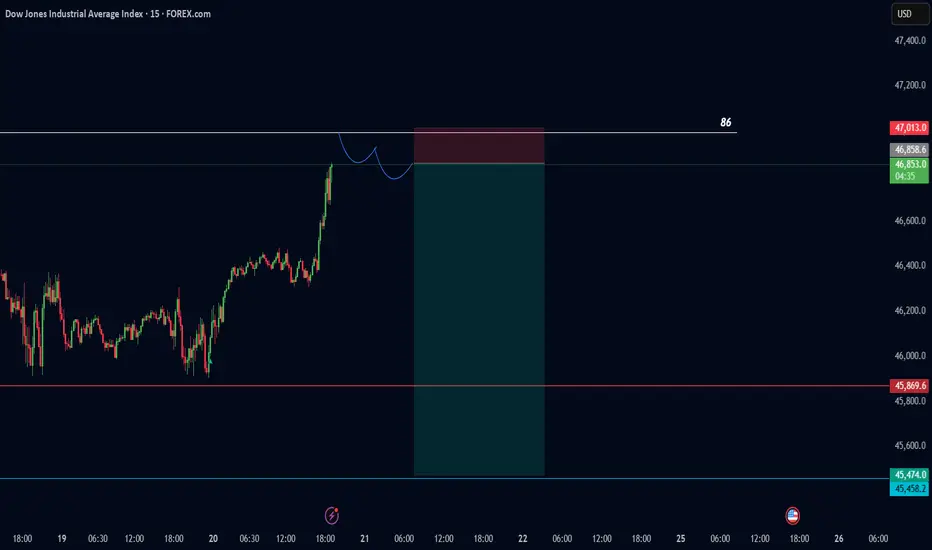
US30 – Big Money Battle | A Clear Institutional FootprintBefore the main move happened, Smart Money had already left a clear footprint.
A bullish Order Block was broken, and a new OB formed at the top — marking an important zone for institutional positioning.
When price retested this OB, a massive clash between Big Money players occurred:
• Large-bodied Doji candle → heavy order absorption
• Abnormal volume spike → strong institutional involvement
After the battle, the winning Big Money group pushed price upward and shifted the structure decisively.
🔍 VVNShark-OB 4-Point Analysis
Market Structure:
A previous bullish OB was broken → early sign of Smart Money movement.
OB + Volume Reaction:
The retest created a huge Doji candle with unusually thick volume.
Liquidity Battle:
Two groups of Big Money fought for control at the exact same price zone.
Outcome:
The winning institutional side pushed price upward with strong displacement.
🦈 Signature
— VNShark-OB | Smart-Money Footprint Analysis
#US30 #DJI #BigMoney #OrderBlock #SmartMoney #Liquidity #VolumeAnalysis #InstitutionalFlow #VSharkOB

us30 BuyInternally price is bullish and also price sweeped the asia low and went to the upside which is a sign to continue higher.

US30 Trade Set Up Nov 25 2025Price remains bullish and has swept SSL already in Asia and London followed by a 1h engulfing and CISD so i will wait for more internal bullish structure on the 5m before looking for buys above PDH to target BSL

US30 Trade Secured 2500 PipsPlayed out perfectly, sweeping SSl and London lows to then engulf and invert on the 5m to target PDL/BSL


US30 Trade Set Up Nov 24 2025Price has swept 1h SSL in London and engulfed 1h bearish candle so i want to see a internal 15m SSL swept followed by 1m-5m IFVG/CISD to target PDH

us30Analysis of the Dow Jones index and forecasts for the coming week's movements in light of the current conflicting data.
Speaker and analysis in Arabic.

us 30 Dow Jones Analysis of the Dow Jones index and forecasts for the coming week's movements in light of the current conflicting data.
Speaker and analysis in Arabic.


US30 - CLS Monthly vs Daily US30
Monthly CLS Range ,
2nd candle is forming
On the Daily timeframe, if price pulls back, a potential entry lies at the BPR zone, which acts as a strong confluence area.
🎯 Target: 50% level → 46,639.6
Mentor :
@David_Perk

US30 Trade Set Up Nov 21 2025As of right now price is in a range so i want to see internal structure form first to either sweep BSL followed but 1m-5m CISD/IFVG to target lows again or a push higher to fill 4h FVG

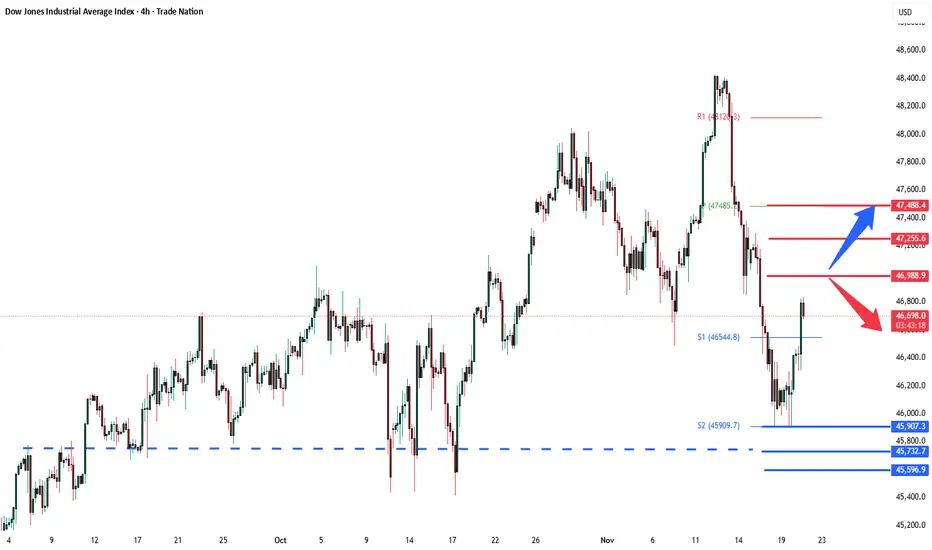
The us30-dow jones could have a drop.Dow Jones could experience a drop at the specified price, so look for confirmation according to the drawn schematic, and you could make a nice trade.
Make sure to get confirmation.
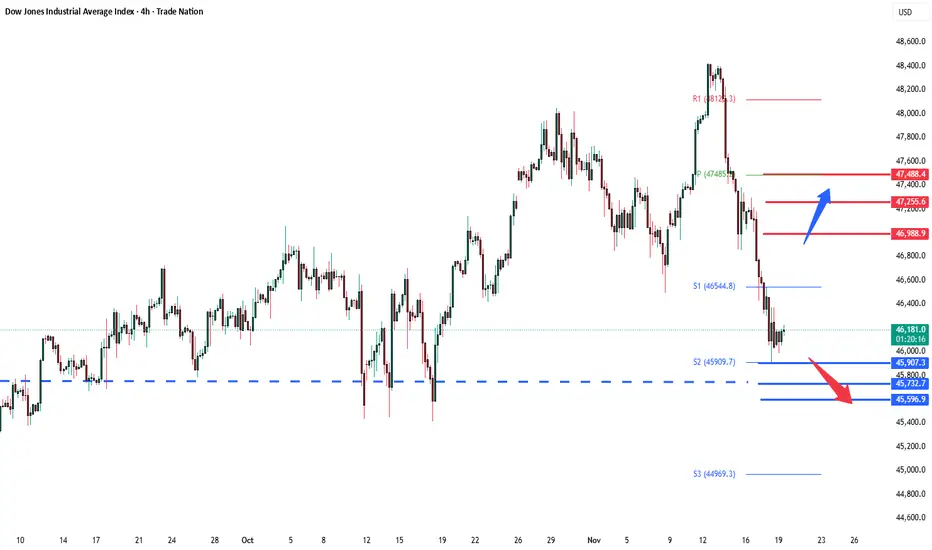
DowJones Key Trading LevelsKey Support and Resistance Levels
Resistance Level 1: 46988
Resistance Level 2: 47255
Resistance Level 3: 47488
Support Level 1: 45907
Support Level 2: 45732
Support Level 3: 45600
This communication is for informational purposes only and should not be viewed as any form of recommendation as to a particular course of action or as investment advice. It is not intended as an offer or solicitation for the purchase or sale of any financial instrument or as an official confirmation of any transaction. Opinions, estimates and assumptions expressed herein are made as of the date of this communication and are subject to change without notice. This communication has been prepared based upon information, including market prices, data and other information, believed to be reliable; however, Trade Nation does not warrant its completeness or accuracy. All market prices and market data contained in or attached to this communication are indicative and subject to change without notice.
DowJones (DJI) IntraSwing & Future Level for 20th-21st Nov 2025DowJones (DJI) IntraSwing & Future Level for 20th - 21st Nov 2025 (2:30 am)
Useful to Tally / Recognize for Next day Trade Plan.
[ Level Interpretation / description:
L#1: If the candle crossed & stays above the “Buy Gen”, it is treated / considered as Bullish bias.
L#2: Possibility / Probability of REVERSAL near RLB#1 & UBTgt
L#3: If the candle stays above “Sell Gen” but below “Buy Gen”, it is treated / considered as Sidewise. Aggressive Traders can take Long position near “Sell Gen” either retesting or crossed from Below & vice-versa i.e. can take Short position near “Buy Gen” either retesting or crossed downward from Above.
L#4: If the candle crossed & stays below the “Sell Gen”, it is treated / considered a Bearish bias.
L#5: Possibility / Probability of REVERSAL near RLS#1 & USTgt
HZB (Buy side) & HZS (Sell side) => Hurdle Zone,
*** Specialty of “HZB#1, HZB#2 HZS#1 & HZS#2” is Sidewise (behaviour in Nature)
Rest Plotted and Mentioned on Chart
Color code Used:
Green =. Positive bias.
Red =. Negative bias.
RED in Between Green means Trend Finder / Momentum Change
/ CYCLE Change and Vice Versa.
Notice One thing: HOW LEVELS are Working.
Use any Momentum Indicator / Oscillator or as you "USED to" to Take entry.
⚠️ DISCLAIMER:
The information, views, and ideas shared here are purely for educational and informational purposes only. They are not intended as investment advice or a recommendation to buy, sell, or hold any financial instruments. I am not a SEBI-registered financial adviser.
Trading and investing in the stock market involves risk, and you should do your own research and analysis. You are solely responsible for any decisions made based on this research.
"As HARD EARNED MONEY IS YOUR's, So DECISION SHOULD HAVE TO BE YOUR's".
Do comment if Helpful .
In depth Analysis will be added later (If time Permits)


Us30 before NFP newsMy directional bias was bullish according to how yesterday's Daily candle closed and the change of trend

US30 Trade Set Up Nov 20 2025Over all im still bearish for indices so i want to see a sweep of BSL and tap into fib levels to then wait for for 5m-15m bearish engulfing and CISD/IVFG to target SSL/PDL

Dow into the open.Thursday 20th NovemeberLooks very sad,..trying to get happy with a new uptrend
Will it succeed.?

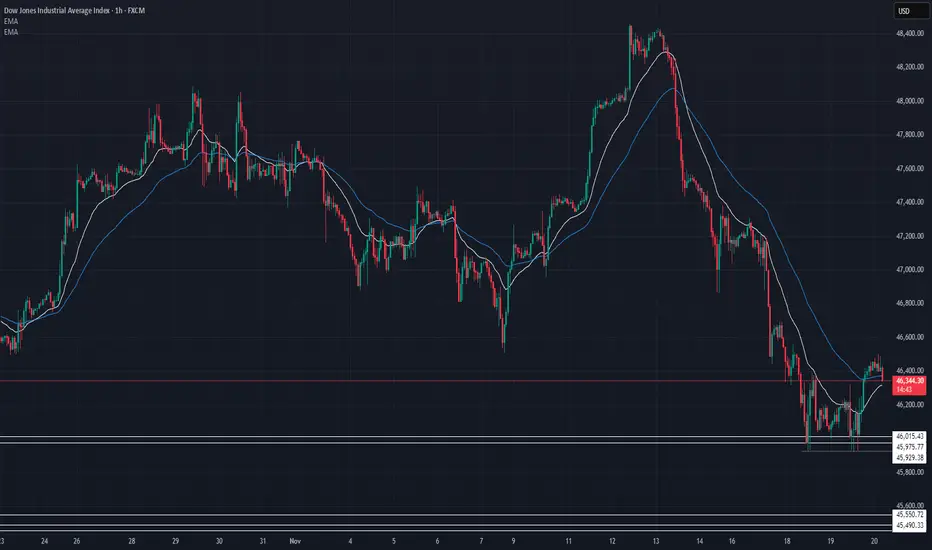
US30 Technical Breakdown – 11/20/2025📍 US30 Technical Breakdown – 11/20/2025
US30 finally found temporary support around 45,950–46,000 after a massive selloff from the 48,400 highs. Price is now retracing into the EMA zone, but momentum is still bearish overall — meaning this bounce may just be a pullback unless buyers reclaim key levels 👀📉.
📊 Market Behavior:
🔹 Heavy downside momentum after failing to hold 47,600
🔹 EMAs still stacked bearish → sellers in control
🔹 Current move = corrective bounce into resistance
📌 Key Levels:
🔹 Resistance:
46,600 → current retest zone (EMA rejection likely)
46,800 → strong intraday supply / former support
47,000 → major pivot level
🔹 Support:
46,150 → intraday bounce area
45,975 → structure support
45,929 → micro-demand
45,600 → next major liquidity pocket
🧠 Bias:
Bearish momentum still dominant 📉
⬇️ Rejection under 46,600 → continuation lower
⬆️ Break + hold above 46,800 → opens room toward 47,000–47,200
US30 Trade Secured 1500 PipsSet up played out perfectly, BOS on the 1h, sweep SSL, 5m IFVG and engulfing candle to move up towards BSL

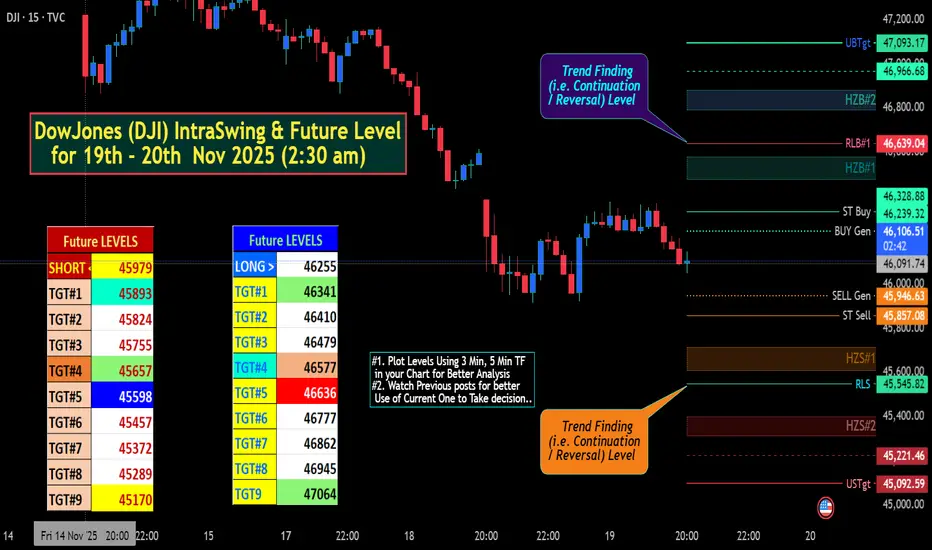
DowJones (DJI) IntraSwing & Future Level for 19th-20th Nov 2025DowJones (DJI) IntraSwing & Future Level for 19th - 20th Nov 2025 (2:30 am)
✍🏼️ "Future IntraSwing Levels" mentioned in BOX format.
Useful to Tally / Recognize for Next day Trade Plan.
[ Level Interpretation / description:
L#1: If the candle crossed & stays above the “Buy Gen”, it is treated / considered as Bullish bias.
L#2: Possibility / Probability of REVERSAL near RLB#1 & UBTgt
L#3: If the candle stays above “Sell Gen” but below “Buy Gen”, it is treated / considered as Sidewise. Aggressive Traders can take Long position near “Sell Gen” either retesting or crossed from Below & vice-versa i.e. can take Short position near “Buy Gen” either retesting or crossed downward from Above.
L#4: If the candle crossed & stays below the “Sell Gen”, it is treated / considered a Bearish bias.
L#5: Possibility / Probability of REVERSAL near RLS#1 & USTgt
HZB (Buy side) & HZS (Sell side) => Hurdle Zone,
*** Specialty of “HZB#1, HZB#2 HZS#1 & HZS#2” is Sidewise (behaviour in Nature)
Rest Plotted and Mentioned on Chart
Color code Used:
Green =. Positive bias.
Red =. Negative bias.
RED in Between Green means Trend Finder / Momentum Change
/ CYCLE Change and Vice Versa.
Notice One thing: HOW LEVELS are Working.
Use any Momentum Indicator / Oscillator or as you "USED to" to Take entry.
⚠️ DISCLAIMER:
The information, views, and ideas shared here are purely for educational and informational purposes only. They are not intended as investment advice or a recommendation to buy, sell, or hold any financial instruments. I am not a SEBI-registered financial adviser.
Trading and investing in the stock market involves risk, and you should do your own research and analysis. You are solely responsible for any decisions made based on this research.
"As HARD EARNED MONEY IS YOUR's, So DECISION SHOULD HAVE TO BE YOUR's".
Do comment if Helpful .
In depth Analysis will be added later (If time Permits)
DowJones support retest at 45907Key Support and Resistance Levels
Resistance Level 1: 46988
Resistance Level 2: 47255
Resistance Level 3: 47488
Support Level 1: 45907
Support Level 2: 45732
Support Level 3: 45600
This communication is for informational purposes only and should not be viewed as any form of recommendation as to a particular course of action or as investment advice. It is not intended as an offer or solicitation for the purchase or sale of any financial instrument or as an official confirmation of any transaction. Opinions, estimates and assumptions expressed herein are made as of the date of this communication and are subject to change without notice. This communication has been prepared based upon information, including market prices, data and other information, believed to be reliable; however, Trade Nation does not warrant its completeness or accuracy. All market prices and market data contained in or attached to this communication are indicative and subject to change without notice.