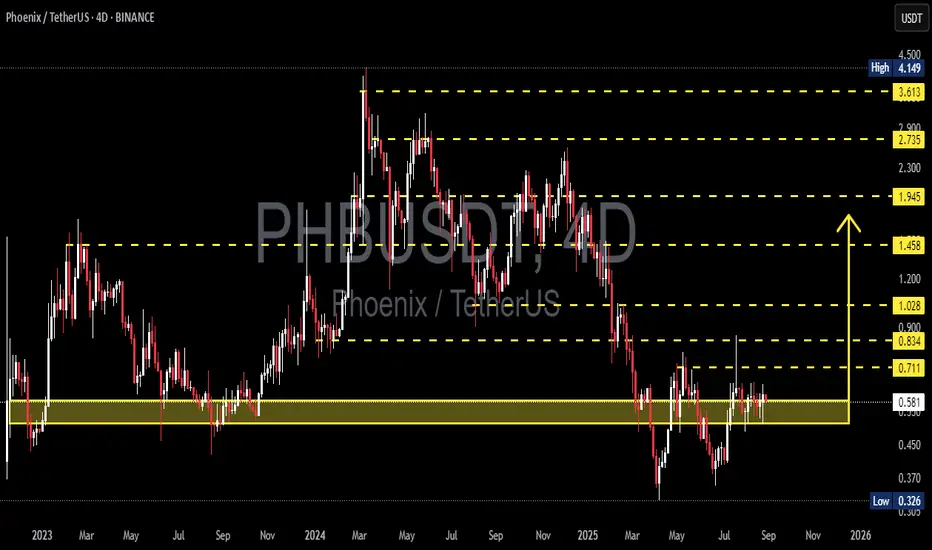
PHB/USDT — Holding the Demand Zone, Awaiting Major Breakout?Currently, PHB/USDT is consolidating within a critical demand zone at 0.52 – 0.62. This area has repeatedly acted as a strong floor since 2023, absorbing heavy sell-offs and showing signs of accumulation.
The market structure suggests that PHB is forming a range-base accumulation pattern, with 0.71
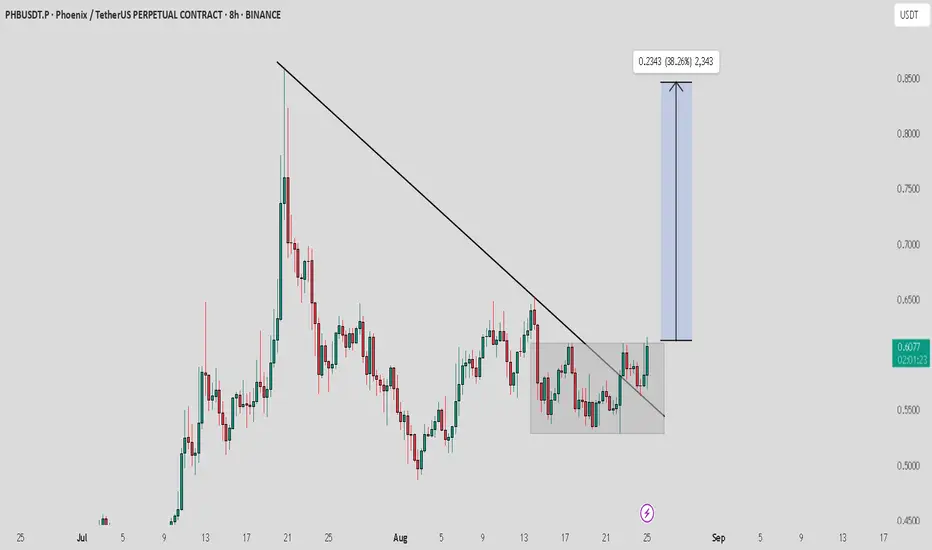
PHB / USDT : Looking bullish..Waiting for box breakoutPHB/USDT has broken above its trendline resistance after a period of consolidation. This breakout is showing strong potential, and if momentum sustains, price could rally toward the $0.80–0.85 zone.
Best approach: Wait for confirmation on retest or a strong bullish candle with volume before enterin
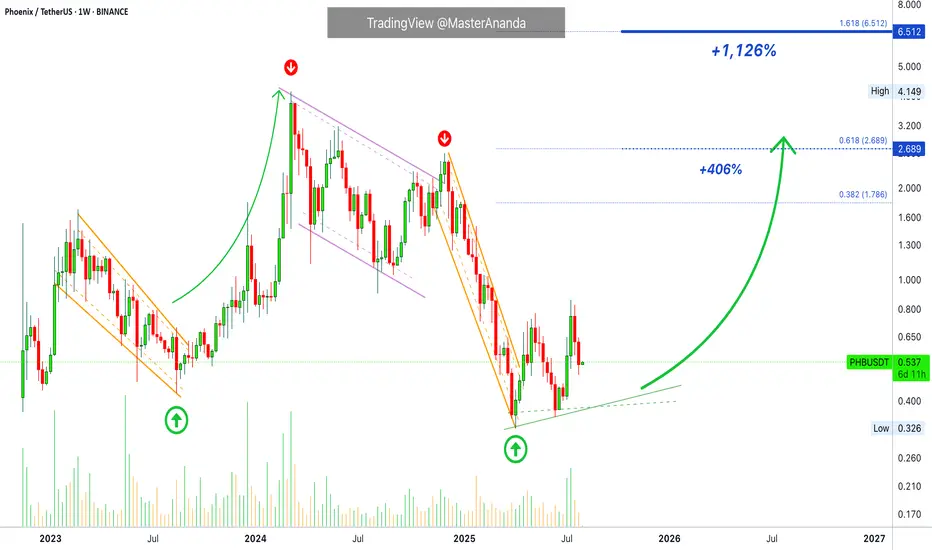
Phoenix Recovers · Easy 1,126% Target @ $6.5 Phoenix is just coming out of a major downtrend. After the main low there was a higher low and rising buy volume. Whenever there is a down wave that ends in strong buying, we know the market is about to turn, we have proof here.
PHBUSDT produced a down move in February 2023. Prices moved lower and
PHBUSDT Bounces from the Golden Pocket?🧠 Market Context & General Analysis
Phoenix (PHB) is currently at a critical juncture in its market structure. After a prolonged downtrend from its 2024 highs, price has now reacted strongly off a key Fibonacci Golden Pocket retracement zone (0.5–0.618), which also aligns with a historically respec

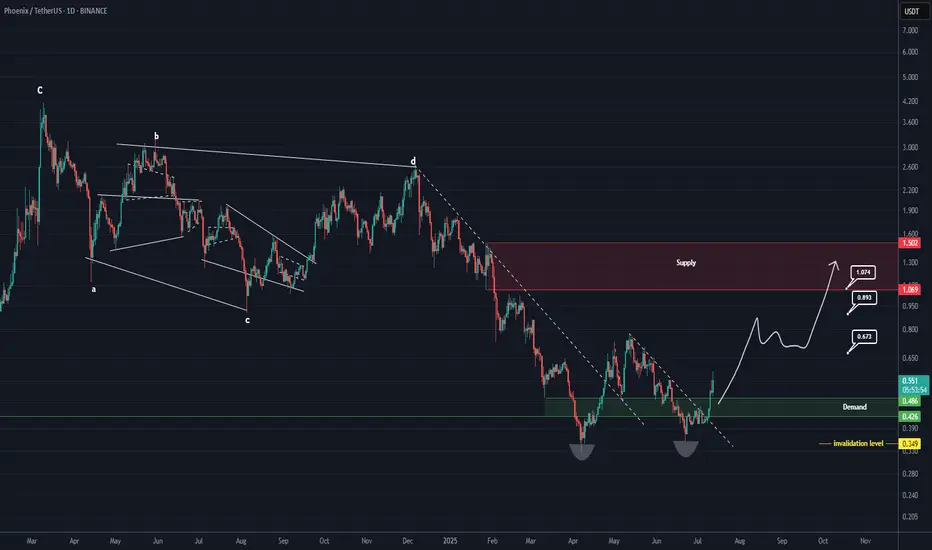
PHB Looks Bullish (1D)It appears that wave E has ended after a long consolidation and the formation of a double bottom. A key trigger line has been broken, and the price has reclaimed the flip zone (marked in green).
As long as the green zone holds, the price can move toward the targets and the red box.
The targets are
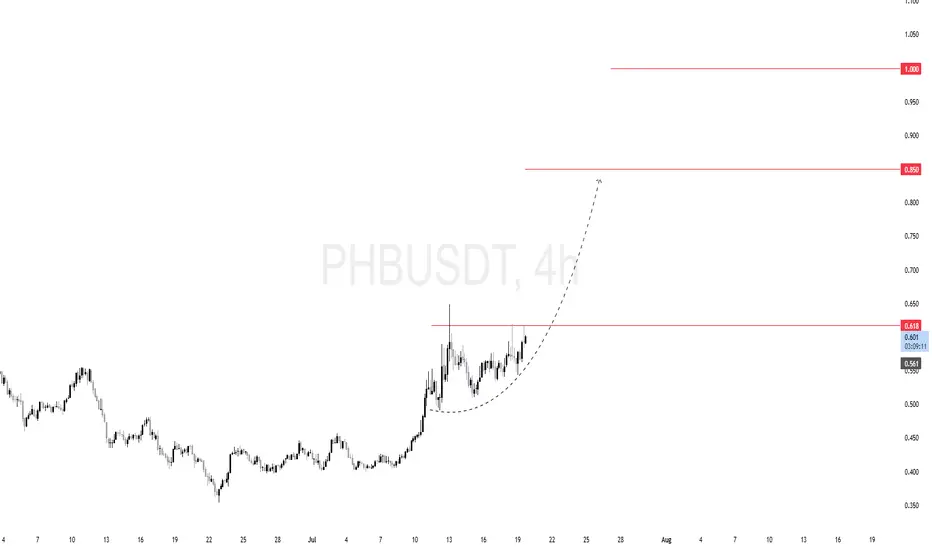
$PHB (PHBUSDT) 4HPrice spent several sessions consolidating below the $0.618 resistance zone. This horizontal level has been tested multiple times, building up buy-side liquidity above it.
We're seeing a rounded base formation — a classic bullish continuation pattern. It signals strong demand and positioning by sma
PHB ANALYSIS🔮#PHB Analysis :
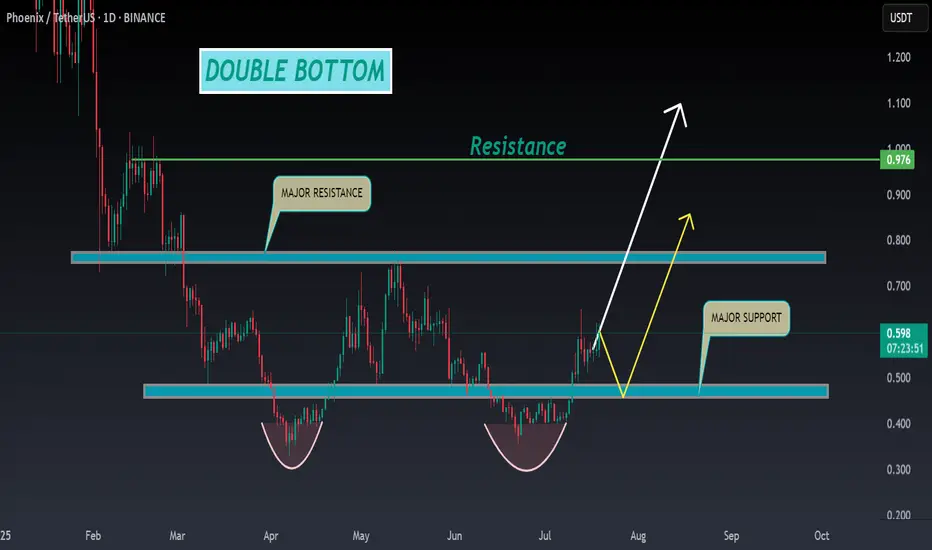
📈📈 #PHB is making perfect Double Bottom Pattern. We can see a good pump if #PHB breakout the major resistance zone with good volume and sustains the higher price after breakout 🚀🚀
📊 Current Price: $0.595
⏳ Target Price: $0.780
⁉️ What to do?
- We can trade according to the cha
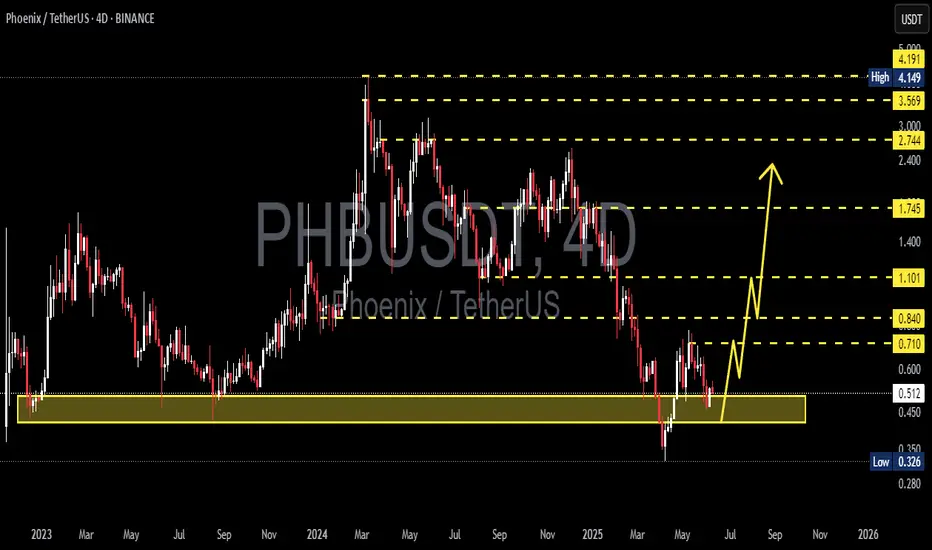
PHBUSDT 4D AnalysisPHB ~ 4D Analysis
#PHB This trade is very High risk, Buy gradually from here if you still have confidence in this coin with a short term target of at least 15%+ from here.
PHB/USDT trendline breakout alertPHB/USDT trendline breakout alert
PHB has broken above a key descending trendline, signaling a potential shift in momentum from bearish to bullish. Trendline breakouts often indicate the end of a correction or consolidation phase and the beginning of a new trend.
If PHB holds above the breakout le

Phb near term.In my opinion, this is the most likely scenario.
* The purpose of my graphic drawings is purely educational.
* What i write here is not an investment advice. Please do your own research before investing in any asset.
* Never take my personal opinions as investment advice, you may lose your money.

See all ideas
Summarizing what the indicators are suggesting.
Oscillators
Neutral
SellBuy
Strong sellStrong buy
Strong sellSellNeutralBuyStrong buy
Oscillators
Neutral
SellBuy
Strong sellStrong buy
Strong sellSellNeutralBuyStrong buy
Summary
Neutral
SellBuy
Strong sellStrong buy
Strong sellSellNeutralBuyStrong buy
Summary
Neutral
SellBuy
Strong sellStrong buy
Strong sellSellNeutralBuyStrong buy
Summary
Neutral
SellBuy
Strong sellStrong buy
Strong sellSellNeutralBuyStrong buy
Moving Averages
Neutral
SellBuy
Strong sellStrong buy
Strong sellSellNeutralBuyStrong buy
Moving Averages
Neutral
SellBuy
Strong sellStrong buy
Strong sellSellNeutralBuyStrong buy
Displays a symbol's price movements over previous years to identify recurring trends.