Navigating the 23,200 Battleground – Squeeze Before the Surge?🇩🇪 GER40 Navigating the 23,200 Battleground – Squeeze Before the Surge? | 25 Nov
Live Spot: 23,215.0 | European Open Session | 09:43 UTC+4
━━━━━━━━━━━━━━━━━━━━━━━━━━━━━━
🔍 Structural Context
The German index finds itself locked within a compression zone after Friday's aggressive run toward 23,300. Price is now coiling tightly beneath overhead supply, with sellers capping advances near the upper Bollinger envelope. The broader Dow Theory structure remains constructive – higher highs and higher lows on the daily chart confirm an intact uptrend, though intraday momentum shows hesitation.
📊 Timeframe Dissection
5M/15M: Choppy price action oscillating between 23,180 and 23,260. RSI hovering at midline (48-52 range), indicating indecision. Scalpers should await a clean break of this micro-range.
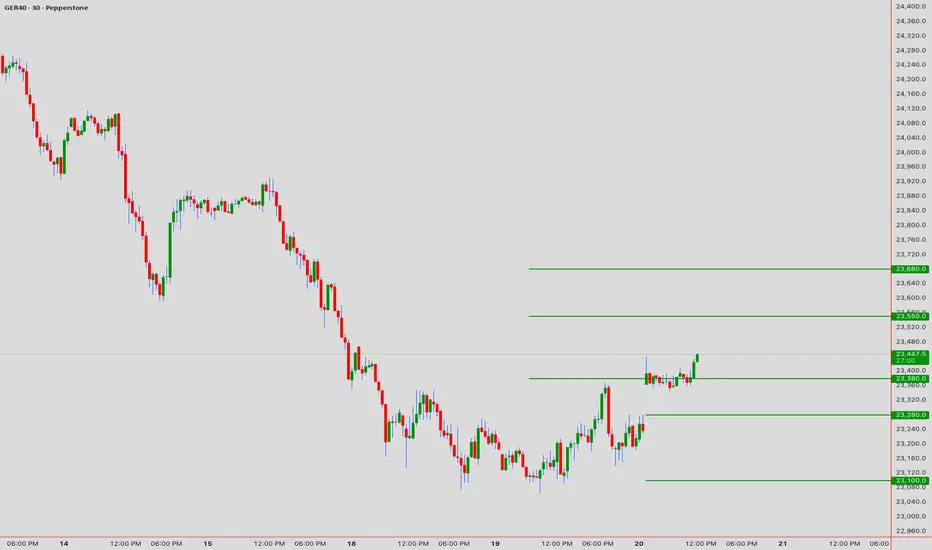
30M: A subtle bullish flag materializing post last week's rally leg. Pole measured at 180 points suggests a breakout target near 23,440.
1H: VWAP stationed at 23,205 – acting as the session's equilibrium line. Price trading marginally above signals mild buyer control.
4H: Ichimoku reveals price riding above the Kumo cloud with Chikou Span confirming bullish alignment. However, flat Senkou Span B hints at consolidation ahead.
🎯 Critical Price Architecture
Upside Barrier: 23,280 – 23,350 (supply shelf + 1.618 Fib extension zone)
Downside Floor: 23,120 – 23,050 (demand pocket + rising 21 SMA confluence)
🔮 Wave & Pattern Synthesis
From an Elliott lens, GER40 appears mid-flight within wave of a five-wave impulse originating from early November lows. The corrective wave terminated cleanly at 22,900, and current price behavior suggests accumulation before the next thrust. Gann time analysis points to potential acceleration post 10:30 UTC today.
Wyckoff interpretation aligns with Phase D markup – signs of strength evident as price absorbs selling pressure without meaningful retracement.
━━━━━━━━━━━━━━━━━━━━━━━━━━━━━━
💎 Primary Setup – Long Momentum Play
Entry Zone: 23,180 – 23,210 (demand retest)
Stop Loss: 23,090 (below structural floor)
Target 1: 23,320 (initial resistance)
Target 2: 23,420 (flag projection)
R:R Ratio: ~1:2.8
💎 Secondary Setup – Fade at Resistance
Entry: 23,340 – 23,360 (on exhaustion candle)
Stop Loss: 23,410
Take Profit: 23,220
━━━━━━━━━━━━━━━━━━━━━━━━━━━━━━
⚠️ Session Caution: German IFO data release could inject volatility. Pre-position with reduced size until post-news price discovery completes.
Discipline over prediction. Execute the plan. 🎯
Trade ideas

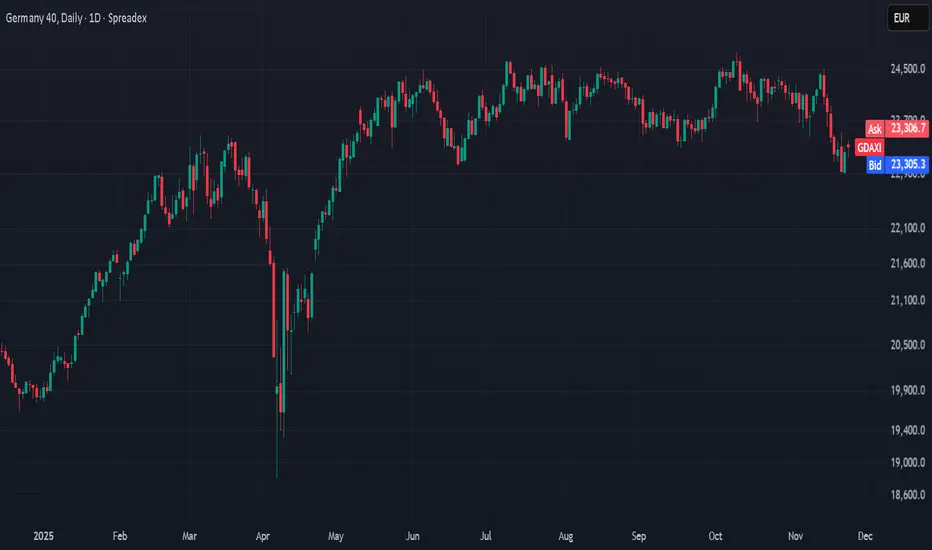
Technical Analysis WeeklyGermany 40 looks bearish with a possible breakdown from its current trading range. Trading at 23,283 and below the VWAP of 23,710, RSI at 39.7 supports a more negative sentiment. Support lies at 22,917, while resistance is at 24,504.
Wall Street remains bullish but is now in a correction phase, trading at 46,237 under the VWAP at 46,953. RSI at 42.2 suggests weakening momentum and potential for deeper pullback. Support is at 45,684, resistance at 48,223.
UK 100 continues to trend bullishly but has entered a correction phase. Price is at 9,567, beneath the VWAP of 9,686. RSI at 45.3 reflects neutral to soft momentum. Support is 9,456, with resistance at 9,915.
GBP/USD remains bearish and in a sideways correction. Price is 1.3122, slightly below the VWAP at 1.30914 and broken support at 1.3150. RSI of 38.6 suggests limited rebound potential. Support is 1.3034, resistance at 1.3208.
EUR/USD continues in a bearish leg of an otherwise neutral market, having not broken down past major support. The price is 1.1548 right at the VWAP. RSI at 44.7 indicates ongoing indecision. Support sits at 1.1470, resistance at 1.1638.
USD/JPY holds a bullish impulse structure, trading at 157.41 above the VWAP of 156.85, however there was a bearish engulfing candlestick at resistance from the January peak. RSI at 68.4 - down from very overbought levels signals slowing upwards momentum. Support is at 152.18, resistance at 157.41.
Gold remains in a correction of its bullish trend, trading at 4,069 just above VWAP of 4,068.94. The correction is contracting, which will lead to a resumption of the trend or an extended correction. RSI at 51.0 indicates balanced momentum. Support is 3,916 with resistance at 4,196.
Brent Crude has broken down to its lowest levels since October but remains above the critical $60 level, with price at 6,191 below VWAP at 6,357. RSI at 40.3 reflects downside pressure. Support is 6,105 and resistance is 6,553.
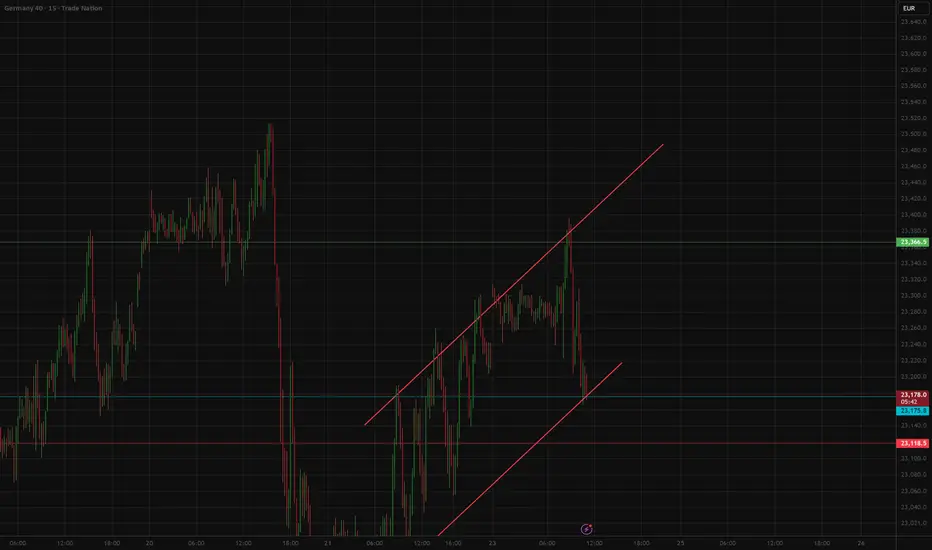
Buying DAX on retracement for RR 1:3 Bull channel is forming after last weeks bloodbath in all markets. Here is an opportunity to buy the DAX with a Risk Reward of around 3.
Buying in the bottom of the bull channel on retracement with possibility to add more or hope for a new high.
Dax.Monday 24th NovemberA wodge of resistance is looming.Above 23400 does not seem to be liked
Latest movement is a bullish pattern
Lets see what happens

DAX DOMINANCE: GER40 Precision Technical Matrix
Asset: GER40 (DAX Index)
Current Price: 23,290.00
Date: November 24, 2025
Market Sentiment: The German index is trading at stratospheric levels, testing the 23,300 psychological ceiling. Institutional algorithms are fighting for control between a breakout continuation and a mean-reversion correction.
📊 Technical Indicators & Momentum Analysis
Trend Structure: The primary trend is STRONGLY BULLISH 🐂 on the Daily timeframe. However, the 1H chart shows a "Rising Wedge" formation, often a precursor to a bearish reversal.
Relative Strength Index (RSI): Currently at 68.0 . We are approaching overbought territory. A bearish divergence is visible between price highs and RSI peaks, signaling waning momentum.
Bollinger Bands: Price is testing the Upper Band deviation. A failure to close above 23,310 could trigger a snap-back to the 20-period SMA (Mid-Band).
📐 Fibonacci & Harmonic Patterns
Fibonacci Extension: The current rally has hit the 1.272 extension of the previous correction. The next major resistance aligns with the 1.414 extension at 23,350 .
Harmonic Pattern: A Bearish Butterfly Pattern is nearing completion. The Potential Reversal Zone (PRZ) is calculated between 23,320 and 23,350.
🛡️ Support and Resistance Levels
Resistance 1: 23,320 (Harmonic PRZ)
Resistance 2: 23,400 (Psychological Round Number)
Support 1: 23,220 (Previous High / Support Flip)
Support 2: 23,150 (0.382 Fib Retracement)
🎯 Strategic Trade Setups
Scenario A: The Reversal (Short)
Valid if price rejects the 23,320 zone with a bearish pin bar.
Entry: Below 23,280
Target 1: 23,220
Target 2: 23,150
Stop Loss: 23,360
Scenario B: Breakout Continuation (Long)
If price closes above 23,350 on strong volume.
Entry: Retest of 23,350
Target: 23,450
Stop Loss: 23,300
⚠️ Summary: Caution is advised. The confluence of the Bearish Butterfly pattern and RSI divergence suggests a high probability of a pullback from the 23,320 region. We favor Scenario A for the intraday session. 📉🇩🇪
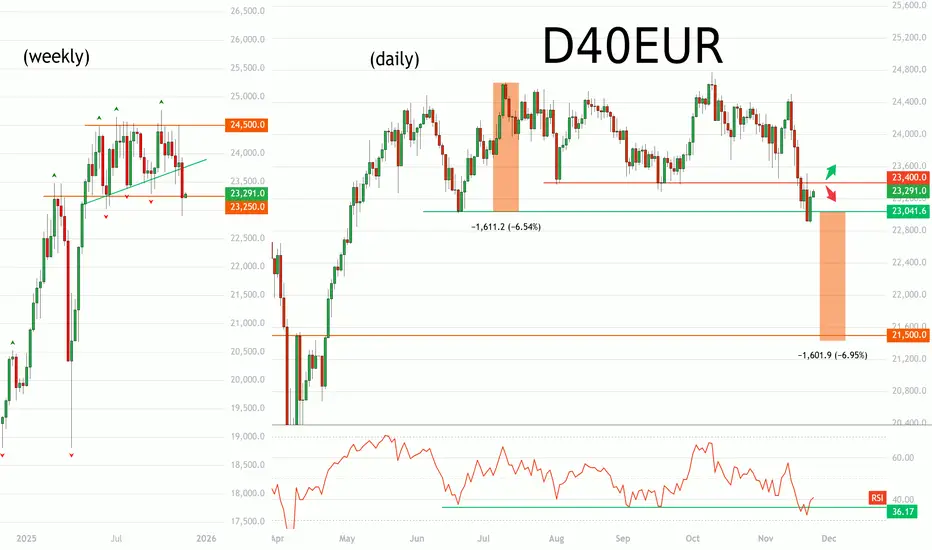
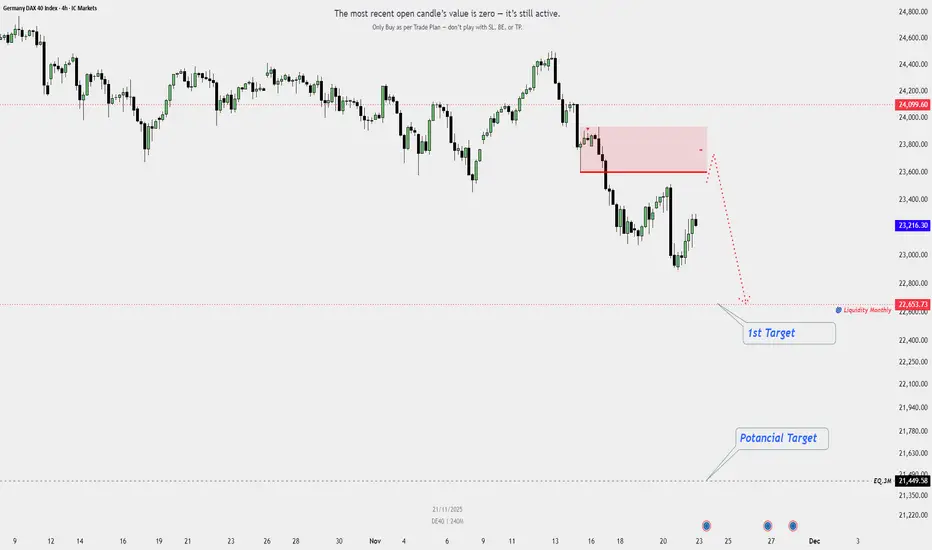
German stocks about to drop 7%? (DAX 40)Setup
Breakdown from horizontal range
Lowest weekly close since June
Breakdown below ‘green’ weekly trendline
RSI back at 35-40 support
Commentary
The DAX is sitting right on the support level of its long term range. The index could rally back into its range, offering reversal setups to go long, or it could continue to breakdown. Should it be the latter, projecting the height of the range lower would target 21500 - a demand area preceding the April rally.
Strategy
Option 2: Sell rebound towards 48,000 supply zone
Option 1: Sell the breakdown below 23,000
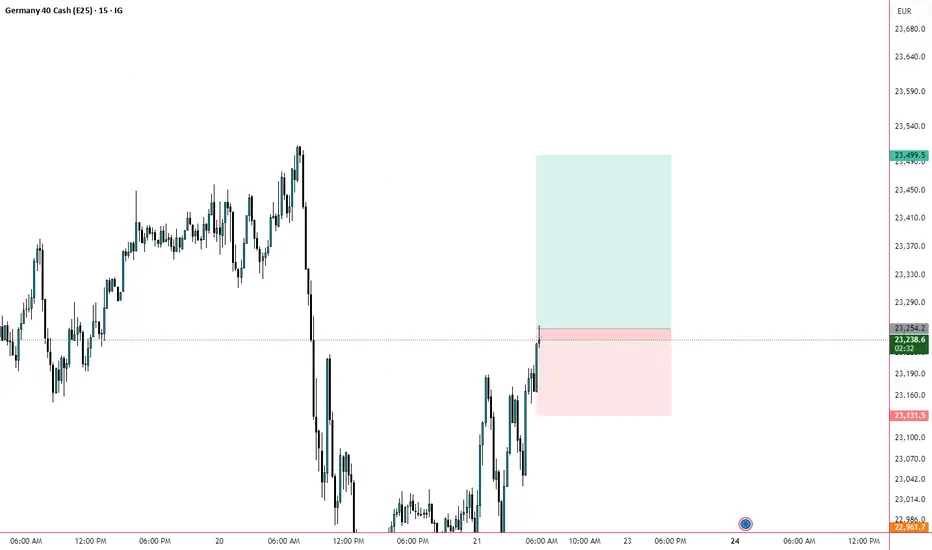
Germany Dax Bearish StructureGermany Dax Bearish Structure
trading inside monthly bullish fvg.
i a m expecting 2 cr rejaction .
so recently we have some liqudity siting below,
monthly Liqudity.
Point of intrest marked on chart.
Dax into the the open.Friday 21st NovmberPossible area of resistance to scare off the bulls.That might not happen
Its tring to get positive
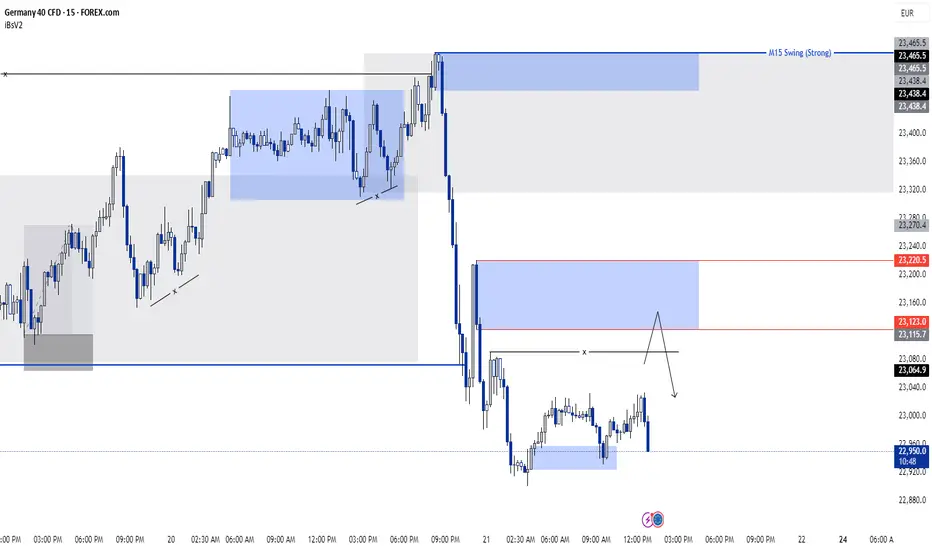
GER40 SELL IDEAIn GER40 analysis we can see that our daily , h4 and m15 timeframes are bearish.. now we're just analysing m15 time frame and in m15 time frame we can see m15 structure is clearly bearish so now it will do pullback .as i marked 2 blue zones which are m15 demand zone for sell... by my perspective from the downside first blue zone(23220.5 - 23123.0),from this zone the market will give us sell entry and till we'll patiently wait ....let's see... :)
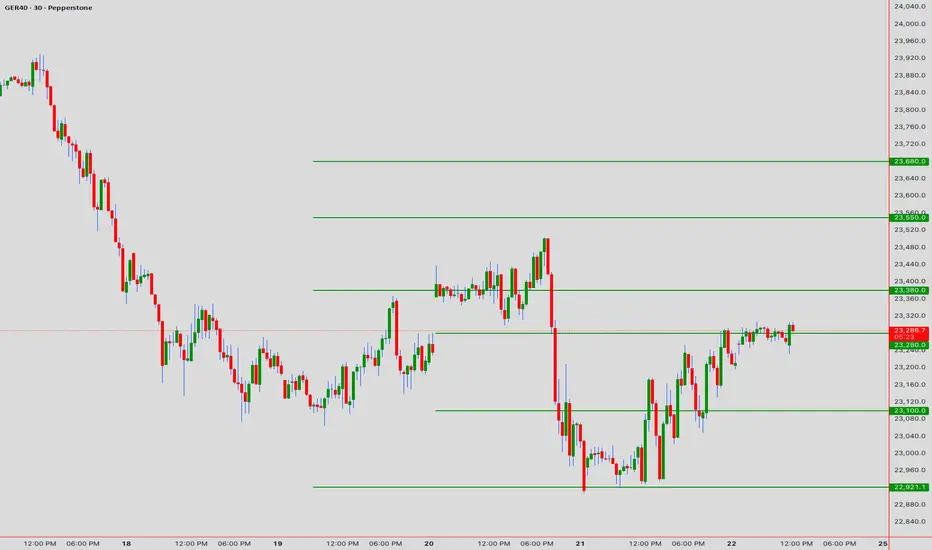
DAX/GER - let puck up the entry againTeam, last week, we got our target hit before the BIG dump again yesterday
Found a good entry for DAX at this level 22993-22965
STOP LOSS at 22860
Once it break above 23060, bring stop loss to BREAK EVEN
Target 1 at 23085-23115
Target 2 at 23160-23189
Target 3 at 23230-23500
LETS GO
sell DAXgerman DAX now super bearish, price broke its horizontal price range,while VIX coming up strong, there is a lot of downside to anticipate here.
German economy is lacking gdp growth for 3 years in a row now and the outlook is even worse, its about time to sell DAX.

DAX Germany 40 index Sell planSwept PWH.
Market structure shift.
Targetting liqudity Sitting below.
waiting for an pullback above in point of intrest.

DAX40 bearish below resistance at 23550The DAX40 is currently trading with a bearish bias, aligned with the broader downward trend. Recent price action shows a retest of the support, suggesting a possibility of a temporary relief rally within the downtrend.
Key resistance is located at 23550, a prior consolidation zone. This level will be critical in determining the next directional move.
A bearish rejection from 23550 could confirm the resumption of the downtrend, targeting the next support levels at 23093, followed by 22800 and 22580 over a longer timeframe.
Conversely, a decisive breakout and daily close above 23550 would invalidate the current bearish setup, shifting sentiment to bullish and potentially triggering a move towards 23790, then 23980.
Conclusion:
The short-term outlook remains bearish unless the DAX40 breaks and holds above 23550. Traders should watch for price action signals around this key level to confirm direction. A rejection favours fresh downside continuation, while a breakout signals a potential trend reversal or deeper correction.
This communication is for informational purposes only and should not be viewed as any form of recommendation as to a particular course of action or as investment advice. It is not intended as an offer or solicitation for the purchase or sale of any financial instrument or as an official confirmation of any transaction. Opinions, estimates and assumptions expressed herein are made as of the date of this communication and are subject to change without notice. This communication has been prepared based upon information, including market prices, data and other information, believed to be reliable; however, Trade Nation does not warrant its completeness or accuracy. All market prices and market data contained in or attached to this communication are indicative and subject to change without notice.

Dax Short Term Sell IdeaH1 - Strong bearish move.
No opposite signs.
Currently it looks like a pullback is happening.
Expecting bearish continuation until the two Fibonacci resistance zones hold.
If you enjoy this idea, don’t forget to LIKE 👍, FOLLOW ✅, SHARE 🙌, and COMMENT ✍! Drop your thoughts and charts below to keep the discussion going. Your support helps keep this content free and reach more people! 🚀
-------------------------------------------------------------------------------------------------------------------

Dax into the open.Thursday 20th NovemberPattern is bullish
Overhead rez @ 23.5K and 23.6K
Lets see what happens

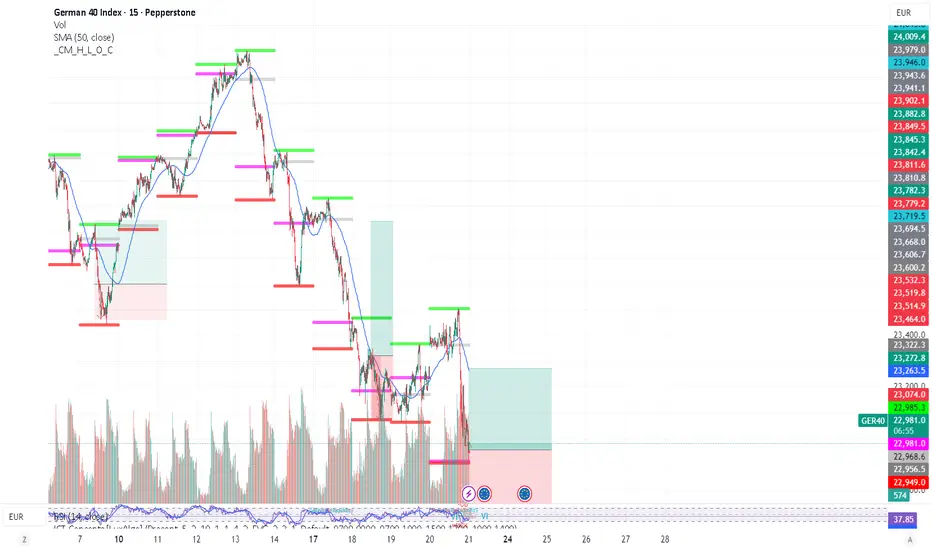
German DAX: Testing Critical Support After Rejection
The GER40 is currently positioned at 23,432.7 , and we're witnessing a pivotal moment in the intraday structure. The index has pulled back from recent highs, and multiple technical signals are flashing across our radar. Let's break down what matters for today's session. 📊
Current Market Landscape
The 4H chart reveals a Rising Wedge pattern that's showing signs of exhaustion. This bearish reversal formation developed over the past week, and we've just seen a breakdown from the lower trendline. The wedge measured move projects downside potential toward 23,200-23,150.
From a Wyckoff distribution perspective, the recent price action exhibits classic topping characteristics. We observed:
Buying Climax (BC) near 23,680
Automatic Reaction (AR) down to 23,380
Secondary Test (ST) failing at 23,620
Sign of Weakness (SOW) currently unfolding
This distribution schematic suggests institutional selling pressure is building.
Elliott Wave Framework 🌊
The wave structure indicates completion of a five-wave impulse from the 23,100 low. Current labeling suggests:
Wave (i)-(v) impulse completed at 23,680
Wave (A) correction down to 23,380
Wave (B) bounce exhausted at 23,550
Wave (C) decline currently in progress (targeting 23,150-23,200)
The internal structure of wave (C) shows three sub-waves developing, with wave iii potentially extending lower.
Key Price Zones 🎯
Resistance Barriers:
R1: 23,520 (broken support turned resistance + 20 EMA on 1H)
R2: 23,620 (failed secondary test + VWAP)
R3: 23,680 (swing high + psychological)
Support Anchors:
S1: 23,380 (initial wave A low + demand zone)
S2: 23,280 (Fibonacci 0.618 retracement)
S3: 23,150 (measured move target + major support)
Technical Indicator Alignment ⚡
RSI (1H): 38.2 - approaching oversold, but no divergence yet
MACD: Bearish crossover confirmed, histogram expanding downward
Bollinger Bands: Price hugging lower band, volatility expanding
Ichimoku Cloud: Price broke below cloud on 1H (bearish shift), Tenkan below Kijun
Volume: Increasing on down moves (confirming selling pressure)
Harmonic Pattern Analysis
A Bearish Bat pattern completed at the 23,680 level:
- X: 23,100
- A: 23,580
- B: 23,320
- C: 23,650
- D: 23,680 (PRZ completion)
The pattern's measured move aligns with our 23,150 target, providing multi-method confluence.
Candlestick Patterns
The 1H chart printed a Bearish Engulfing pattern at 23,550, followed by consecutive bearish candles. This confirms rejection at resistance and validates the distribution narrative.
Trading Game Plan 💼
Scenario A - Continuation Short:
Entry: 23,450 (current area) or 23,520 retest
Target 1: 23,320
Target 2: 23,200
Stop Loss: 23,580
Scenario B - Breakdown Confirmation:
Entry: 23,375 break (below S1 with retest)
Target 1: 23,280
Target 2: 23,150
Stop Loss: 23,460
Timeframe Coordination 🕐
- 5M: Precision entry timing and scalp exits
- 15M: Momentum shifts and micro-structure breaks
- 1H: Primary trend direction and pattern confirmation
- 4H: Macro structure and major support/resistance
Market Outlook
The technical picture is tilted bearish for the immediate term. The rising wedge breakdown, Wyckoff distribution signs, completed harmonic pattern, and bearish Elliott wave count all point toward further downside. The 23,380 level is critical—sustained break below opens the door to 23,150.
However, watch for potential bullish reversal signals if we reach the 23,280-23,200 zone. That's where buyers may step in aggressively. Until then, the path of least resistance is lower. 📉
Trade with discipline, respect your stops, and let the market prove itself. 🎯
---
Disclaimer: This content is for educational purposes only. Trading involves risk. Conduct your own analysis before making trading decisions.
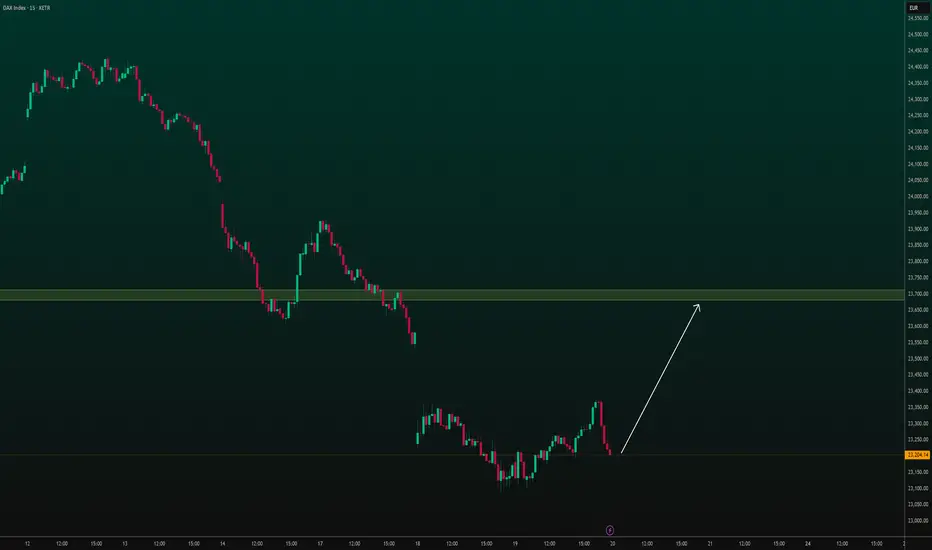
DAX - Potential Rebound from SupportAfter a significant downtrend, the DAX appears to be finding strong support. Price has shown a bounce and the white arrow indicates a potential move towards the resistance zone.
DAX Will the 1W MA50 support once more?DAX (DE40) has been trading within a 3-year Channel Up, essentially for the entirety of its Bull Cycle, following the October 2022 bottom of the Inflation Crisis.
The most common Support, hence optimal long-term buy signal/ entry within this pattern, has been the 1W MA50 (blue trend-line), having been hit three times and providing on all instances massive rallies.
Every time that or the 1W MA100 (green trend-line) were hit, the rallies always hit the previous High/ Resistance 1 initially before either a consolidation or a slight pull-back.
As a result, if the market hits the 1W MA50 but manages to close the 1W candle above it, we expect the resulting rally to hit at least 24700 (Resistance 1).
Notice also that every long-term Bullish Leg was confirmed after the 1W RSI broke above its Lower Highs trend-line.
---
** Please LIKE 👍, FOLLOW ✅, SHARE 🙌 and COMMENT ✍ if you enjoy this idea! Also share your ideas and charts in the comments section below! This is best way to keep it relevant, support us, keep the content here free and allow the idea to reach as many people as possible. **
---
💸💸💸💸💸💸
👇 👇 👇 👇 👇 👇

DAX 40 at support level - long ideaThe DAX is currently trading in what before has shown to be a big support area - keep an eye on if the level is gonna hold or not.
I have personally taken a small long position.
- Feel free to write a comment on where you think the DAX is heading, and why :)

24650 Still Holds for DaxDAX still could not break the 24650 resistance. The range is getting tighter and a possible breakout is closing but the direction of the breakout is still a question. Watch 23300 and 24650 as key levels.


$DAX up timeI called for a audacious short of DAX on 23 Oct, saying that it is weak and other indices could follow it. We got a 1200 pts move down to my 23200 price target (), though it did rebounded strongly before going down.
Price is now at monthly support at around 23050. If price could break the downward trendline, could see a recovery to 23940 or so.
