Nas100 Trade Set Up Sep 24 2025I will want to see price sweep SSL followed by a 1m IFVG/CISD to take higher to 4h FVG/Supply
www.tradingview.com
NAS100 trade ideas

Nasdaq slipped as investors balanced Fed signalsThe Nasdaq 100 (-0.87%) fell as tech stocks weakened. Uncertainty around Nvidia’s $100bn OpenAI deal led the reversal after Monday’s gains.
Powell’s comments added to caution: he repeated that risks remain on both inflation and jobs, but also admitted to “meaningful weakness” in the labour market. This helped bonds rally, but not equities.
Extra pressure came from US government shutdown concerns, while gold hit a record high ($3,764/oz) as investors shifted to a defensive.
Tech momentum cooled, and the Nasdaq slipped as investors balanced Fed signals, policy risks, and stretched valuations.
Key Support and Resistance Levels
Resistance Level 1: 24830
Resistance Level 2: 24950
Resistance Level 3: 25055
Support Level 1: 24412
Support Level 2: 24300
Support Level 3: 24190
This communication is for informational purposes only and should not be viewed as any form of recommendation as to a particular course of action or as investment advice. It is not intended as an offer or solicitation for the purchase or sale of any financial instrument or as an official confirmation of any transaction. Opinions, estimates and assumptions expressed herein are made as of the date of this communication and are subject to change without notice. This communication has been prepared based upon information, including market prices, data and other information, believed to be reliable; however, Trade Nation does not warrant its completeness or accuracy. All market prices and market data contained in or attached to this communication are indicative and subject to change without notice.

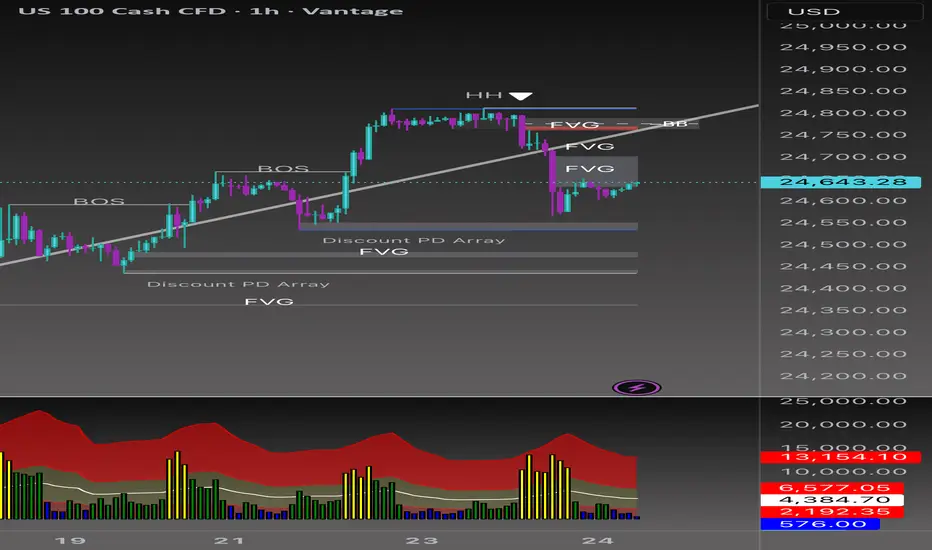
Beyond the Chart - NAS100 Through Technicals & Fundamentals📉 NAS100 VANTAGE:NAS100
Short Bias Analysis (1H Chart)
The market recently formed a Higher High (HH) followed by a Break of Structure (BOS) to the downside, suggesting a potential bearish shift. This move left behind multiple Fair Value Gaps (FVGs), now acting as supply zones.
Key Points
• Liquidity grab above the HH, followed by strong bearish momentum.
• Two FVGs aligning with short bias.
• Current retracement into inefficiencies offers a potential short entry.
• Downside targets: Discount PD Array and lower FVGs (24,480–24,440).
Trade Idea
• Entry Zone: 24,700–24,750 (upper FVG)
• Stop Loss (SL): Above 24,800 (invalidates bearish idea)
• Take Profit 1 (TP1): 24,560
• Take Profit 2 (TP2): 24,440
Risk management remains key 🔑 if price closes above the upper FVG/BB zone, short bias is invalidated.
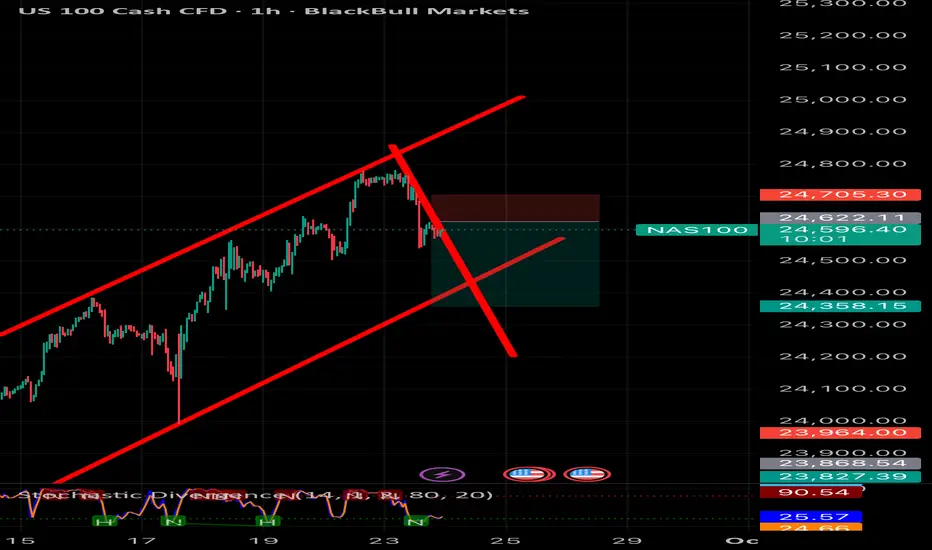
NAS100 rising wedge breakdown short setup The NAS100 recently broke down from a rising wedge formation on the 1H chart, signaling potential bearish momentum. After failing to hold above 24,700, price rejected the upper channel and is now trading below the wedge support.
Here’s my thought process:
• Pattern: Rising wedge, a bearish reversal pattern.
• Rejection Zone: Price failed at 24,705 resistance, confirming sellers stepped in.
• Breakdown Confirmation: A clean break below wedge support increases bearish bias.
NAS100 ShortElite Analysis
Price accumulation
Asian liquidity was taken out
Price action in lower time frames read as bearish
Targeting lower liquidity pools

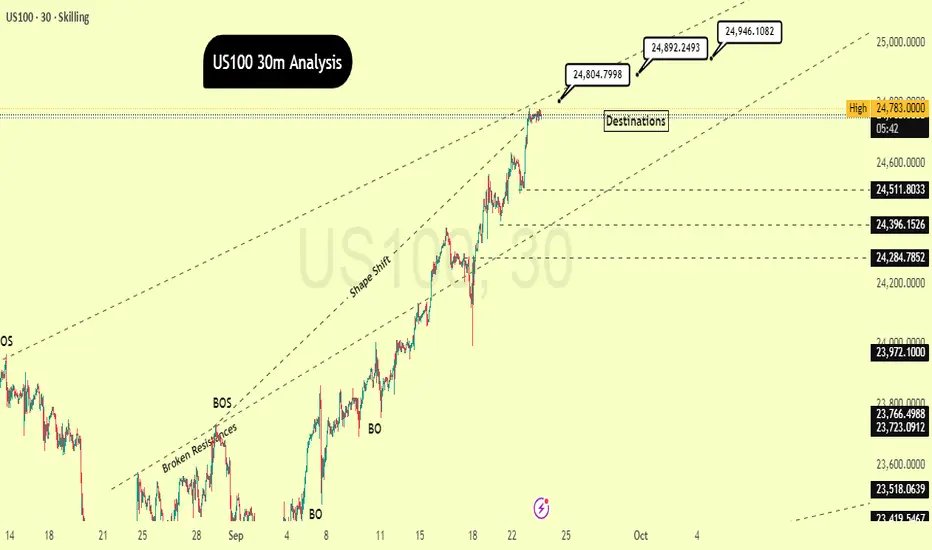
"Reaching Our First Target: What's the Next Step?"By scrutinizing the US100 chart on the30-minutes timeframe, it's evident that the price has initiated a powerful uptrend after surmounting several resistance zones. This is substantiated by the explicit "BOS" (Break of Structure) points, signaling that the market is consistently forging new, higher peaks. The "Shape Shift" noted on the chart indicates a transformation in market character, transitioning from a period of consolidation or a downtrend into a fresh, vigorous bullish impulse.
The price is currently nearing a pivotal resistance point around 24,783.0000. Should the price manage to breach and maintain a position above this threshold, we can anticipate a continuation of the upward trajectory. The prospective targets, labeled as "Destinations," are, 24804.7998, 24,892.2493 and , with an additional high-level objective at 24,946.1082.
I'd appreciate it if you could show your support through likes and comments to encourage me to share more analysis with you, and please share your perspective on the potential direction of this chart with me!
With Respect:
SimarEdgeTrading

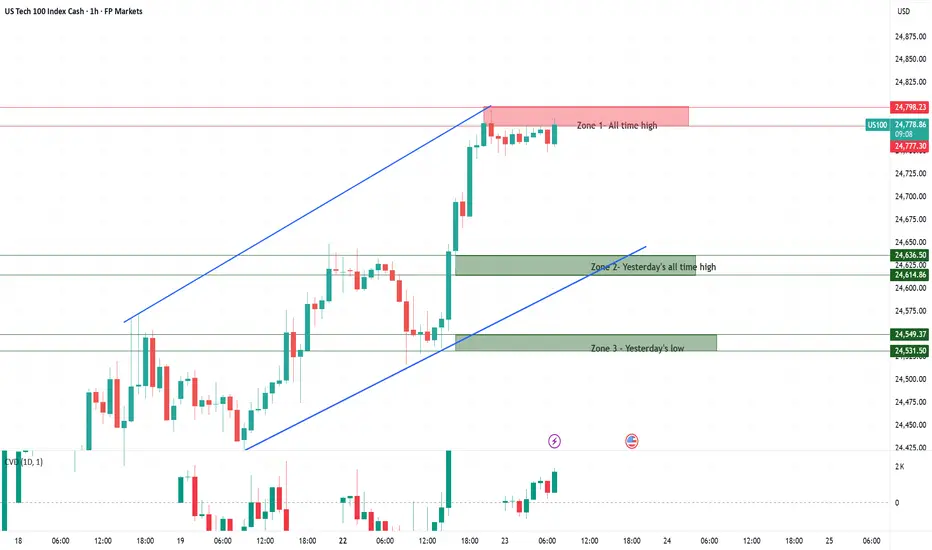
Trading Nas100 at Record Highs The Nasdaq-100 is currently trading at fresh all-time highs, which naturally makes it more difficult to identify strong, well-tested support and resistance levels. With limited historical price action to lean on, these zones should be viewed as guidelines rather than exact buy or sell levels. Traders should remain cautious and flexible in their execution.
Zone 1 – All-time high & yesterday’s high:
This area represents the current record high and the most immediate point of resistance. Price action here is uncharted territory, so reactions can be volatile. A breakout above this zone would confirm continued strength, while rejection could trigger short-term pullbacks.
Zone 2 – Yesterday’s all-time high:
This former high now acts as a potential reference support. If tested, it may attract buyers looking to defend the trend, but given the lack of historical confirmation, reliability remains limited.
Zone 3 – Yesterday’s low:
This marks the lower boundary of recent price action and serves as the next potential support area. If broken decisively, it could indicate fading momentum and open the door for a deeper retracement.
Nas100 is trading near record highs with strong momentum driven by the tech sector, especially AI leaders like Nvidia. The overall sentiment remains bullish, but traders should watch for potential consolidation as the index approaches resistance and technical indicators signal overbought conditions. Regulatory headlines and Fed rate-cut expectations could act as key catalysts for volatility.
USTEC - Trading Edge TodayDear Friends in Trading,
🎯Trading Edge:
Tech leading breakout momentum with institutional accumulation above POC
Key Level: 24,800 (volume gap fill)
Pivot: 24,650 – 24,700
Bias: Bullish above pivot
Bull target: 24,800 → 25,000
Bear target: 24,600 → 24,400
Correlation: +88% with US30, +52% with Gold (Fed trade)
Risk Assets Alignment:
GOLD🔄USTEC🔄US30
✅Gold + USTEC + US30 all bullish above pivots = Fed dovish trade confirmed
✅Unusual Gold/equity positive correlation suggests monetary policy driving both higher
Assets Overbought:
🔴USTEC - 4HR Overbought Divergence Detected
I sincerely hope my point of view offers a valued insight.
Thank you for taking the time study my analysis.

NasdaqNasdaq consolidated another support level at 24740 in today's session. If the price remains above this support, buyers remain in control, and we could reach 25000, an important level that could signal the end of the bullish rally. An H1 candlestick closing above 24800 could confirm continuation.


NAS100 - Stock Market, After the Fed Meeting!The index is above the EMA200 and EMA50 on the one-hour timeframe and is in its long-term ascending channel. If the drawn ascending trend line holds, we can expect the continuation of its previous upward path, but in case of a valid break, its downward path will be smoothed to the indicated support area.
A week filled with significant events in global markets came to an end, with the Federal Reserve’s decision to cut interest rates by 25 basis points standing out as the most important development. Although this move temporarily boosted the U.S. dollar, it failed to reverse its multi-day downtrend. Fed Chair Jerome Powell sought to frame the decision as a “risk management” measure, but the dot plot indicated that policymakers hold a different outlook, keeping the possibility of further cuts by year-end alive.
Meanwhile, Paul Atkins, Chairman of the U.S. Securities and Exchange Commission (SEC), announced that in response to President Donald Trump’s request, he would propose a rule change to replace quarterly corporate reporting with semiannual reporting. In an interview with CNBC, he said this matter has been placed on the SEC’s immediate agenda. With Republicans holding a 3-1 majority on the commission, such a change could be approved by a simple majority vote. This move would disrupt the traditional reporting and disclosure cycle, making investors wait longer intervals for corporate financial information.
In a Truth Social post, Trump wrote: “This change will cut costs and allow executives to focus on running companies properly instead of worrying about quarterly reports.” He also added: “You’ve heard people say China takes a 50- to 100-year perspective on corporate management, yet we run our companies quarter by quarter. That’s not good at all!” Atkins stressed that the matter remains only a proposal for now and requires review, meaning it is not yet finalized. Significant lobbying efforts are expected around this issue.
Following a week dominated by central bank decisions, markets in the coming days will shift their attention to a wide range of inflation, industrial, and housing data. Alongside these releases, the speech of Steven Miran, the newly appointed Fed member, is set to be a pivotal moment for investors.
Monday will be packed with monetary policy remarks, with Andrew Bailey and Huw Pill from the Bank of England, Rogers and Kozicki from the Bank of Canada, and Williams, Musalem, Barkin, and Harker from the Fed scheduled to speak. Nevertheless, the spotlight will be on New York, where Miran will deliver a speech at the Economic Club at noon local time. Having consistently advocated for faster and deeper rate cuts, his comments are being watched closely by markets.
On Tuesday morning, the release of the preliminary S&P Global PMI for September will coincide with Jerome Powell’s first remarks following the recent FOMC meeting. A day later, U.S. new home sales data will be published.
Thursday will bring the Swiss National Bank’s monetary policy decision. At the same time, markets will receive final U.S. Q2 GDP figures, durable goods orders, weekly jobless claims, and existing home sales data.
The week will conclude on Friday morning with the release of the Personal Consumption Expenditures (PCE) price index for August, the Fed’s preferred inflation gauge. On the same day, the revised University of Michigan consumer sentiment survey for September will also be released, offering a fuller picture of consumer confidence.
Currently, many leading financial institutions expect further consecutive rate cuts in the Fed’s two remaining meetings of 2025. In this context, upcoming speeches from key Fed members could shape expectations. Markets are particularly focused on comments from Waller and Bowman, who previously opposed Miran’s proposal for a 50-basis-point cut. On the political side, it is anticipated that President Trump will once again direct sharp criticism at Powell, a factor that could weigh further on market sentiment.
Separately, Berkshire Hathaway, led by Warren Buffett, has fully exited its investment in Chinese automaker BYD, ending a 17-year-long position. The divestment followed a gradual reduction of shares starting in 2022, and according to Berkshire’s energy unit, the investment had fallen to zero value by the end of Q1 2025.
A company spokesperson confirmed that the position was fully closed. Meanwhile, BYD’s head of public relations expressed gratitude for Berkshire’s long-term support since 2008, noting that the ownership stake began shrinking in 2022 and fell below 5% by mid-2024. This investment is regarded as one of Berkshire’s most successful ventures in Asia.

Here we go again, the 4th trade idea for NASDAQ.Trade what you see, not what you feel. After three consecutive wins on NASDAQ, let's see if this will be the fourth? I don't intend to show off here, but I want to learn to be more disciplined with my trading and increase my confidence. And who knows, this might also be useful for others.

Nas100: Trading Zones at Record HighsKey Zones in Focus
Zone 1 – All-time high area:
This zone marks the current all-time high and therefore acts as immediate resistance. Price has already tested this area, and sellers may attempt to defend it, leading to potential rejection or short-term pullbacks. A clean breakout and sustained hold above this level would confirm bullish continuation into uncharted territory, opening the door for further upside momentum.
Zone 2 – Demand zone:
This zone represents a recent consolidation cluster where both buyers and sellers were actively positioning. As the breakout unfolded, this area shifted from resistance to support. Short-term buyers are likely to step in here to defend the trend. A decisive break back below this zone, however, would weaken bullish conviction and could trigger a deeper retracement toward lower levels.
The sentiment around the US100 has turned more optimistic following last week’s Federal Reserve meeting, where the central bank cut interest rates by 25 basis points — the first rate cut since December 2024. This concrete policy move has reinforced investor confidence that monetary conditions are shifting toward a more supportive stance. At the same time, strong momentum in the technology sector, highlighted by new AI-focused partnerships and improving trade signals between the U.S. and China, has further boosted risk appetite. While some caution remains regarding the pace of future cuts and macroeconomic headwinds, the overall market tone is positive, with traders viewing the recent policy shift as a catalyst for continued strength in the Nasdaq-100.

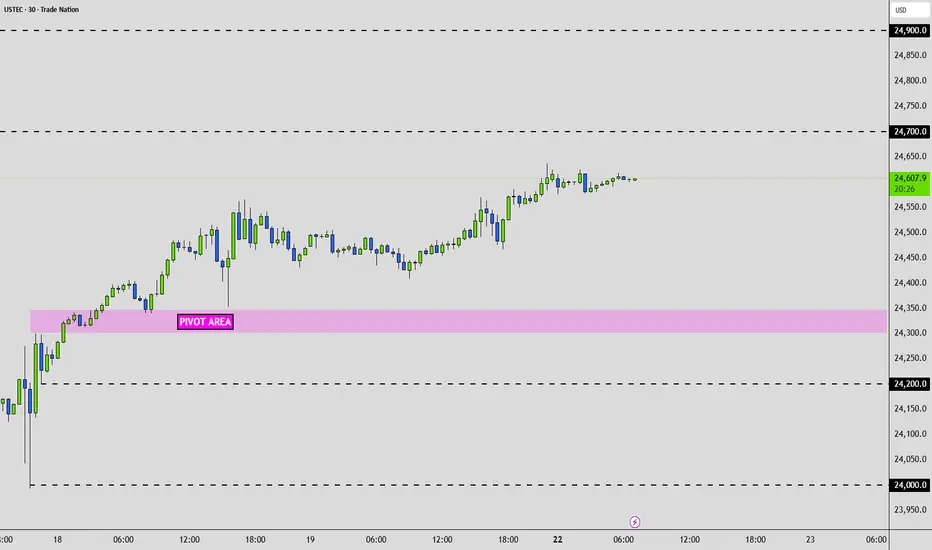
Nasdaq - USTEC: Trading Edge TodayDear Friends in Trading,
Experimental Test Phase Week:
Correlation Logic & Daily Efficiency - GOLD🔄NASDAQ🔄DOW JONES
🔎 Previous Week Observations -
Strong accumulation & clustered trading between 24,300 – 24,350.
This is where most volume likely sat (clustered POC zone).
Breakout above 24,400 carried price strongly higher.
Current price (~24,615) is sitting above last week’s value area, riding momentum.
USTEC - 22Sept:
Pivot: 24,300 – 24,350
Bias: Bullish while above pivot
Bull targets: 24,700 → 24,900
Bear targets: 24,200 → 24,000
👉 Nasdaq leading tech momentum.
Stronger risk appetite = supports US30 as well, usually opposite Gold.
I sincerely hope my point of view offers a valued insight.
Thank you for taking the time study my analysis.
NASQAD Weekly NASQAD 📊 Weekly Market Outlook
On this pair, we see a strong confluence forming on the Weekly timeframe:
✔️ Weekly Fair Value Gap (FVG)
✔️ Strong Weekly Order Block
✔️ Fibonacci retracement alignment
This zone is a high-probability area to watch. If price taps into this level, we’ll look for confirmation on lower timeframes before executing a buy setup.
Smart traders wait for price action to confirm before entering patience here can make all the difference.

NAS100Success in forex and stocks comes from a combination of knowledge, discipline, and patience. Understanding market trends, economic factors, and company
fundamentals is crucial, but equally important is controlling emotions and sticking to a well-planned strategy. Continuous learning, adapting to changing conditions, and managing risk wisely can turn opportunities into consistent growth over time.
Consistency, not luck, separates successful traders from the rest.

Nasdaq-100 (NDX) Weekly Chart 2025 Chart Context
This weekly timeframe analysis of the Nasdaq-100 Index (NDX) forms a key pillar in our 2025 macro analysis series. Following the breakout structure seen in TOTAL, TOTAL2, BTC.D, and US10Y, this chart utilizes 2 Fibonacci tools (1 trend-based extensions and 1 retracement) to project potential corrective and expansion scenarios.
Fibonacci Tools Used:
Fibonacci Retracement : Applies to the recent smaller swing to determine micro retracement zones and cluster supports.
0=20674 and 100=10504
Trend-Based Fibonacci Extension: Drawn using a three-leg structure (point A= 3993 to B=16724 to C10504) to forecast upside targets beyond ATH.
All take-profit (TP) levels: TP1 (~23,400), TP2 (~26,700), and TP3 (~30,344.49)—are located at confluence zones where Fibonacci levels from different tools align, reinforcing their validity and strength.
There is a 4TP above all the Visible TPs
Key price references:
0% retracement: ~20,674.71
Next Resistance ~23,400 (confluence of extensions and psychological resistance)
Projected TPs:
1TP=~23,400,
2TP=~26,700,
3TP=~30,344.49,
4TP=44000
Support/Resistance:
Red zone: ~16,700–18,300 (historical S/R and correction target and Fib Confluences)
Resistance zone: ~23,000–23,400 ,
22000(ATH area)
Key Technical Observations:
Fibonacci Retracement from ~20674 to ~15732 marks the initial corrective range.
Trend-Based Extensions forecast:
TP1 (~23,400): First breakout resistance
TP2 (~26,700): Medium-term expansion zone
TP3 (~30,344): Long-term target if macro tailwinds persist
Scenario Pathways:
Bullish Continuation: Breaks above ATH to reach TP2/TP3
Healthy Correction: Pullback to ~20,600 or deeper ~18,300 before resumption
Deep Correction: Revisits ~16,700 zone if macro environment deteriorates
Fundamental Context:
Tech Stocks & Economic Sentiment: NDX is often the first to move during liquidity expansions. Its performance signals risk-on behavior across global equity markets.
Rate Cuts in 2025: With anticipated Fed rate cuts, tech stocks are primed for inflows. Forward earnings valuations rise, justifying extended upside in high-beta tech.
AI Boom & Earnings Growth: Nasdaq is heavily weighted toward AI, cloud, and semiconductors—sectors expected to lead earnings surprises.
NDX Influence on Gold and Crypto
When NDX rallies:
Crypto: Risk appetite improves. Capital rotation flows into altcoins and layer-1 assets.
Bitcoin: Often sees parallel inflows, especially during strong tech rallies (e.g., 2020).
TOTAL & TOTAL3: Begin breakout patterns if NDX continues to surge.
Gold: May stall or correct as investors favor risk assets. However, gold still holds due to macro hedging and real yield pressures.
When NDX corrects:
Crypto: Volatility spikes. Altcoins bleed faster.
Bitcoin: Short-term dip but may decouple if viewed as digital gold.
Gold: Benefits from flight-to-safety behavior.
US10Y: Often reacts inversely to NDX moves—used for confirmation.
Search Highlights (2024–2025):
Institutions view NDX correction as signal to rotate into commodities (incl. gold).
Cross-market correlations show NDX peaks often precede crypto mini-rallies.
De-risking from NDX often triggers gold strength, especially in geopolitical or inflationary backdrops.
Bias & Strategy Implication
Primary Bias: Bullish
Expecting upside continuation to 26,700–30,000 zone
Multiple correction opportunities are present even during rally
Strategic Actions:
Monitor for correction to yellow/red zones for accumulation
Use NDX behavior as leading macro signal for crypto rotations
Watch resistance at 23,400 closely; breakout confirms trend extension
Time Horizon
Short-Term (1–2 months): Watch for breakout or correction to ~20,600–18,300
Mid-Term (3–6 months): Probable test of ~26,700
Long-Term (6–12 months): Potential expansion to ~30,344.49

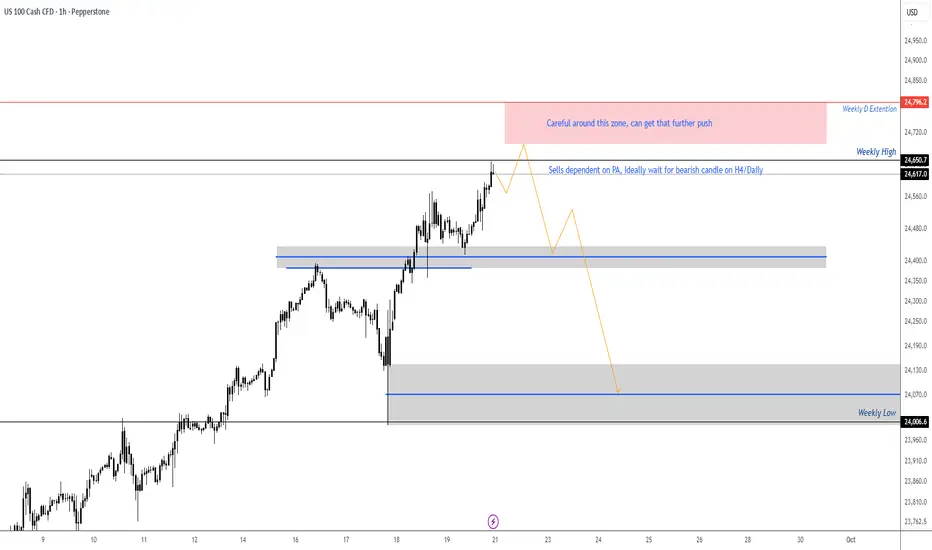
NASDAQ - setting up for Bearish SetupLooking for the bearish signal or the H4/Daily time frame, might get that final push for the D extension on the weekly timeframe, opening of the week might get a small pullback then continuation to the upside. Trade will be validated only if we get bearish PA setup on the H4/Daily. Looking for the setup to create a turn shape then can look for potential entries. If price does not present a bearish setup on the H4/Daily then the plan is no longer valid.
Who find this 3monthly candle trend line fascinating?short term 26665 long term 30030
26665 Oct 2025 if not 27958 Jan 2026 if not then April 2026
s3.tradingview.com
