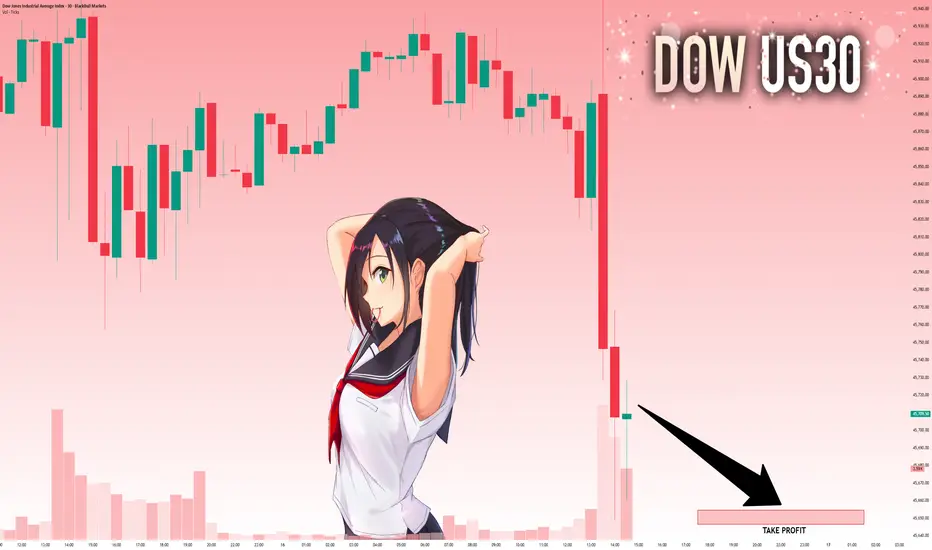
US30 AnalysisI expect US30 to remain bearish this week. Current price action suggests weakness, with momentum favoring sellers. If market conditions hold, we may see a continuation to the downside, and today’s session is also likely to close bearish. A short position looks favorable at this point, but as always, risk management is key.
US30 trade ideas
US30Success in forex and stocks comes from a combination of knowledge, discipline, and patience. Understanding market trends, economic factors, and company fundamentals is crucial, but equally important is controlling emotions and sticking to a well-planned strategy. Continuous learning, adapting to changing conditions, and managing risk wisely can turn opportunities into consistent growth over time. Consistency, not luck, separates successful traders from the rest.

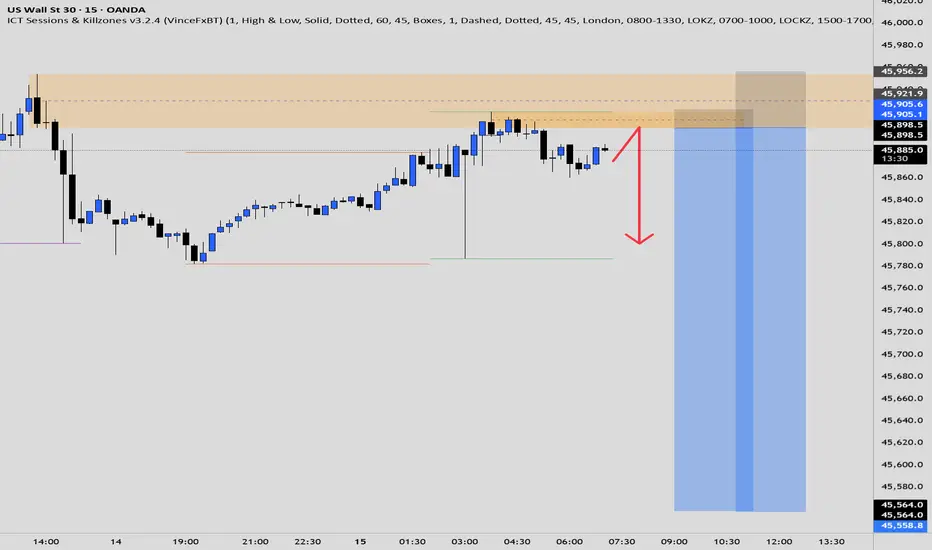
Us30i got screwed with that liquidity sweep
but now that its back into the zone i am waiting for a nice rejection candle on that support to take to the upside -
but but but - news this week lol
so first tp is shown
but depending on volume maybe re-test those highs unless another sell and im screwed.

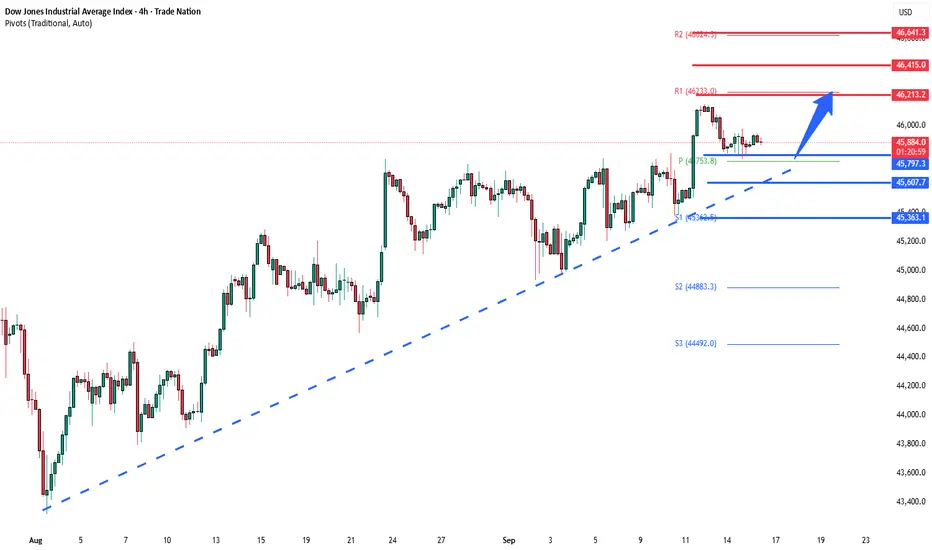
Dow JonesAfter days of fighting at the resistance at 45800, this was broken, now this level as support we can expect new highs and continuation of the trend up to the region of 46500. Resistance that will become support

US30: Will Go Down! Short!
My dear friends,
Today we will analyse US30 together☺️
The recent price action suggests a shift in mid-term momentum. A break below the current local range around 45,713.96 will confirm the new direction downwards with the target being the next key level of 45,654.62 and a reconvened placement of a stop-loss beyond the range.
❤️Sending you lots of Love and Hugs❤️
Us30 Trade Set Up Sep 16 2025www.tradingview.com
Price is consolidating right now so i either want to see a break and close of the support key zone to trader lower to lower levels of support or a sweep of PDL, close above followed by a IFVG on the 1m-2m to trade higher to PDH

Sure, here is the English translation of the analysis for the USSure, here is the English translation of the analysis for the US30 (Dow Jones Industrial Average):
The US30, a heavyweight index composed of 30 blue-chip stocks, is a core barometer of U.S. economic health. The index is currently oscillating near all-time highs, highlighting a tug-of-war in market sentiment. Its trajectory is primarily driven by two key factors: firstly, the path of the U.S. Federal Reserve's monetary policy, where any changes in inflation data and interest rate expectations trigger significant volatility; and secondly, the corporate earnings of its constituent companies, with the performance of large-cap tech and financial stocks providing crucial support.
From a technical perspective, the 39,000-point zone is a critical watershed. Sustained trading above it could initiate a new upward leg, while a break below may lead to a deeper technical correction. Looking ahead, the index will maintain high volatility amid a tug-of-war between "soft landing" hopes and policy uncertainty. Investors must closely monitor inflation reports and Fed commentary to gauge its future direction. Caution is warranted in the short term, while the long-term trend remains dependent on the resilience of economic data.
DowJones Key Trading Levels Key Support and Resistance Levels
Resistance Level 1: 46210
Resistance Level 2: 46415
Resistance Level 3: 46640
Support Level 1: 45800
Support Level 2: 45610
Support Level 3: 45360
This communication is for informational purposes only and should not be viewed as any form of recommendation as to a particular course of action or as investment advice. It is not intended as an offer or solicitation for the purchase or sale of any financial instrument or as an official confirmation of any transaction. Opinions, estimates and assumptions expressed herein are made as of the date of this communication and are subject to change without notice. This communication has been prepared based upon information, including market prices, data and other information, believed to be reliable; however, Trade Nation does not warrant its completeness or accuracy. All market prices and market data contained in or attached to this communication are indicative and subject to change without notice.
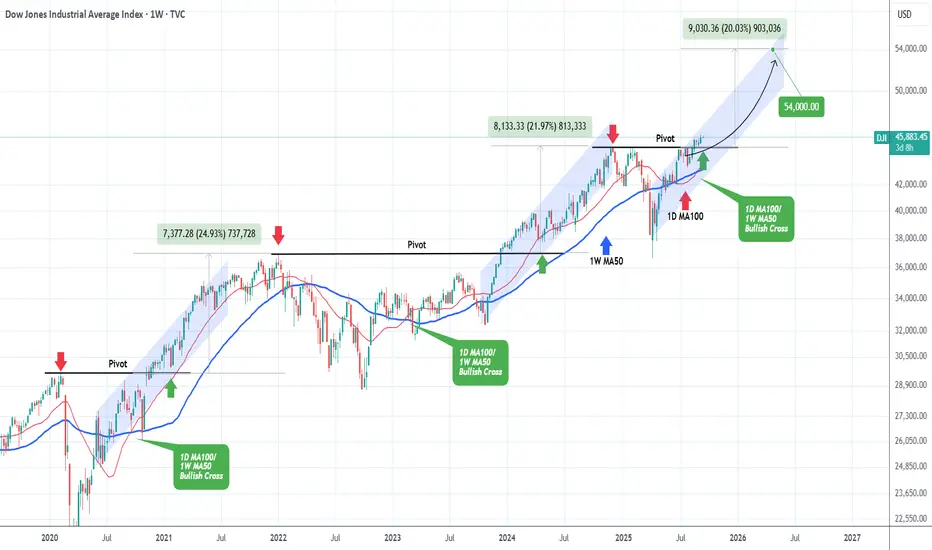
DOW JONES The Cyclical Pivot that MUST hold.Last week (Sep 03, see chart below) we gave a buy signal on Dow Jones (DJI) right at the bottom of its medium-term Channel Up, which quickly hit our 46100 Target:
This time we switch to a much wider and longer term outlook on the 1W time-frame as we are just a day before the Fed Rate Decision. The index has been trading within a strong Channel Up ever since the April 07 2025 market bottom, product of the Trade War correction early in 2024.
The 1D MA100 (red trend-line) crossed above the 1W MA50 (blue trend-line) forming a peculiar Bullish Cross, which interestingly enough, it is the 3rd time we see it since September 2020.
As a result, it is highly critical and as you can see, after such cross, the 1W MA50 has historically led the index higher.
What is perhaps even more critical however is the Pivot trend-line, which is essentially the former All Time High (ATH) turned into Support for the Channel Up pattern that have pushed the market higher since 2020.
As you can see, that level always held and the two rallies that we've had on the pattern like the current one, completed +25% and +22% rallies above it before an eventually correction that broke below the 1W MA50.
As a result, we could see another +20% rise at least, translating into a 54000 long-term Target, as long as both the 1W MA50 and the Pivot hold.
-------------------------------------------------------------------------------
** Please LIKE 👍, FOLLOW ✅, SHARE 🙌 and COMMENT ✍ if you enjoy this idea! Also share your ideas and charts in the comments section below! This is best way to keep it relevant, support us, keep the content here free and allow the idea to reach as many people as possible. **
-------------------------------------------------------------------------------
💸💸💸💸💸💸
👇 👇 👇 👇 👇 👇
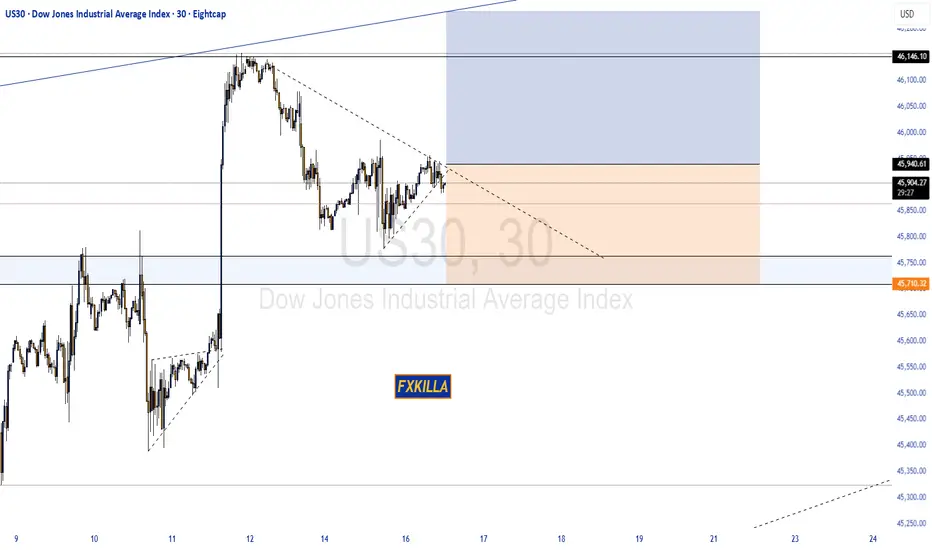
DOW JONES HIGH PROBABILITY SETUP SOON!!!🚨 US30 HIGH PROBABILITY BUY SETUP 🚨
* Here We Can See Clearly The Next Potential Move For DOW30 Coming Hours.
* Keep Your Eyes Close On Your Trading Positions.
* Happy PIP Hunting Traders.
FXKILLA.
US30 Technical Breakdown – 09/16/2025📍 US30 Technical Breakdown – 09/16/2025
US30 is hovering just under 46,000 after last week’s breakout to 46,112 🚀. Price pulled back but has since stabilized around 45,900–45,930, coiling just below resistance.
Bulls are defending higher lows, but momentum has slowed. A clean break above 46,000 could open the door for another push higher, while failure to hold could drag us back into mid-range support.
📊 Current Market Behavior:
🔄 Coiling below 46,000 resistance
📈 Higher lows holding structure
🧱 Strong support at 45,456–45,500
⚠️ Market indecision before next leg
📌 Key Levels:
🔹 Resistance Zones:
45,930–46,000 → Intraday ceiling
46,112 → Breakout high
46,250 → Next bullish target
🔹 Support Zones:
45,865 → EMA cluster zone
45,456 → Key support floor
45,320 → Mid-range demand
44,988 → Strong base
🧠 Bias:
Neutral → Bullish leaning
Above 46,000 = expansion higher
Below 45,865 = possible fade lower

US30 Liquidity Play📌 **POV – US30 Liquidity Play**
Currently looking for a **short-term long position on US30**, with the main objective of grabbing liquidity above last week’s high and the daily previous high.
This move aligns with a classic **liquidity sweep** setup – expecting price to run the highs before showing signs of exhaustion.
Once liquidity is taken, I’ll shift bias to a **bearish scenario**, looking for a clear **CHOCH/BOS confirmation** and an entry around newly-formed **FVGs** for the larger move to the downside.
For now, the bullish move is only a **liquidity play**, not a structural shift. The real interest lies in the bearish continuation after the sweep.
---
Lord Emerson


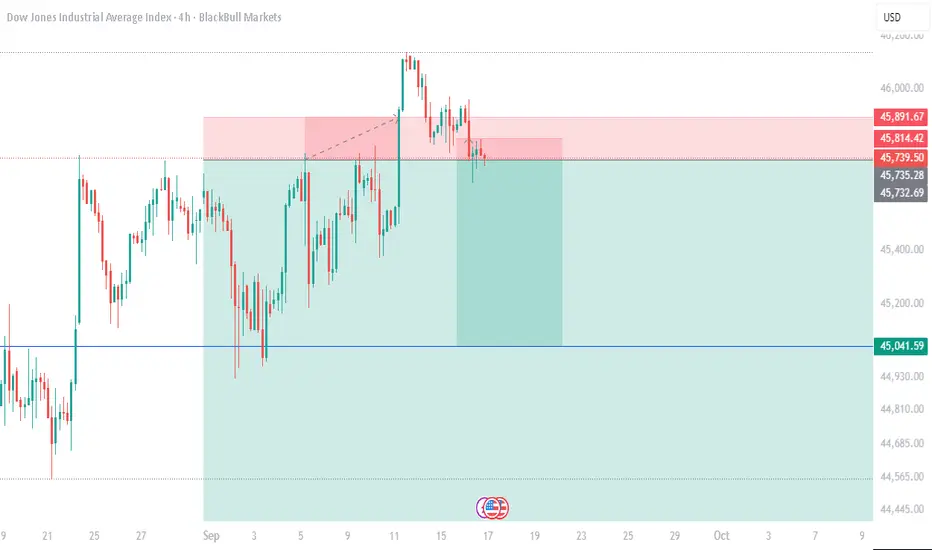
Potential bullish continuation?DJ30 is falling towards the support level, which is pullback support that is slightly above the 50% Fibonacci retracement and could bounce from this level to our take profit.
Entry: 45,688.53
Why we like it:
There is a pullback support that is slightly above the 50% Fibonacci retracement.
Stop loss: 45,306.39
Why we like it:
There is a pullback support that lines up with the 78.6% Fibonacci retracement.
Take profit: 46,177.16
Why we like it:
There is a swing high resistance level.
Enjoying your TradingView experience? Review us!
Please be advised that the information presented on TradingView is provided to Vantage (‘Vantage Global Limited’, ‘we’) by a third-party provider (‘Everest Fortune Group’). Please be reminded that you are solely responsible for the trading decisions on your account. There is a very high degree of risk involved in trading. Any information and/or content is intended entirely for research, educational and informational purposes only and does not constitute investment or consultation advice or investment strategy. The information is not tailored to the investment needs of any specific person and therefore does not involve a consideration of any of the investment objectives, financial situation or needs of any viewer that may receive it. Kindly also note that past performance is not a reliable indicator of future results. Actual results may differ materially from those anticipated in forward-looking or past performance statements. We assume no liability as to the accuracy or completeness of any of the information and/or content provided herein and the Company cannot be held responsible for any omission, mistake nor for any loss or damage including without limitation to any loss of profit which may arise from reliance on any information supplied by Everest Fortune Group.

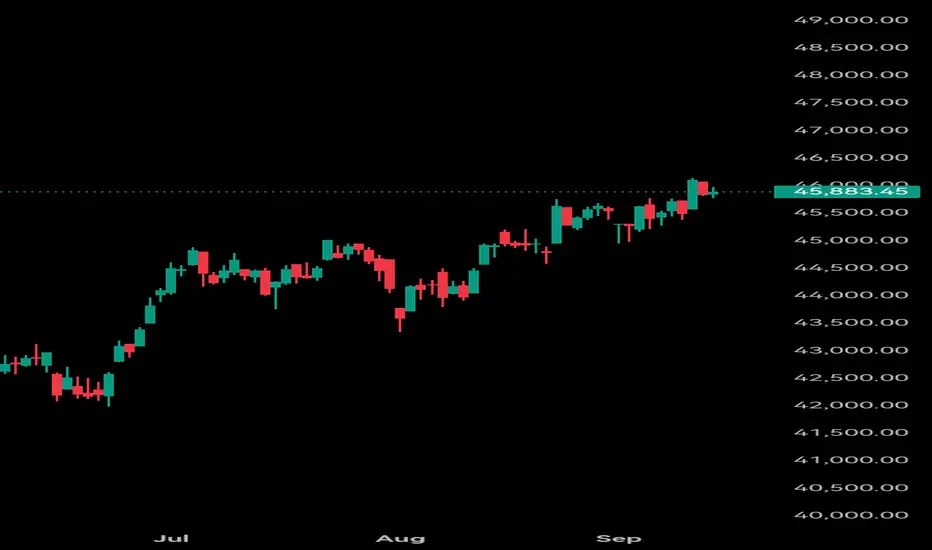
Possibility of uptrend A trend change is expected to form within the current support area and we will witness the start of an uptrend. As long as the index fluctuates above the support area, a continuation of the uptrend is likely.

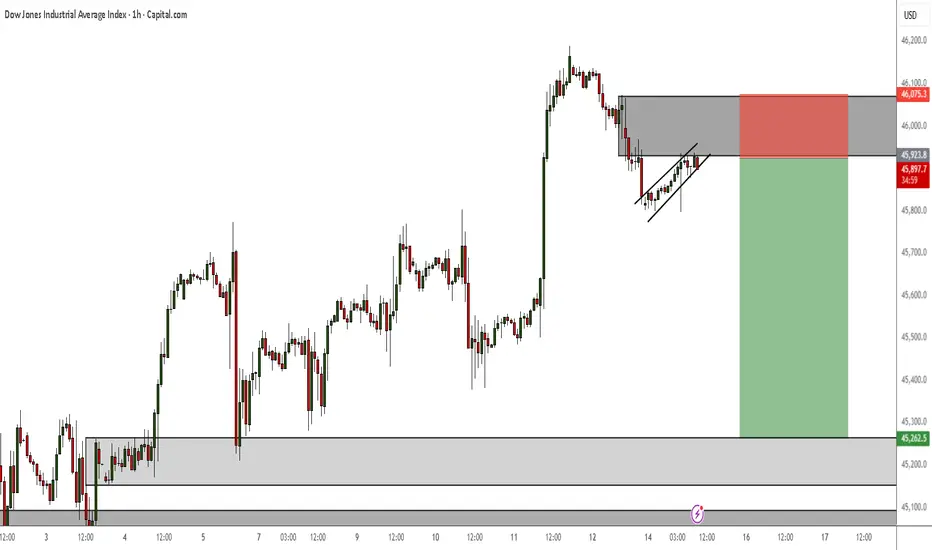
Dow Jones Consolidates After ATH – Watch 46,125 for BreakoutUS30 – Overview
The Dow Jones recorded a new ATH near 46,125 and is now testing key support/resistance levels.
📉 Bearish scenario: While trading below 46,125, price may revisit the pivot zone and, if broken, could drop toward 46,000. A confirmed break below 46,000 would extend downside targets to 45,680 → 45,450.
📈 Bullish scenario: A 1H close above 46,125 would invalidate the short-term bearish bias and open the way toward 46,250.
Key Levels
Pivot: 46,000
Resistance: 46,125 – 46,250
Support: 45,800 – 45,680 – 45,450
Bias: Bearish while below 46,125 and 46,000; bullish breakout confirmed on a 1H close above this level.

DXY about to break down and send NAS and Gold higher?Full Analysis of DXY, XAG, XAU, WTI, NAS, S&P and DJ30. I go through my whole analysis for the day and week on the daily and the 1h timeframe applying my mutitimeframe approach and Stacey Burkes teachings to my whole basket.

Gan strategy’s In dow jones has return after determining and calculating it’s considered my angle is 90 dgree and for time angle i calculated 90 candle though. Its in square shape and maybe it completes all major angles which is 360 last one
The smal rectangle consider price / time
And the trend line is my bias which golden one is major road and red is for selling and green is for buying.
Les see

Long on US30 for NY OpenThis is long idea for US30 in the new york open ... We had a low taking out and now we had a great bullish leg up , im looking at new york open high taken out

Dow Jones is in a Bearish CorrectionThe downside correction for US30 will also continue as DXY pushes up this week.
Currently on M15 TF I am seeing a bearish correction pattern for shorting.
Us30 Trade Set Up Sep 15 2025www.tradingview.com
Price has swept PDL back stayed closed above, so i am overall still bullish. I would like to see price sweep internal SSL followed by a IFVG/CISD on the 1m-2m to continue higher

US30 ShortElite Analysis
Now we wait for price to come to us
Targeting lower liquidity pools
Executing 2 trades
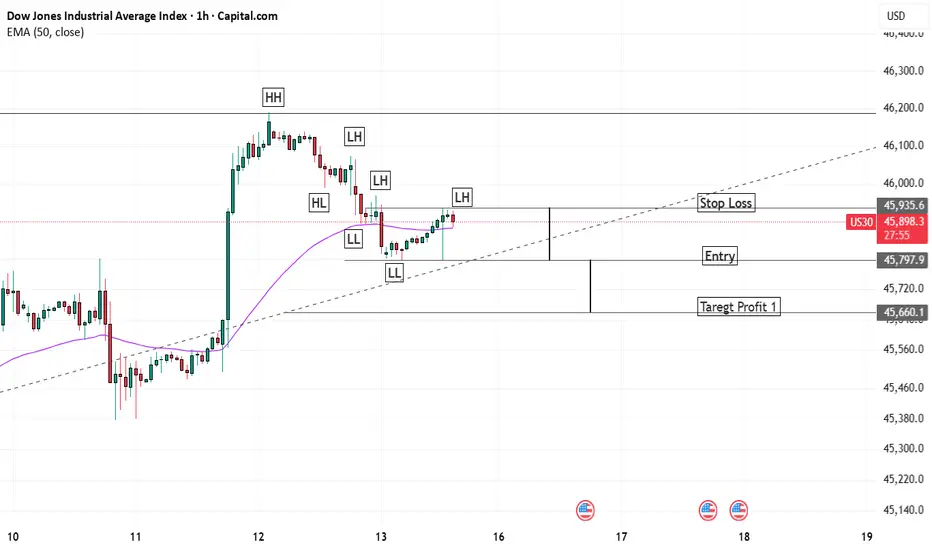
US 30 1 Hour Downward Trend Simple Dow TheoryUS 30 1 Hour Downward Trend Simple Dow Theory
LH and LL Making
Setup is Mentioned
Trade with Care