Are you still ready to buy the American market?After working as an analyst for nearly 20 years, I have noticed a clear trend of recovery in all drawdowns in the US market. Money does make money, and the printing press can fill all corrections.
Will it always be like this?
It was this question that made me analyze in more detail the charts of the American indices - DJI and DJT.In fact, you can connect a larger data spector here, including the dynamics of the S&P, the S&P Small Cap 600 index, the S&P Mid Cap 400, index and the Value Line Composite index (geometric) and see the same situations.
I'll add some of them to the graph for clarity.As you can see, there are discrepancies between the charts, which are called intermarket divergences. However, the Dow theory has its own reasons for this.
1. According to the Dow theory, signals about the current trend and trend reversal should be confirmed by both indexes. This statement applies to the Dow Jones Industrial Average and the Dow Jones Transportation Average.
2. At the same time, there may be some discrepancy in the timing of the signals, that is, one of the indices may signal a trend change earlier than the other.
What do you see on the chart?
Personally, I see a notable contradiction. While the industrial index has reached new all-time highs, the transportation index is trading significantly below them. The Value Line Composite Index (geometric) shows a similar picture. That is, we have an non confirmation of the strength of growth and strength of buyers, which is a bad signal!
And no, I'm not saying that you need to sell urgently, but you need to understand that the market is in the final phase of its long-term growth. And a reversal towards the bearish phase is just around the corner.
It is enough to look at the waves to understand that we are already sitting in the last carriage of the train, which is ready to start reversing.In addition, inside wave 5, we had a stretch in the subwave (1), which means that the subwaves (3) and (5) cannot continue stretching.
Wave (1)=18465.79 points, wave (3)=16357.78 points, which means (1)>(3)>(5), then the movement in the basement (5) is limited to the level of 52969.5 points, before reaching it, the market should already begin to show signs of a downward reversal.
At the same time, the 5th waves often give a truncation and already now the subwave (5) = 0.5 of the length (1). The growth may end prematurely if condition (5) is fulfilled=0.618 from (1) or (5)=0.764 from (1).
PS All extremes are usually formed either on euphoria or on general optimism.
Are you still an optimist?
US30 trade ideas

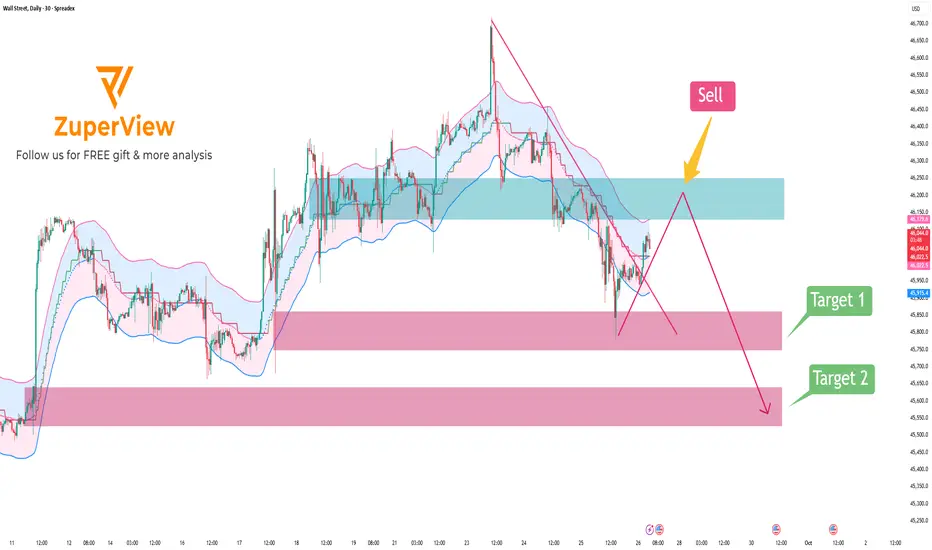
US30: Rebound to resistance & continue to break down
📝 1. Market Context
The SPREADEX:DJI dropped sharply from the recent high around 46,700 down to near 45,700, showing that sellers are currently in control in the short term. After this sharp decline, price is experiencing a mild recovery but still remains within a clearly defined downtrend channel and below key resistance.
🟥 2. Resistance Zone
The major resistance is located around 46,250 – 46,130 (highlighted in blue on the chart):
• This zone overlaps with the EMA and the upper band of the Keltner Channel.
• It was previously a sideways consolidation area that has now turned into resistance.
• It also intersects with the descending trendline, making a bearish rejection likely.
🟩 3. Support Zone
The nearest support lies at 45,858 – 45,748 (first pink zone).
If price breaks below this level, it is likely to continue falling toward the lower support zone at 45,520 – 45,640 (second pink zone).
🚨 4. Bearish Scenario
• Main scenario: Wait for a price pullback into the 46,250 – 46,130 area and watch for bearish signals → then SELL.
• Target: First target at 45,860 – 45,750 → if broken, expect further decline toward 45,520 – 45,640.
• Invalidation: A daily close above 46,250 would invalidate this bearish setup.
Please like and comment to support our traders. Your feedback motivates us to produce more analysis in the future 🙏✨
US30 Technical Breakdown – 09/29/2025📍 US30 Technical Breakdown – 09/29/2025
The Dow rallied off the 45,700 support and pushed back toward 46,400, but sellers stepped in on the retest. The index is consolidating between major supply and demand zones, with EMAs flattening → possible range or breakout setup.
📊 Market Behavior:
🔹 Strong rebound from last week’s lows
🔹 Rejection at 46,400–46,450 resistance
🔹 Buyers still holding higher lows above 46,000
📌 Key Levels:
🔹 Resistance Zones:
46,404 → current rejection zone
46,650 → strong breakout level
🔹 Support Zones:
46,100 → immediate demand
45,837 → key pivot support
45,722 → deeper demand zone
45,181 → downside target if broken
🧠 Bias:
Neutral → leaning bullish if 46,400 breaks, bearish if 46,000 gives out.
Us30 Trade Set Up Sep 29 2025Price is now bullish creating HH/HL and closed above PDH so i will look for internal SSL to be swept then a 1m IFVG/CISD retest to price higher towards BSL
www.tradingview.com

Dow rolls over, shifting directional risksDirectional risks in the Dow Jones contract appear more balanced following the break of uptrend support earlier this week, a view supported by momentum indicators such as RSI (14) and MACD, which have also rolled over, delivering a neutral signal. More weight should be placed on price action in the near term rather than maintaining a specific bias.
If the price can hold above support at 45,762, longs could be established above the level with a stop beneath for protection, targeting the record high of 46,723 set earlier this month. Should the uptrend break lead to an extension of the bearish move beneath 45,762, the setup could be flipped, with shorts placed below the level and a stop above for protection. The 50DMA, 45,000 or 44,500 screen as potential targets.
Good luck!
DS

Kwrwshmhmdy4 We saw signs of a decline in the US30 chart last week. And this decline was enough to convince retail traders to enter a sell trade and place a stop at the highest peak. And this is exactly the wrong thing to do, because the market will turn around and hit all the stop losses and with the volume that enters the market, the price will flow down. So the market will first go up and eventually fall more sharply.

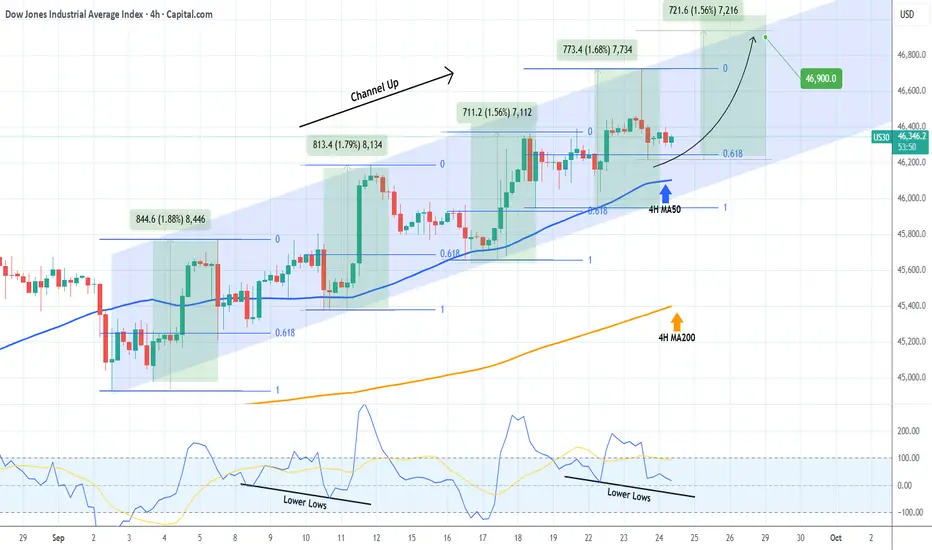
DOW JONES forming a bottom ahead of the next rally.Dow Jones (DJI) has been trading within a Channel Up since the start of September and right now it is consolidating after having hit the 0.618 Fibonacci retracement level, following a Higher High rejection at the top of the pattern.
As you can see, the 0.618 Fib was always pull-back tested after a Higher High, with the 4H MA50 (blue trend-line) also or at least coming very close to. As a result, the current 4H candle consolidation is technically a bottoming process before the new Bullish Leg.
The weakest Bullish Leg of this Channel Up has been +1.56%, which more than covers our 46900 Target.
-------------------------------------------------------------------------------
** Please LIKE 👍, FOLLOW ✅, SHARE 🙌 and COMMENT ✍ if you enjoy this idea! Also share your ideas and charts in the comments section below! This is best way to keep it relevant, support us, keep the content here free and allow the idea to reach as many people as possible. **
-------------------------------------------------------------------------------
💸💸💸💸💸💸
👇 👇 👇 👇 👇 👇
Weekly Forex Outlook Sun.Sept.28.2025 - Fri.Oct.3.2025Like and Comments would be appreciated :D Not Financial Advice, Just my outlook/opinion

US30 H4 | Bearish drop offBased on the H4 chart analysis, we could see the price rise to the sell entry at 46,338.64, which is a pullback resistance that aligns with the 50% Fibonacci retracement and could drop from this level to the take profit.
Stop loss is at 46,676.09, which is a swing high resistance.
Take profit is at 45,762.38, which has been identified as an overlap support that lines up with the 50% Fibonacci retracement.
High Risk Investment Warning
Trading Forex/CFDs on margin carries a high level of risk and may not be suitable for all investors. Leverage can work against you.
Stratos Markets Limited (tradu.com ):
CFDs are complex instruments and come with a high risk of losing money rapidly due to leverage. 65% of retail investor accounts lose money when trading CFDs with this provider. You should consider whether you understand how CFDs work and whether you can afford to take the high risk of losing your money.
Stratos Europe Ltd (tradu.com ):
CFDs are complex instruments and come with a high risk of losing money rapidly due to leverage. 66% of retail investor accounts lose money when trading CFDs with this provider. You should consider whether you understand how CFDs work and whether you can afford to take the high risk of losing your money.
Stratos Global LLC (tradu.com ):
Losses can exceed deposits.
Please be advised that the information presented on TradingView is provided to Tradu (‘Company’, ‘we’) by a third-party provider (‘TFA Global Pte Ltd’). Please be reminded that you are solely responsible for the trading decisions on your account. There is a very high degree of risk involved in trading. Any information and/or content is intended entirely for research, educational and informational purposes only and does not constitute investment or consultation advice or investment strategy. The information is not tailored to the investment needs of any specific person and therefore does not involve a consideration of any of the investment objectives, financial situation or needs of any viewer that may receive it. Kindly also note that past performance is not a reliable indicator of future results. Actual results may differ materially from those anticipated in forward-looking or past performance statements. We assume no liability as to the accuracy or completeness of any of the information and/or content provided herein and the Company cannot be held responsible for any omission, mistake nor for any loss or damage including without limitation to any loss of profit which may arise from reliance on any information supplied by TFA Global Pte Ltd.
The speaker(s) is neither an employee, agent nor representative of Tradu and is therefore acting independently. The opinions given are their own, constitute general market commentary, and do not constitute the opinion or advice of Tradu or any form of personal or investment advice. Tradu neither endorses nor guarantees offerings of third-party speakers, nor is Tradu responsible for the content, veracity or opinions of third-party speakers, presenters or participants.

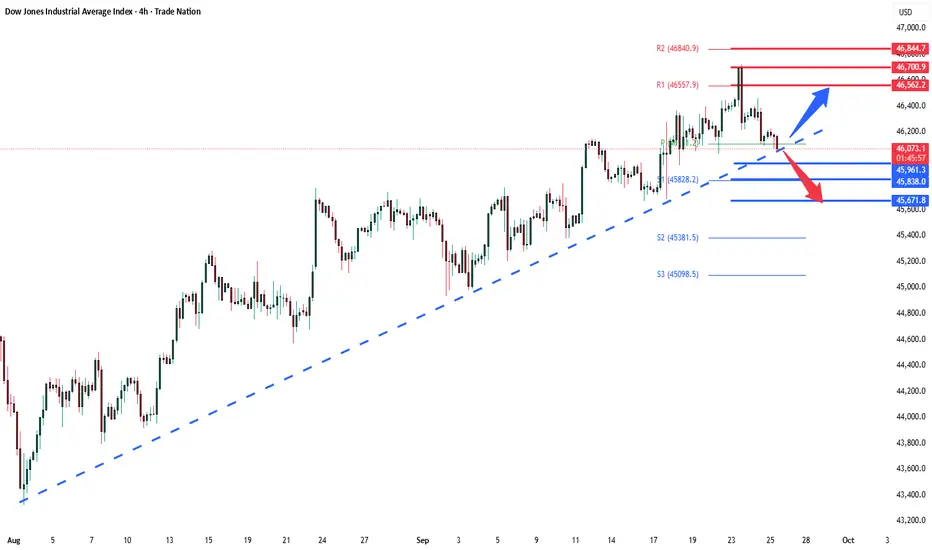
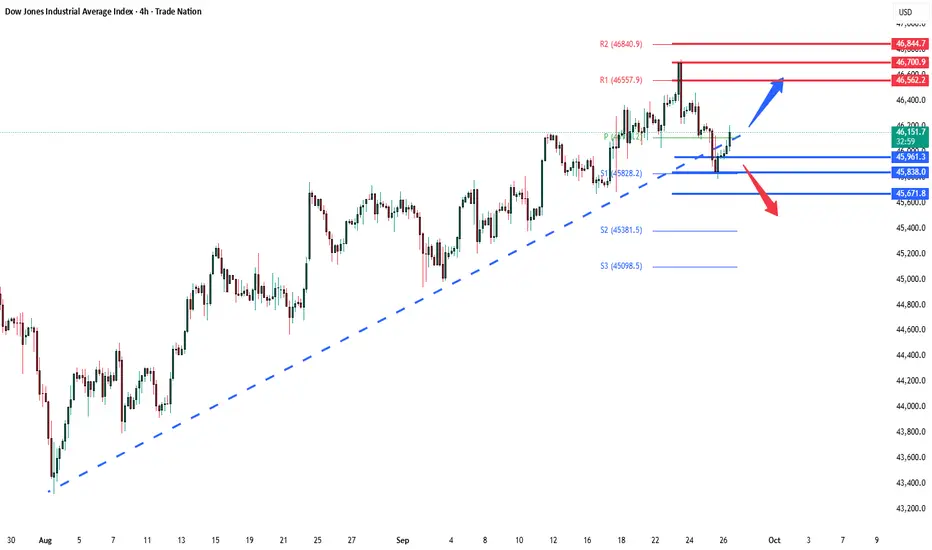
Dow corrective pullback - pivotal zone!Key Support and Resistance Levels
Resistance Level 1: 46560
Resistance Level 2: 46700
Resistance Level 3: 46845
Support Level 1: 46100
Support Level 2: 45960
Support Level 3: 45840
This communication is for informational purposes only and should not be viewed as any form of recommendation as to a particular course of action or as investment advice. It is not intended as an offer or solicitation for the purchase or sale of any financial instrument or as an official confirmation of any transaction. Opinions, estimates and assumptions expressed herein are made as of the date of this communication and are subject to change without notice. This communication has been prepared based upon information, including market prices, data and other information, believed to be reliable; however, Trade Nation does not warrant its completeness or accuracy. All market prices and market data contained in or attached to this communication are indicative and subject to change without notice.
Us30 US30 is approaching a key demand zone where strong buying pressure has previously emerged. If buyers step in again, we could see a bullish reversal or continuation. However, a clean break below this zone may indicate weakening momentum and open the door to further downside.

DowJones Key Trading Levels Key Support and Resistance Levels
Resistance Level 1: 46560
Resistance Level 2: 46700
Resistance Level 3: 46850
Support Level 1: 45960
Support Level 2: 45840
Support Level 3: 45670
This communication is for informational purposes only and should not be viewed as any form of recommendation as to a particular course of action or as investment advice. It is not intended as an offer or solicitation for the purchase or sale of any financial instrument or as an official confirmation of any transaction. Opinions, estimates and assumptions expressed herein are made as of the date of this communication and are subject to change without notice. This communication has been prepared based upon information, including market prices, data and other information, believed to be reliable; however, Trade Nation does not warrant its completeness or accuracy. All market prices and market data contained in or attached to this communication are indicative and subject to change without notice.
US30 DropsUS30 looks bearish on the M30 timeframe with one price target of 46,108.7 and a bias of 46,002.2.
The setup will be invalidated if the price breaches 46,463.5, which is derived from bearish pressure at the H4 to Daily resistance.
The high at 46,363.4 is held by the 46,417 area zone, and the bulls' momentum is also challenged by the bearish highs at 46,353.8. Overall, the sentiment is therefore bearish.
Happy Trading,
K.
Not trading advice

US30 Analysis (Short Bias)I expect US30 to remain bearish this week. Current price action suggests weakness, with momentum favoring sellers. If market conditions hold, we may see a continuation to the downside, and today’s session is also likely to close bearish. A short position looks favorable at this point, but as always, risk management is key.
The last week’s predictions toyed with my analysis, but this week might just be the setup for a stronger sell opportunity.

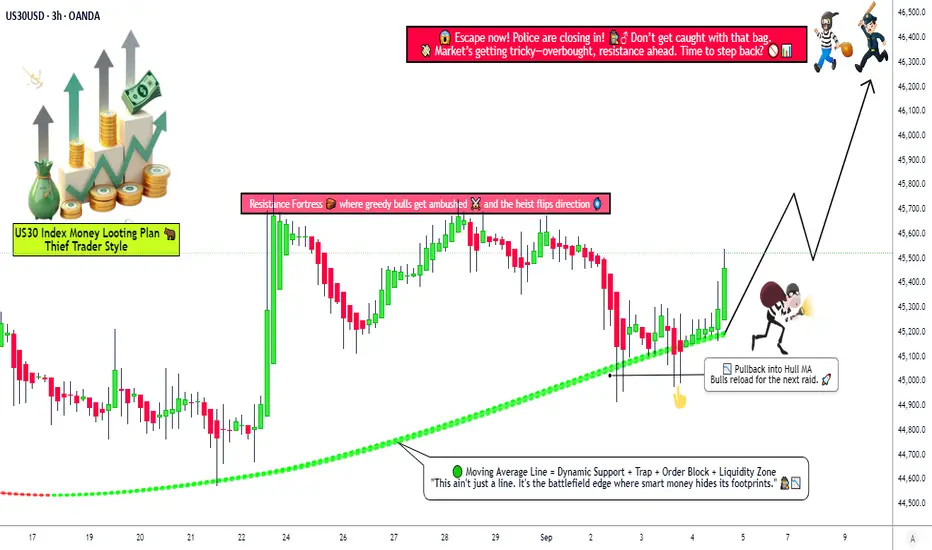
Dow Jones Bullish Strategy! Can the Market Break Higher?🚀 US30 Index Money-Making Plan (Swing / Day Trade) 📊
🧠 Trading Plan & Strategy (Thief Layer Style)
🚀 Approach: Bullish Hull Moving Average pullback plan — “bulls reloaded” for the next wave.
🎯 Entry (Layering Strategy): Multiple buy-limit layers → 45,200 • 45,300 • 45,400 • 45,500 (flexible to add more based on your own plan).
🛡️ Stop Loss: Reference point at 45,000. Adjust SL responsibly to match your personal risk tolerance & style.
💰 Target: Potential resistance zone (the “police barricade”) sits near 46,300. That’s where traders may consider taking profits.
📢 Note: This is an illustrative plan based on technicals — every trader should adapt TP/SL to their own strategy and risk appetite.
📊 US30 Market Report – September 4, 2025
📈 Current Price Snapshot
Trading near 45,000 points, up 0.05% today.
Strong monthly performance (+2.4%) and robust yearly gains (+17%).
Market showing resilience despite trade tensions.
😊 Retail Traders’ Sentiment
60% long vs 40% short → Tilted bullish.
Optimism driven by hopes for earnings growth & Fed rate cuts.
Caution remains due to tariff risks.
🏦 Institutional Traders’ Outlook
Cautiously bullish positioning.
Demand for equities continues, but with moderated exposure.
Buybacks + foreign inflows supporting price action.
🌡️ Overall Investor Mood
Neutral to positive tone.
Economic resilience balanced against policy uncertainty.
Healthy breadth across sectors, not just tech.
😨 Fear & Greed Index
Currently at 52 (Neutral).
Suggests balance — no extremes dominating.
Neutral setups often precede steady gains.
💹 Fundamental Score → 8/10
Strong corporate earnings (+12–13% growth projected next year).
Balance sheets remain solid.
AI & tech themes boosting key components.
Tariffs still a drag, but diversified exposure helps.
🌍 Macro Score → 7/10
US GDP growth cooling to 1.5%, but global rebound supports outlook.
Inflation ~2.9%; Fed rate cuts expected later.
Labor market stable, policy clarity could add upside.
🐂 Overall Market Outlook: Bullish Bias 📈
If support at 45,000 holds, potential move higher toward 46,000+.
Drivers: Strong earnings, Fed easing, broad rally.
Watch: Trade news headlines remain a key risk factor.
🔎 Why This Plan?
Hull MA pullback indicates momentum continuation.
Layered entries provide flexibility & better risk distribution.
Market sentiment + fundamentals align with bullish bias.
Resistance at 46,300 offers a clear take-profit zone.
📌 Related Pairs to Watch
CAPITALCOM:US30
FOREXCOM:SPX500
EIGHTCAP:NDQ100
TVC:VIX
TVC:DXY
✨ “If you find value in my analysis, a 👍 and 🚀 boost is much appreciated — it helps me share more setups with the community!”
#US30 #DowJones #Indices #SwingTrading #DayTrading #TechnicalAnalysis #StockMarket #TradingPlan #HullMA #LayeringStrategy
US30 - Pullback The Dow has been on a very aggressive bullish run but a pullback is due in my opinion. The volume has diminished will continue to drop before it continues to move on up.
Kwrwshmhmdy4 We saw signs of a decline in the US30 chart last week. And this decline was enough to convince retail traders to enter a sell trade and place a stop at the highest peak. And this is exactly the wrong thing to do, because the market will turn around and hit all the stop losses and with the volume that enters the market, the price will flow down. So the market will first go up and eventually fall more sharply.


US30: Bearish Continuation & Short Trade
US30
- Classic bearish setup
- Our team expects bearish continuation
SUGGESTED TRADE:
Swing Trade
Short US30
Entry Point - 46297
Stop Loss - 46377
Take Profit - 46148
Our Risk - 1%
Start protection of your profits from lower levels
Disclosure: I am part of Trade Nation's Influencer program and receive a monthly fee for using their TradingView charts in my analysis.
❤️ Please, support our work with like & comment! ❤️

US30: Target Is Down! Short!
My dear friends,
Today we will analyse US30 together☺️
The recent price action suggests a shift in mid-term momentum. A break below the current local range around 46,077.79 will confirm the new direction downwards with the target being the next key level of 45,945.23 and a reconvened placement of a stop-loss beyond the range.
❤️Sending you lots of Love and Hugs❤️
Us30 Trade Set Up Sep 26 2025Price pushed up from the daily FVG yesterday and has formed a 4h bearish FVG which acts has imbalance to be filled to if price continues to make internal bullish structure i will look for buys to target 50% of the 4h FVG/PDH
www.tradingview.com

DOW JONES (US30): Confirmed BoS & More Growth
I see another confirmed break of structure and a violation
of an important intraday horizontal resistance on a 4h time frame on US30 Index.
Odds will be high, that the market will continue rising.
Next resistance - 46550
❤️Please, support my work with like, thank you!❤️
I am part of Trade Nation's Influencer program and receive a monthly fee for using their TradingView charts in my analysis.

US30 - Short Setup – Rising Channel (4H)I'm currently eyeing a short opportunity on US30 (Dow Jones Industrial Average) based on the 4H timeframe.
