Us30 Trade Set Up Sep 24 2025price pushed down hard yesterday but still made a HL on the 1h also created a 1h FVG so i will want to see a test of that, if it respects it i will look for internal 1m bearish structure to look for sells but if it trades through it i will look for buys to PDH
www.tradingview.com
US30 trade ideas

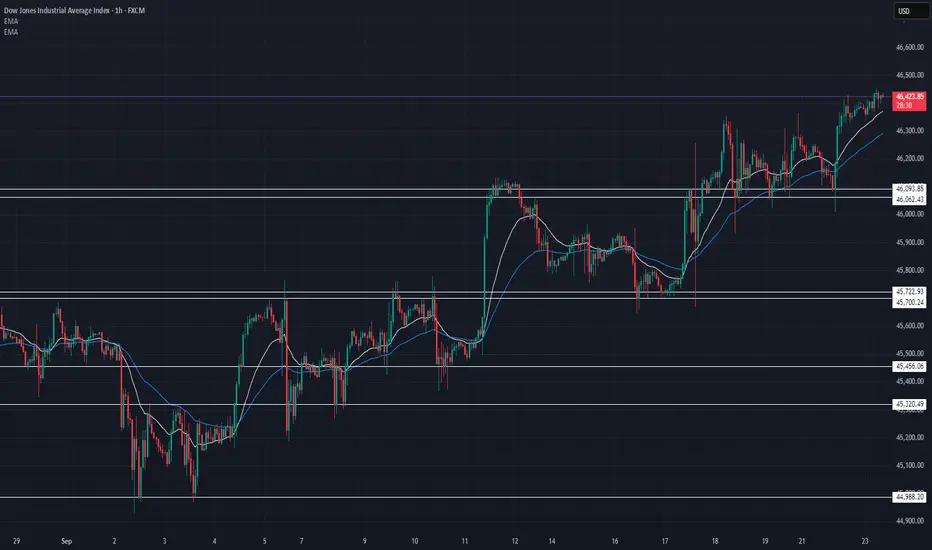
US30 Technical Breakdown – 09/24/2025📍 US30 Technical Breakdown – 09/24/2025
US30 holding steady around 46,320 after yesterday’s push into the 46,700s before pulling back. Market is consolidating but still above key supports, showing buyers remain in control ✅.
📊 Current Market Behavior:
📈 Retest after breakout — healthy pullback
⚡ Buyers defending 46,000 zone strongly
🔄 Consolidation above support → bullish continuation possible
📌 Key Levels:
🔹 Resistance Zones:
46,430 → Immediate resistance
46,700 → Major upside target
47,000 → Next extension if momentum continues
🔹 Support Zones:
46,093 → First key support
45,722 → Strong demand zone
45,456 → Last line of defense for bulls
🧠 Bias:
Bullish ✅
Above 46,000 keeps momentum alive
Break below 45,700 = bearish shift
US30 Update On the low time frame, US30 is consolidating aroundUS30 Update
On the low time frame, US30 is consolidating around 46,351 – 46,398 after testing the breakout zone.
Key levels:
46,398 – 46,351 → short-term decision zone. A breakout above this area could confirm bullish continuation toward 47,170.
46,177 – 45,796 → support zone for the main uptrend. As long as price holds above this, the bullish cycle remains intact.
Upside scenario: If price reclaims and holds above 46,398, momentum strengthens for another push higher, with 47,170 as the next major resistance.
Downside risk: If price fails to hold above 46,177, deeper correction could follow, with 45,796 as first support.
Cycle level: 41,097 is the cycle start and a critical must-hold area for the long-term bullish structure.
📌 Summary
Above 46,398 → bullish continuation toward 47,170.
Hold above 46,177 – 45,796 → main uptrend safe.
Break below 45,796 → correction risk, broader weakness possible.
41,097 → cycle start and major long-term support.

[Long] US30: Dow Jones (September 23, 2025)Entry: 46319.21
SL: 46279.21
TP: 46569.21
This set up is vaild by 4am EST.
After 4am, it is not valid.

23 sep 2025 -day one- results 2SL, 1 BEToday I started journaling my trades and emotions again after a 6-month or much more break. I wasn't in my best mood and couldn't think as well as I usually do.
First entry was a sell on a very bullish market, and I took it because I had patterns for it in my strategy, but usually in strong bull or bearish markets, I trust the market momentum for the first 30 minutes, but today my mind wasn't free enough or strong enough to do it on time, and gave me at least 1 reward.
The second trade was a buy, which gave me a break-even result, and there was nothing wrong with that.
On the third trade, I got emotional and didn't hesitate that for this kind of bull market we may start ranging, and I just entered a buy, but unfortunately, I got stopped out.
And I called it a day with minest 2 reward, and I hope I get it all back. I'm thinking about just trading from Wednesday to Friday, because usually I face losses on the first two days of the week, and maybe I will just trade on Wednesday and Friday. I will make the final decision after two more weeks of journaling.

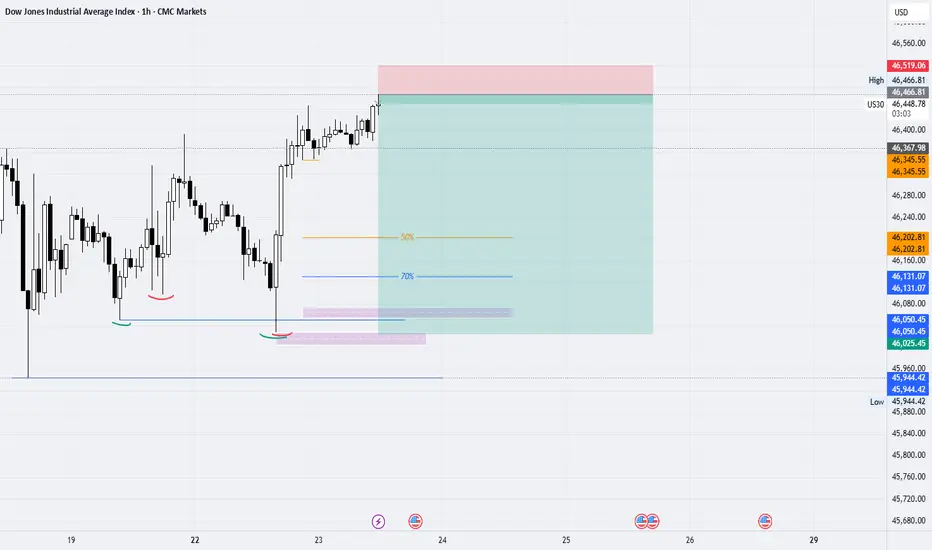
US30: Target Is Up! Long!
My dear friends,
Today we will analyse US30 together☺️
The recent price action suggests a shift in mid-term momentum. A break above the current local range around 46,620.50 will confirm the new direction upwards with the target being the next key level of 46,789.61 and a reconvened placement of a stop-loss beyond the range.
❤️Sending you lots of Love and Hugs❤️
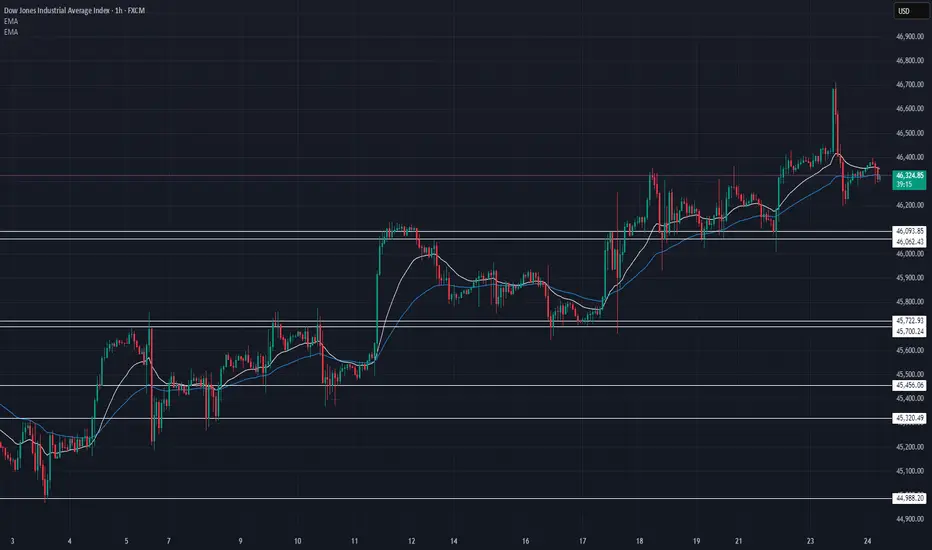
US30 Technical Breakdown – 09/23/2025📍 US30 Technical Breakdown – 09/23/2025
US30 pushing higher again 🚀 Now trading around 46,420, holding strong after reclaiming the 46,000 key level. Buyers are in control as momentum builds.
EMA structure is bullish — dips are being bought, and price is trending upward toward new highs.
📊 Current Market Behavior:
📈 Strong breakout past 46,000
⚡ Higher lows & higher highs forming
🔄 Consolidation breaks leading to expansion
🔥 Momentum still favoring the bulls
📌 Key Levels:
🔹 Resistance Zones:
46,430 → Immediate intraday resistance
46,600 → Next upside target
46,800 → Extension level
🔹 Support Zones:
46,093 → First line of support
45,722 → Strong demand zone
45,456 → Major support floor
🧠 Bias:
Bullish ✅
Above 46,000 = buyers in full control
Only a break below 45,700 shifts bias
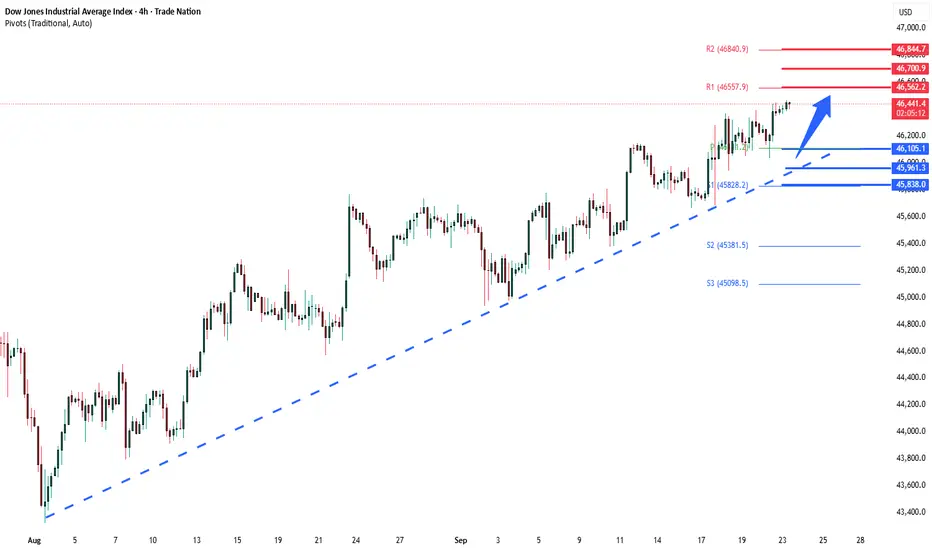
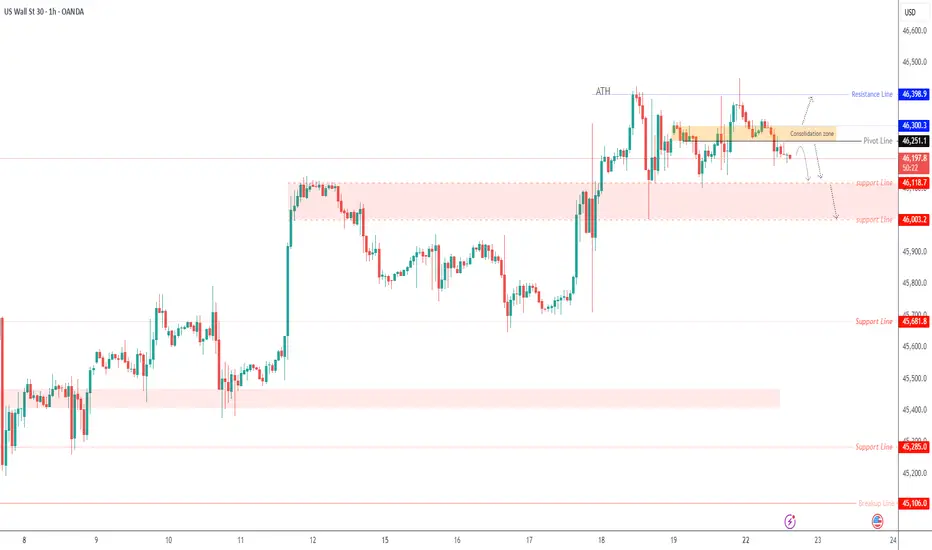
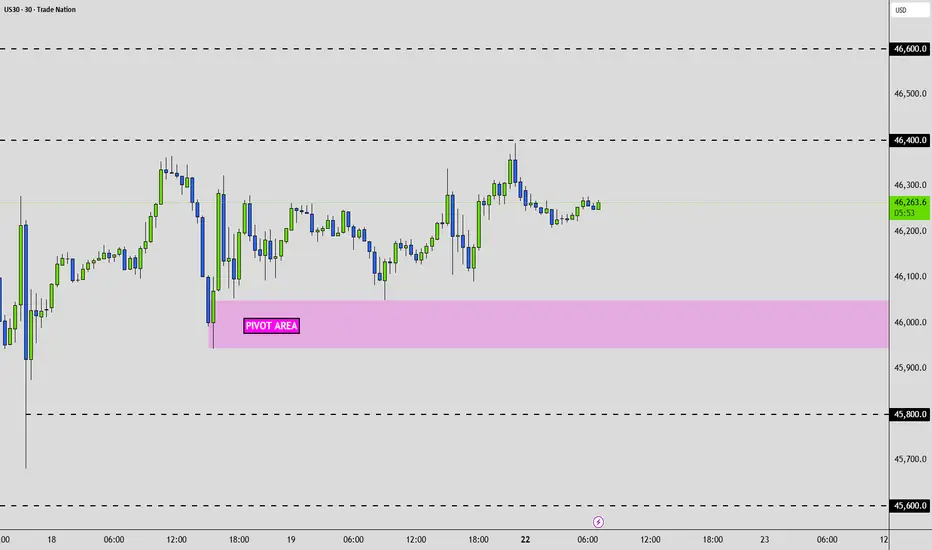
DowJones Key support at 46100Key Support and Resistance Levels
Resistance Level 1: 46560
Resistance Level 2: 46700
Resistance Level 3: 46845
Support Level 1: 46100
Support Level 2: 45960
Support Level 3: 45840
This communication is for informational purposes only and should not be viewed as any form of recommendation as to a particular course of action or as investment advice. It is not intended as an offer or solicitation for the purchase or sale of any financial instrument or as an official confirmation of any transaction. Opinions, estimates and assumptions expressed herein are made as of the date of this communication and are subject to change without notice. This communication has been prepared based upon information, including market prices, data and other information, believed to be reliable; however, Trade Nation does not warrant its completeness or accuracy. All market prices and market data contained in or attached to this communication are indicative and subject to change without notice.
Short Position On Us30"Shorted Dow Jones ⚡ Risk managed. Once +100 pts hit, we go risk-free. Protect the bag, let the trade run. #TradingDiscipline #DowJones"
US30 Short
Entry 46216.29
SL 46386.27
TP 45962.07
This is a short setup on US30:
The idea is to short at the rejection from the resistance zone / trendline.
Stop loss is placed safely above recent highs (46,386).
Target is near the previous support zone (46,091 → 45,962).
RSI momentum also supports bearish bias after rejection from overbought territory.
Fundamentally, the asset is currently overvalued against the Treasury Bond.
⚠️ Risk Note: US30 is highly volatile. Manage position sizing carefully.

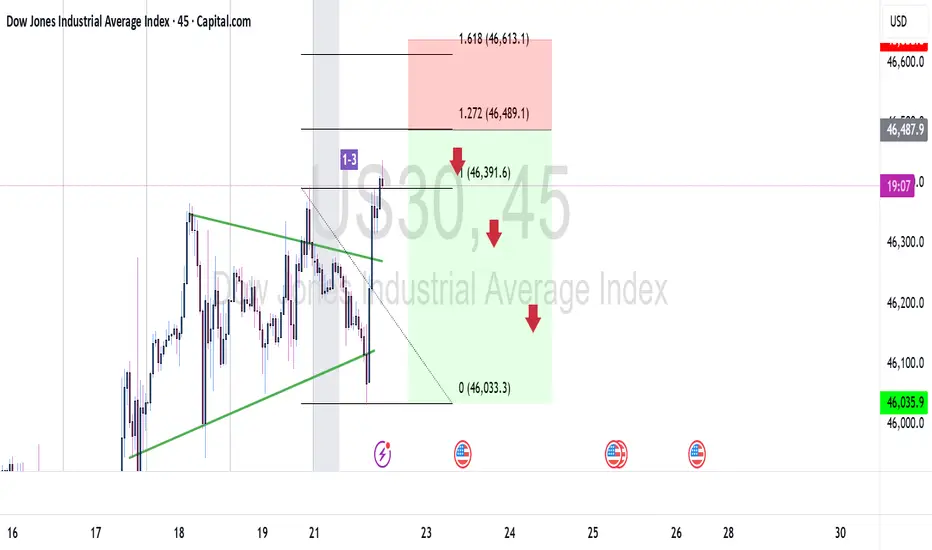
"Trade setup on US30 for a weekly sell"We have a market with a bullish accumulation that has been attracting buyers with an upward sentiment. What I’m looking for is a downward manipulation to shake buyers out of this accumulation, as you can see in this flag. It’s an accumulation that is breaking through highs, and banks usually look to break liquidity zones in order to generate their sales. In addition, the price needs to find stability since it has been rising too much. I see this sell opportunity as possible with this trading pattern I look for: problem, reaction, and solution.
Wall Street 30 Cash - Trading The Wedges Highest PointUS30 (Wall Street 30 Cash on the chart) is trading a Falling Wedge at it is highest point and could be due for a drop however the Falling Wedges at it's failure could trigger a new Bullish Trend for another $1K Rally while the 36500 Point still remains as strong resistance.
Bullish structure remains strong and though rejection from 46500 - 46800 could shot back to the level 46000.
Please add your ideas in the comment.
Thanks

Us30 1500 Pips Securedwww.tradingview.com
price swept SSL/PDL, created 1m IFVG and CISD, retested CISD, targeted BSL to secure 1500 pips!

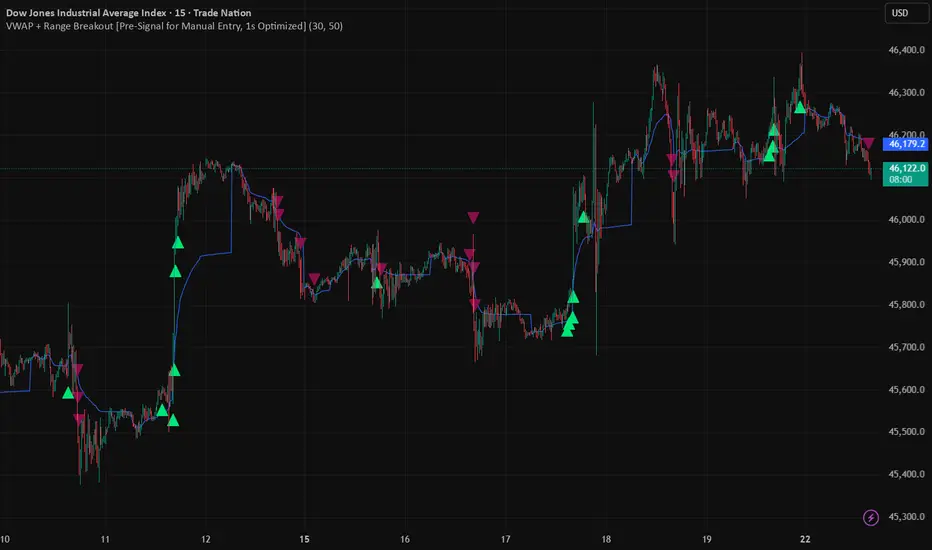
US30 NY Open | VWAP + Range Breakout Signal → Confirmed EntryWHAT THIS SHOWS
This idea highlights early pre-signals and confirmed breakout entries when price sweeps the previous day’s high or low (PDH/PDL) and aligns with VWAP and short-term range levels. Focus is on US30 around NY Open, when volume and liquidity are at peak levels.
HOW TO USE (NY OPEN FLOW)
1. Ahead of NY Open, mark PDH/PDL and watch how price builds a short-term range.
2. Best setups occur after liquidity is swept (PDH/PDL taken). Look for a pre-signal (early warning), then confirmation when a bar closes above/below the range and VWAP in the direction of trend.
3. Apply filters: SMA trend filter to stay aligned with bias; session filter to focus on London/NY hours.
4. Manage risk with stops beyond range edges or confirmation candle; partials at key intraday levels.
SETTINGS TIPS
Range Lookback → shorter for fast intraday charts, longer for higher TF.
SMA length → adapt to fit your bias framework.
Session filter → on for London/NY, off for continuous monitoring.
NOTES
Educational demonstration only. No financial advice.
For advanced versions with extra confirmations and filters → see my profile signature.
Us30 Trade Set Up Sep 22 www.tradingview.com
price is making LH/LL so overall it is bearish but it is approaching PDL so if price sweeps it and closes above i will look for a reversal IFVG on the 1m-2m to target the 4h FVG before looking for sells back down

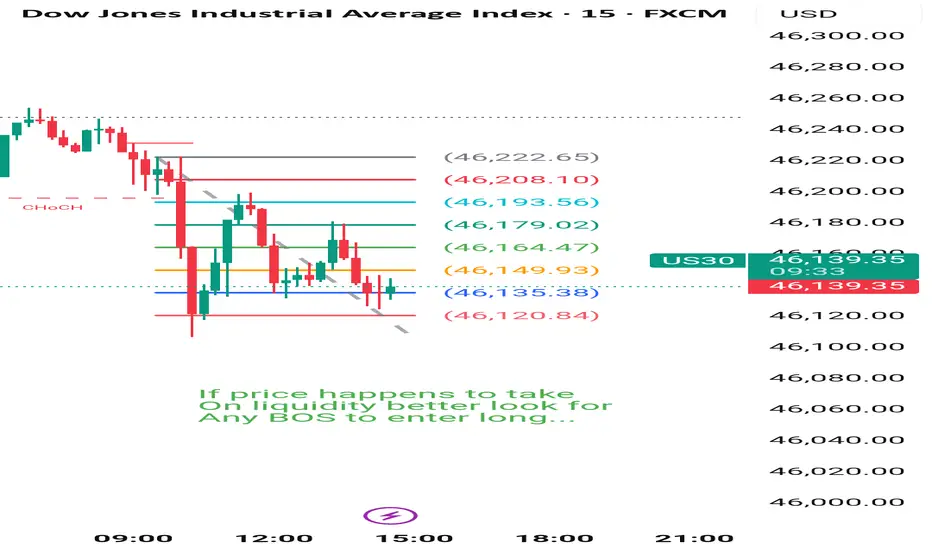
US30 – Key Pivot Zone Signals Next MoveUS30 – Overview
The Dow Jones remains under bearish momentum while trading below the 46,250 – 46,300 pivot zone, keeping pressure toward key supports.
📉 Bearish Scenario
Price targets a move toward 46,120 as long as it stays below 46,250 – 46,300.
🔻 A confirmed 1H close below 46,120 would strengthen the bearish trend, opening the path to 46,000.
📈 Bullish Scenario
If price pushes higher and achieves a 1H close above 46,300, bullish momentum would return, with upside targets at 46,400 and beyond.
Key Levels
Pivot: 46,250
Resistance: 46,300 – 46,400
Support: 46,120 – 46,000
US30 Day-trading Day 001Here we see price has been falling since the beginning of the day.
We can enter a short position on the
fib level ( .75 / .625 )
It all depends on your risk reward ratio.
Here price may also reverse only by targeting liquidity seen almost at the daily high.
Patience is key.
Lets wait for NY session where we may be able to have a clear confirmation of today's session.
US30 LongElite Analysis
Discretionary Trade with Confirmations
Targeting Structural liquidity at the top
US30 BEARISH SETUP After breaking into a new level, price managed to find resistance and made couple of attempts to break it but failed. A fall back to previously broken level is anticipated to test it as new support

[Short] Dow 30 (September 21, 2025)Entry: 46256.15
SL: 46288.65
TP: 46191.15
Trying another strategy what I found.
Backtest was done.
Live trade is on.

This may turn down soonThis channel is not providing individualized trading or investment advice, nor is it a banking service, brokerage service, trading service, investment service or money management service

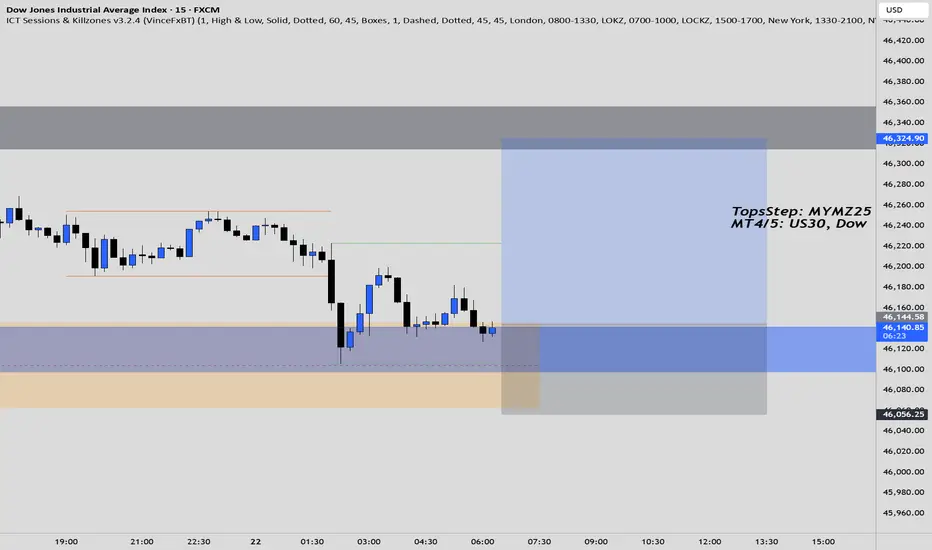
Dow Jones - US30: Trading Edge TodayDear Friends in Trading,
Experimental Test Phase Week:
Correlation Logic & Daily Efficiency - GOLD🔄NASDAQ🔄DOW JONES
🔎 Previous Week Observations -
Price built a volume base / cluster around 45,950 – 46,050 last week (multiple rotations here).
Breakout rallies on the 18th and 19th pushed price above 46,200, which is now acting as resistance/acceptance.
Current level (~46,273) is sitting right at this balance edge.
🎯US30 - 22Sept:
Pivot Area: 46,000 ± 50
Bias: Neutral-Bullish above pivot
Bull targets: 46,400 → 46,600
Bear targets: 45,800 → 45,600
👉 Gold and indices are inversely correlated intraday; if one pivots, the other confirms.
Dow showing slower but steady grind.
Needs >46,400 to confirm breakout continuation.
I sincerely hope my point of view offers a valued insight.
Thank you for taking the time study my analysis.
US 100Dow Jones ( DJI )
- Completed " 123 " Impulsive Waves
- Break of Structure
- Change of Characteristics
- Bullish Channel as an corrective pattern in Short Time Frame and Long Time Frame
- Resistance Level
