$PIUSDT Look promising if .2515 is broken Pi has been fluctuating around .2081 - .2195 and it’s looking bullish.
Anticipated next stop .315
Trade ideas
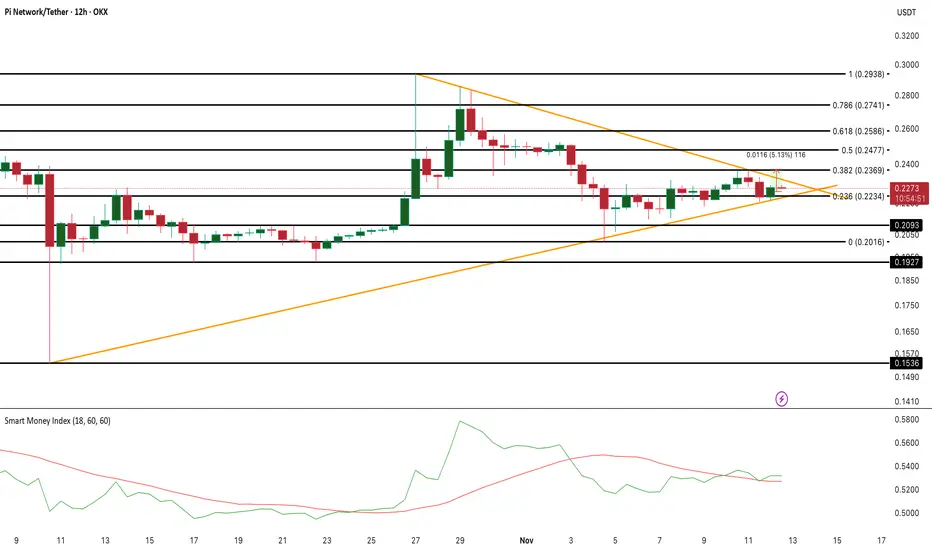
Smart Money Eyes Pi Coin Breakout; OBV, MACD Signal ShiftPi Coin’s price is pressing against the upper line of a symmetrical triangle, signaling a possible breakout attempt. The squeeze shows a tug between short-term sellers and early buyers trying to regain control.
On the 12-hour chart, the Smart Money Index (SMI) has turned up for the first time since early November, showing renewed participation from large holders. If the price closes above $0.23, it could confirm a breakout and target $0.26–$0.27. A failure to hold $0.20 would reopen the path to $0.15.
On the daily chart, the MACD — which tracks trend momentum — is flattening after weeks above its signal line, hinting that bullish pressure is fading. However, On-Balance Volume (OBV) is ticking higher, suggesting quiet accumulation beneath the surface.
Pi Coin’s price stands at a technical pivot — smart money seems to be betting on a breakout, not a breakdown.
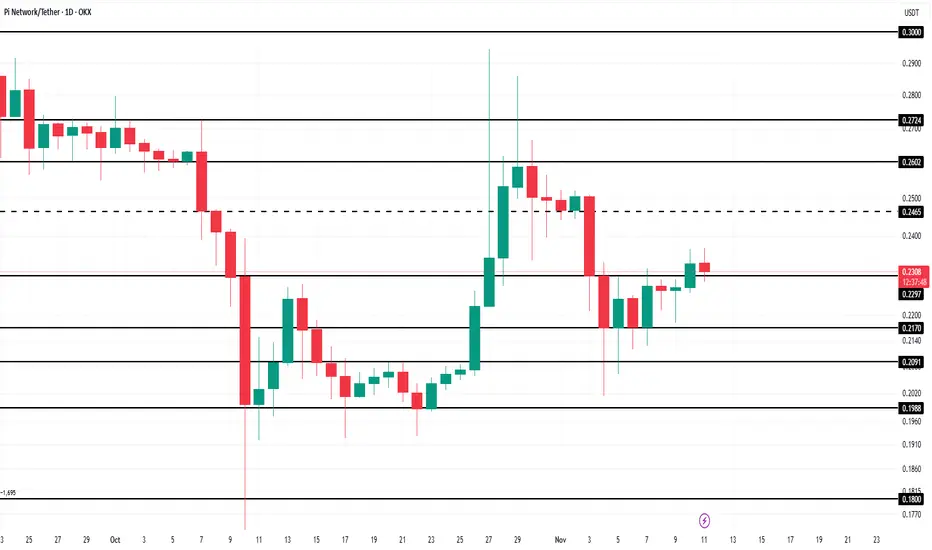
Pi Coin Investors’ Remain Weak as Price Eyes 15% Drop RecoveryPi Coin’s price stands at $0.235 at the time of writing, after successfully breaching the $0.229 resistance level within the last 24 hours. The altcoin now appears to be regaining some lost ground from its late October decline.
For Pi Coin to fully recover from its 15% drop, the price must break through the $0.246 resistance and rally toward $0.260. Achieving this would reinforce the bullish outlook and restore market confidence among cautious investors.
However, if the bullish momentum weakens, Pi Coin could slip below $0.229 again and test the $0.217 support level. A breakdown beneath this support would invalidate the bullish thesis and expose the cryptocurrency to further downside risks.
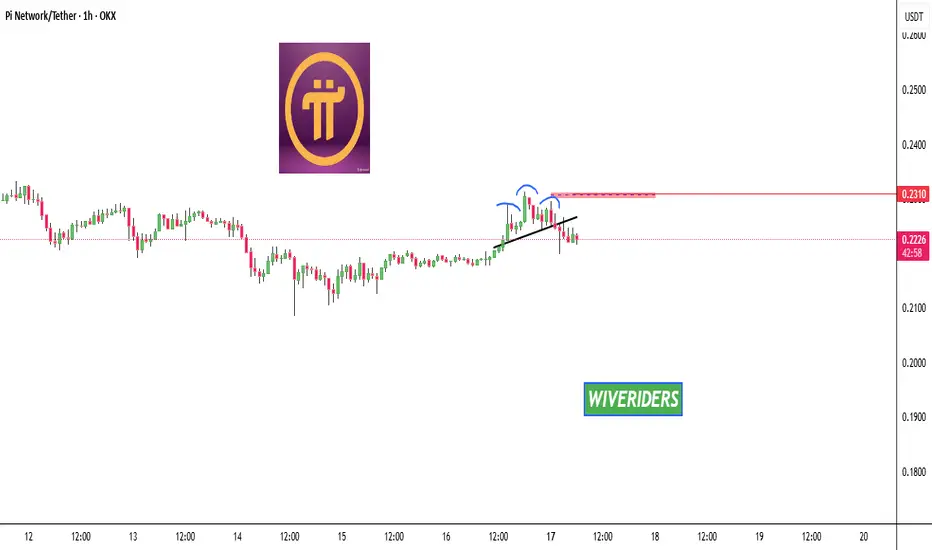
PI Update🚨📊 PI Update
PI has formed a bearish head and shoulders pattern,
and the price is dropping as expected from this structure.
What we want to see now is the price coming back up
and testing the red resistance zone 🔴.
If NASDAQ:PI manages to break out above this red resistance,
it could signal that the trend is turning bullish again
and buying pressure is returning.
This breakout will be the key confirmation for momentum shifting.
Pi Coin Price Approaches $0.20 — Another Sideways Phase?Pi Coin’s price has declined by nearly 16% over the past week after failing to breach the $0.260 resistance. At the time of writing, the altcoin is trading at $0.220, reflecting its weakening technical position amid fading market support and declining investor optimism.
If the downward trend persists, Pi Coin’s price could fall below $0.209 and reenter a consolidation zone between $0.209 and $0.198. This pattern, seen previously, could stall recovery attempts and extend the bearish phase for a few more weeks.
However, a bounce from current levels could shift momentum. If Pi Coin reclaims $0.229 as support, it could attempt a rally toward the $0.246 resistance. Sustaining inflows and investor interest will be critical to invalidating the bearish outlook.

What To Expect From Pi Coin Price In November 2025?At the time of writing, Pi Coin trades at $0.254, sitting just below the $0.260 resistance. The immediate short-term goal for the token is to reach the $0.300 psychological level, which would strengthen bullish confidence.
However, if investor sentiment remains weak and inflows fail to pick up, Pi Coin’s price may fail to breach $0.260. A breakdown through $0.229 could push it lower toward $0.209, deepening the current correction.
Conversely, if the altcoin gains momentum and climbs to $0.300, it would represent an 18% rise, potentially attracting new inflows. A sustained push could extend the rally toward $0.360, helping Pi Coin recover September’s losses and invalidate the bearish thesis.

Pi Coin Tests $0.29 as Bulls Eye Wedge BreakoutOKX:PIUSDT has surged over 30% this week, testing the upper boundary of its falling wedge near $0.29 — a level that could define its short-term trend. A daily close above $0.29 would confirm a breakout, targeting $0.32 and possibly $0.37, while a failure could extend the consolidation.
The $0.28 zone remains the first resistance to clear, with support at $0.20. A drop below that would invalidate the bullish structure and expose $0.18–$0.15.
Momentum indicators show mixed signals. The Smart Money Index has risen sharply since October 25, and the Chaikin Money Flow (CMF) turned positive, hinting at renewed large-wallet interest. The Money Flow Index (MFI) also shows steady retail accumulation.
However, a hidden bearish divergence between price and RSI (lower highs in price vs. higher highs in RSI) warns that OKX:PIUSDT 's rally could face short-term exhaustion if buyers fail to defend the $0.28–$0.29 range.

PIUSDT.P - October 29, 2025The chart shows a clear bearish market structure with consistent lower highs and lower lows. Price is currently retracing toward the $0.3584–$0.5342 resistance zone, where a sell short limit order aligns with the broader downtrend, targeting a continuation toward the $0.0953 support area.

Pi Network Pulls Back After Harsh RejectionPi Network’s recent rally has cooled off sharply after a strong rejection from the $0.28 region, following an impressive bounce from the Point of Control (POC) and daily support at $0.19. This confluence zone previously acted as the base for bullish continuation, but the latest price reaction signals a potential shift in short-term momentum.
The rejection from $0.28 suggests that sellers remain active near high-timeframe resistance. Now, with prices retracing below this level, maintaining support above $0.19 becomes crucial to preserving the bullish structure and preventing further downside continuation.
Key Points:
- POC Confluence: Support at $0.19 aligns with both daily structure and volume profile.
- Rejection Zone: The $0.28 level triggered strong selling pressure.
- Critical Decision Area: Price must hold above $0.19 to sustain the bullish bias.
If Pi Network fails to hold this support region, the probability of a deeper correction increases substantially, potentially leading to a retest of lower liquidity levels.
What to Expect:
As long as $0.19 remains intact, Pi Network may attempt another rotation toward $0.24–$0.28. A breakdown below it, however, could confirm a bearish shift and open room for extended downside movement.

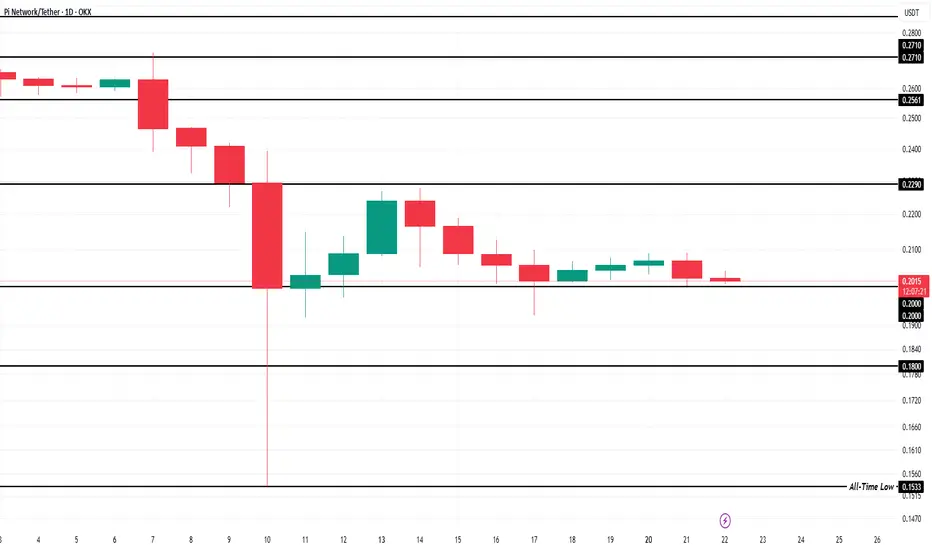
Pi Coin Price Consolidates — Next Stop: All-Time Low?At the time of writing, Pi Coin is priced at $0.203. It has maintained its position above the crucial $0.200 support for the past two weeks. Despite the mounting bearish pressure, the altcoin has managed to stay afloat, indicating some degree of resilience. If this consolidation holds, the price may continue hovering around current levels.
However, if bearish sentiment deepens and selling accelerates, Pi Coin may lose its grip on the $0.200 level. A breakdown below this floor could drag the price down to the $0.180 support level. This would place the cryptocurrency dangerously close to its all-time low of $0.153, a scenario that could spook long-term holders.
On a more optimistic note, if Pi Coin rebounds from its $0.200 base, it could target a move toward $0.229. A successful breach of this resistance would invalidate the current bearish setup and possibly set the stage for a short-term recovery.
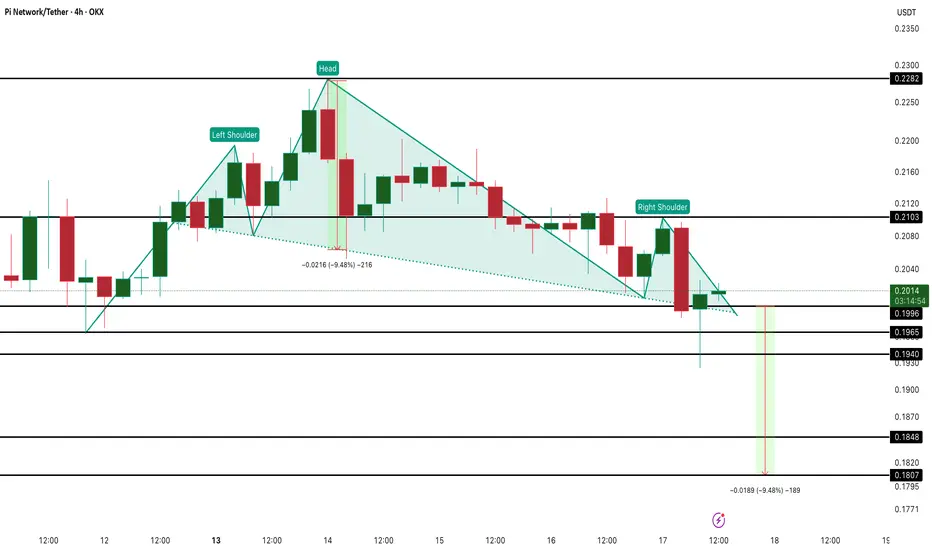
Pi Coin Price Nears Breakdown as $0.19 Support Faces PressurePi Coin (PI) is holding near $0.208, down almost 1% in the past 24 hours and more than 53% in three months. Retail buyers are trying to hold the line, but chart signals suggest more downside ahead.
On the 4-hour chart, Pi Coin is forming a head-and-shoulders pattern, a setup that often signals a breakdown inside a broader downtrend. The neckline sits around $0.199, and a fall below $0.196 could trigger a 9.5% drop toward $0.180.
The Money Flow Index (MFI) shows retail inflows improving slightly, forming a small bullish divergence — meaning dip-buying continues. But the Relative Strength Index (RSI) tells a different story. Between October 6 and 13, RSI made a higher high while price made a lower high, forming a hidden bearish divergence that points to fading momentum.
The Chaikin Money Flow (CMF) also remains under zero, showing weak large-wallet interest. For bulls to regain control, Pi must close above $0.210 — and a true reversal would need a breakout past $0.228. Until then, the pressure under $0.19 keeps the risk tilted to the downside.
Pi Coin Price’s Bullish Crossover Could End Month-Long TortureAt the time of writing, Pi Coin’s price stands at $0.214, slightly below the $0.229 resistance level. The altcoin is holding firmly above its $0.200 support, which serves as a critical base for recovery.
While Pi Coin has rebounded from its all-time low of $0.153, it still needs to reclaim significant ground to reverse the 33% crash. A decisive move above $0.229 could push the price to $0.256, supported by bullish technical indicators and investor confidence.
However, losing the $0.200 support would expose Pi Coin to renewed selling pressure. If that happens, the price could drop toward $0.180 or lower. This would invalidating the bullish outlook and signaling continued vulnerability in the market.

DON'T BUY Pi Network. It's a PUMP and DUMP.But feel free to short it if you desire.
This is Pi v ETH chart
It will continue it's trend to near ZERO.
Market makers will keep dumping into oblivion.
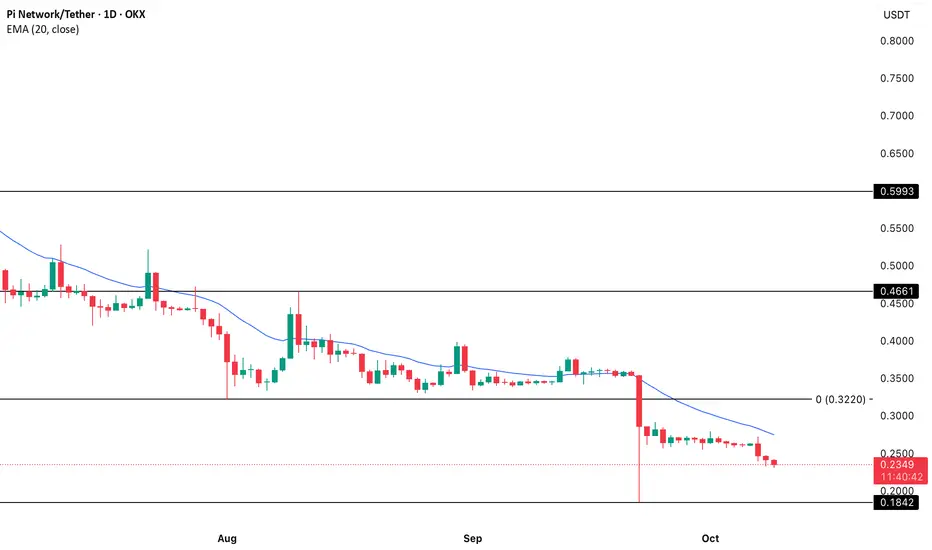
PI Faces Bearish Pressure Below Key 20-Day EMAAt the time of writing, PI’s price is struggling beneath its 20-day Exponential Moving Average (EMA), which currently acts as dynamic resistance around $0.27. The 20-day EMA tracks the asset’s average price over the past 20 sessions, placing greater emphasis on recent movements to reflect short-term market sentiment.
Trading below this line signals that sellers remain in control, with momentum skewed toward the downside.
Unless renewed buying pressure pushes PI back above the 20-day EMA, the token risks extending its decline and potentially setting a new low.
PUSDTBased on the technical analysis of the 2HR timeframe. A classic pattern is unfolding. And as soon as all criterias are met(price creating a new higher low) this will signal a new trend for the PI CRYPTOCURRENCY

Pi Coin Bullish Crossover Fails—Is Price Facing 23% Drop To ATL?At the time of writing, Pi Coin is trading at $0.239, just below the $0.240 threshold. The token has declined nearly 9% in the past 24 hours, reflecting growing selling pressure. Unless demand returns, Pi could continue to lose value in the coming days.
Based on current indicators, Pi Coin’s price could drop toward $0.200, with a possible retest of its all-time low (ATL) at $0.184—roughly 23% below current levels. Sustained bearish conditions would make this scenario increasingly likely.
Conversely, if the broader crypto market stabilizes, Pi Coin could stage a rebound. A move above $0.270 would invalidate the bearish outlook, paving the way for a recovery toward $0.286 and potentially higher levels.

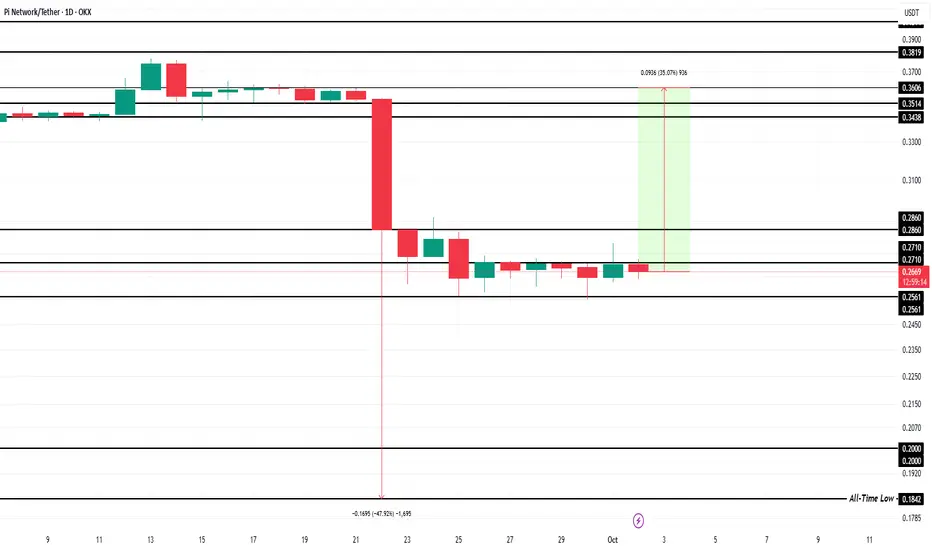
What To Expect From Pi Coin In October 2025?Pi Coin experienced a volatile August, followed by an even more turbulent September. The near 48% single-day drop dragged the token down to a new ATL of $0.184. This marked a severe setback for the project and testing investor patience.
In October, often referred to as “Uptober” for its bullish seasonal trend, Pi Coin could attempt recovery. A 35% rise would help the altcoin reclaim strength, with price targets set at $0.286 and $0.340. A rally past these levels could push Pi Coin to $0.360, effectively erasing the recent crash.
If declines continue, however, Pi Coin risks slipping below the $0.256 support. A deeper fall could send the price toward $0.200, invalidating the bullish outlook. This would signaling further weakness for the altcoin as investor hesitation lingers.
Is $Pi actually following my Assumption?As posted earlier, a break out of the golden circle to the UPSIDE is crucial for the NASDAQ:PI Network price chart. I don't think any experienced trader or investor will buy into an asset that is still in a price recovery, however this is Cryptocurrency where building infrastructure is KEY and sentiment drives prices easily.
PI Shows Weakening MomentumPI’s Average True Range (ATR) is steadily falling, signaling weakening momentum among spot market participants. The one-day ATR on PI/USD has trended downward since the sideways movement began on September 23.
This suggests narrowing price fluctuations and declining trader participation, highlighting the potential for a breakdown of the $0.2565 support level.
Price action confirms the bearish outlook, as PI trades below its 20-day Exponential Moving Average (EMA), which now acts as dynamic resistance.
The 20-day EMA gives more weight to recent price action, and trading below it indicates sellers are dominating and upward momentum is limited.
Overall, PI faces subdued trading activity and may continue its sideways movement, or potentially experience further downside if market sentiment does not improve.

MY VIEW ON PI NETWORK I am not expecting any dump beyond that golden circle,but this is crypto, it could happen with a quick bounce back up.
Either ways, I believe they are building continuously and price will definately catch up at some point.
Can Pi Network(PI) Bounce +15% From PRZ?In recent days, Pi Network ( OKX:PIUSDT ) has dropped more than -40% , raising the big question: Is Pi still a project we can rely on, or is momentum fading away?
Main Reasons Behind the Drop:
1-Mass token unlocks in September → Huge increase in supply created heavy selling pressure.
2-Rising exchange reserves → More than 420M now sitting on CEX wallets, a sign of potential sell waves.
3-Fast-track KYC & protocol upgrades → Gave many users access to their tokens, fueling more selling activity.
4-Low liquidity + whale sell-offs → A few large orders accelerated the decline.
The Pi community remains strong, but current supply shocks are outweighing demand. Until the project reaches full exchange listings and sustainable utility, traders should stay cautious and manage risk carefully.
---------------------------------------------------------------
Now let’s take a look at the PI Token chart on the 15-minute time frame .
The PI Token has formed a descending channel over the past day.
From the perspective of Elliott Wave theory , it looks like PI Token is completing a Double Three Correction(WXY) in the descending channel .
I expect PI Token to start rising as it enters or touches the Potential Reversal Zone(PRZ) again and rise to $0.289(+15%) . In general, a break of the upper line of the descending channel is a good sign for the PI token to rise .
Please respect each other's ideas and express them politely if you agree or disagree.
Pi Network Analysis (PIUSDT), 15-minute time frame.
Be sure to follow the updated ideas.
Do not forget to put a Stop loss for your positions (For every position you want to open).
Please follow your strategy and updates; this is just my Idea, and I will gladly see your ideas in this post.
Please do not forget the ✅' like '✅ button 🙏😊 & Share it with your friends; thanks, and Trade safe.

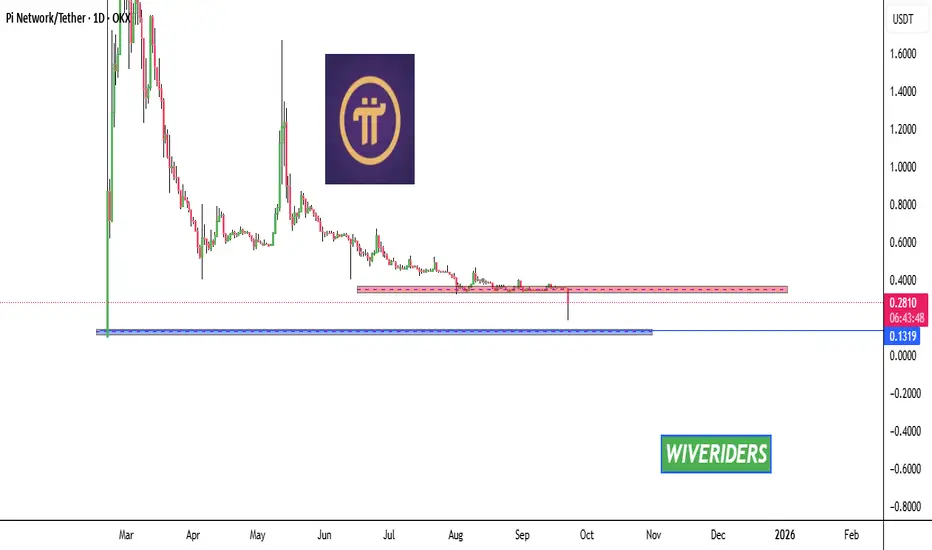
PIUSDT Range Play Within a Potential Descending TriangleAfter reaching a high of $2.9645, PIUSDT has experienced a sharp decline, establishing a base near the $0.38 zone. This base continues to hold, suggesting the formation of a potential descending triangle.
For now, the strategy is to trade the range while the structure matures. A break below $0.38 would likely trigger further downside toward $0.16, where a strong external demand zone aligns with the completion of a possible WXY corrective formation.
On the flip side, a breakout above the upper trendline of the triangle would be a strong bullish signal, potentially igniting a significant rally. Upside targets are already projected on the chart.
As the structure develops, all eyes remain on the key levels that will determine the next major move.

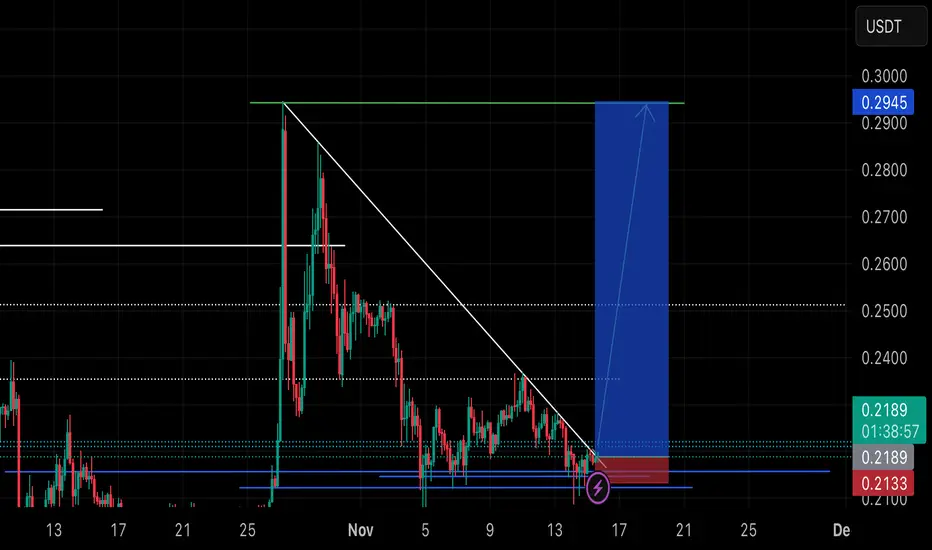
PI Market Update📊 PI Market Update
PI has moved strongly down, and there are two key levels to watch:
🔹 Support Zone – If the price keeps retracing into this level, it could potentially bounce up, as buyers previously accumulated here.
🔹 Red Resistance Zone – Still strong with sellers. If PI moves back here, it could face rejection and push down again.
⚠️ At the moment, there is no clear sign of stabilization. Entering now carries high risk of losses. Be smart and patient.
✅ If the red resistance zone breaks out with confirmation, it could signal the trend turning bullish again.