POL/USDT R AI analise?📈 POLUSDT – Daily Chart: Potential Resistance Levels
1. Immediate Near-Term Resistance (~$0.244–$0.246)
A recent daily analysis shows that price action ran into resistance around 0.2444–0.2459 USDT before pulling back, suggesting this zone is currently a short-term barrier.
AInvest
2. Psychologic
Related pairs

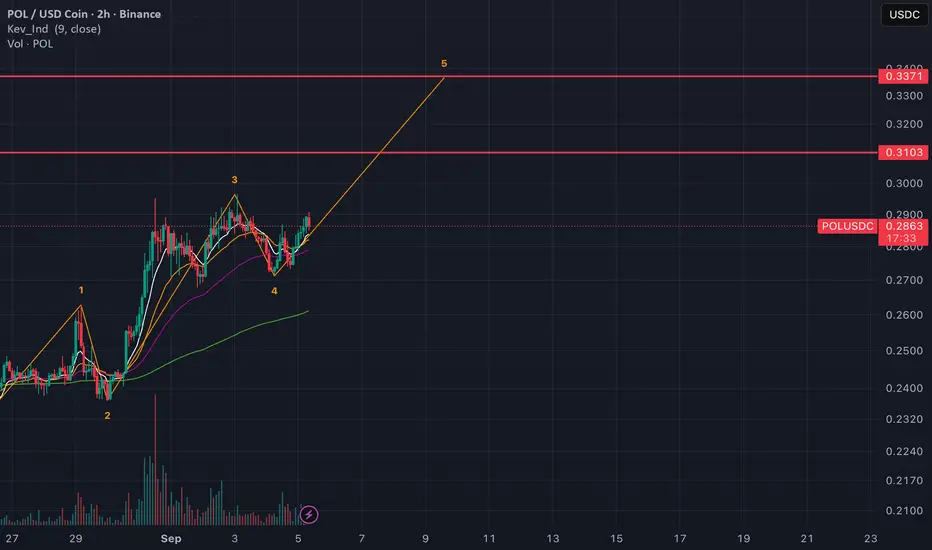
POL Elliot Waves ScenarioPOL bullish since 1 week.
These are the small rejections from which we can benefit.
Use leverage wisely. Profit around 2-3%.
Still remain a scenario where it can revisit 0.26 for retest.
Be carefully with your money management, and don't forget to set a stop-loss.
See all ideas
Summarizing what the indicators are suggesting.
Oscillators
Neutral
SellBuy
Strong sellStrong buy
Strong sellSellNeutralBuyStrong buy
Oscillators
Neutral
SellBuy
Strong sellStrong buy
Strong sellSellNeutralBuyStrong buy
Summary
Neutral
SellBuy
Strong sellStrong buy
Strong sellSellNeutralBuyStrong buy
Summary
Neutral
SellBuy
Strong sellStrong buy
Strong sellSellNeutralBuyStrong buy
Summary
Neutral
SellBuy
Strong sellStrong buy
Strong sellSellNeutralBuyStrong buy
Moving Averages
Neutral
SellBuy
Strong sellStrong buy
Strong sellSellNeutralBuyStrong buy
Moving Averages
Neutral
SellBuy
Strong sellStrong buy
Strong sellSellNeutralBuyStrong buy
Displays a symbol's price movements over previous years to identify recurring trends.