POLUSDT Forming Bullish WavePOLUSDT is showing an interesting technical setup as the price consolidates within a broader ascending structure. After weeks of accumulation, the pair has recently attempted a breakout, supported by growing investor interest and consistent trading volume. This suggests that the market is preparing for a strong move, with potential upside targets aligning well with the 50% to 60%+ gain expectation.
The price action highlights a bullish breakout structure, where higher lows and repeated resistance testing indicate increasing buying pressure. If this breakout sustains, POLUSDT could accelerate toward higher price zones, fueled by momentum traders and fresh inflows of capital. Such patterns often act as the beginning of a larger bullish wave, which makes this setup highly relevant for short to mid-term traders.
Investor sentiment around this project has been improving, with many considering POLUSDT as an undervalued opportunity compared to other crypto pairs. The combination of good volume, favorable technicals, and renewed interest strengthens the probability of further upside continuation. Traders should closely monitor breakout confirmations as the price approaches critical resistance levels.
✅ Show your support by hitting the like button and
✅ Leaving a comment below! (What is You opinion about this Coin)
Your feedback and engagement keep me inspired to share more insightful market analysis with you!
POLUST.P trade ideas

Is $POL (ex-#Matic) preparing for a breakout?After 4 months, the situation remains stable at OKX:POLUSDT
Key technical focus: breakout & consolidation above $0.28–0.30.
📌 Observations:
Market correction ongoing, yet #POL is holding strong.
Market Cap: ~$3B.
No major fundamental drivers currently seen.
📈 If momentum continues, x2 by the end of the year is realistic — possibly higher, depending on capital inflows.
What’s your view? Do you see hidden fundamentals supporting this strength?
______________
◆ Follow us ❤️ for daily crypto insights & updates!
🚀 Don’t miss out on important market moves
🧠 DYOR | This is not financial advice, just thinking out loud.
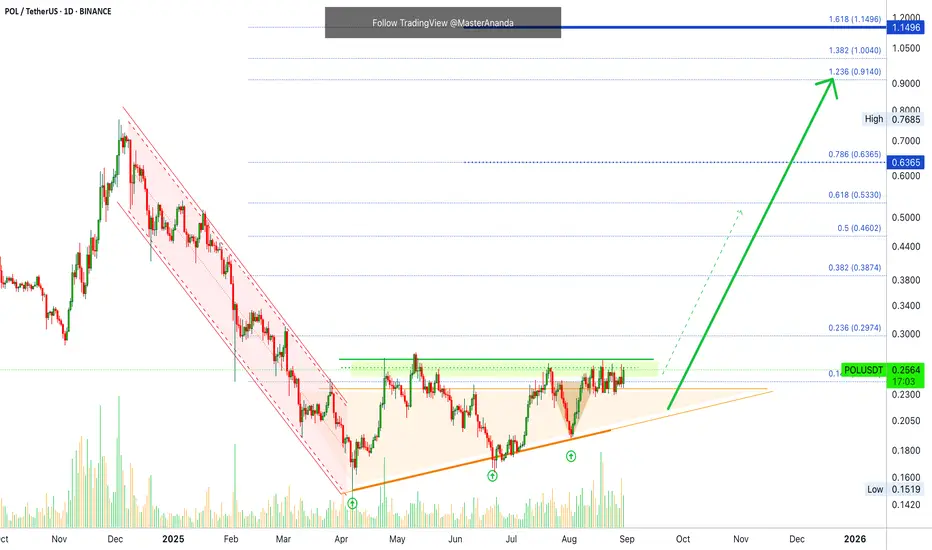
POLUSDT 1D#POL has broken above the resistance zone with strong volume. In case of a successful retest and bounce, the targets are:
🎯 $0.3023
🎯 $0.3377
🎯 $0.3883
🎯 $0.4526
⚠️ As always, use a tight stop-loss and proper risk management.

POL ; Important supportHello friends
Given the upward trend we had, now that the price has corrected, we have identified important and good support areas for you, and if these supports are maintained and stabilized above, the price can move to the specified targets.
Trade safely with us

POLUSDT Trading IdeaLikely a reversal to the downside from $0.2917, $0.3021 or $0.3068 provided the weekly order block is not mitigated.
The preferred position should be a short position

POLUSDT BULLISH SETUP I HOPE for this bullish count to be on right outlook .
if it mange to close above base channel and above 0.300 it may extended further to 0.50 maybe even try to test on 0.800

POL/USDT - Bullish Momentum BuildingHas been consolidating in a tight range over the past three weeks, showing strong support and resistance levels. As of now, we are witnessing a clean breakout from this range, supported by increasing volume and consistent buyer activity.
The breakout is accompanied by the early formation of a bullish market structure, with higher highs and higher lows beginning to form. This shift in structure suggests growing momentum on the buyer side and a potential trend reversal or continuation to the upside.

Polygon Update ·Everything Continues To Point HigherPolygon looks good. We have the same dynamics on this chart from the previous update.
There is a challenge of resistance currently taking place. This resistance is likely to break based on the fact that POLUSDT continues to trade closer and closer to it, with no more retraces basically. When this happens we know that resistance is weakening and with this weakening comes the next advance.
In early August there was a higher low and the preceding move was very steep and fast. And so was the recovery producing a v shape. After the v shape recovery POL has been sideways at resistance.
Late 2025. That's when the entire cryptocurrency market will have its bull-run. The date has not change; we are getting very close. The closer we get, the stronger the signals become.
Everything continues to point higher.
Thanks a lot for your continued support.
Namaste.
POL – Demand in Action!Price has been rejecting the resistance zone around 0.2620 – 0.2677 and is now approaching a key demand/support area near 0.2320 – 0.2270.
✅ If buyers step in here, we could see another bullish impulse toward the resistance levels.
✅ The demand zone remains a crucial area to watch for trend-following setups.
⚠️ However, a clear break below the 0.2270 support would invalidate this bullish scenario and shift the bias.
For now, I’m watching how price reacts at the green demand zone for the next potential swing.
📚 Always follow your trading plan regarding entry, risk management, and trade management.
Good luck!
All Strategies Are Good; If Managed Properly!
~Richard Nasr

Polygon (POL): Gameplan Remains The Same | Looking For BreakoutThe worst part of trading or the most important part, is the waiting so that's what we do here. The game plan has not changed for us; we keep on waiting for that proper breakout.
More in-depth info is in the video—enjoy!
Swallow Academy

POL/USDT Perpetual Swap on OKX1. Chart Context
Pair: POL/USDT Perpetual Swap on OKX
Timeframe: 1H
Current Price: ~0.2415 USDT
Bias: Long (buy) setup
2. Key Levels
Weekly Open / Daily Open (~0.2490–0.2500): Important level of interest for bulls; if reclaimed, it strengthens the long thesis.
Monday High (~0.2525): First liquidity target above.
Monday Low (~0.2410): Currently acting as short-term support.
Stop Loss (~0.2291): Below prior liquidity zone to invalidate the long.
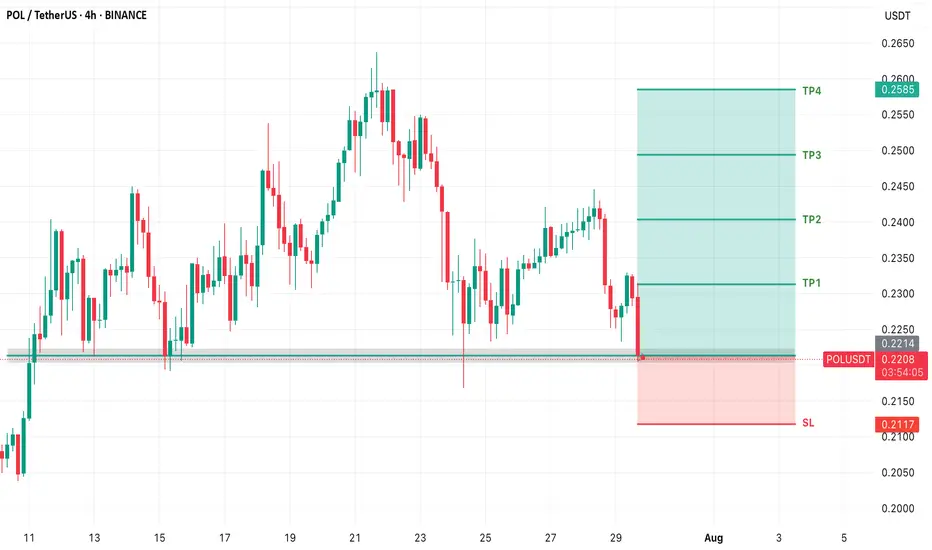
Take Profit (~0.2594–0.2610): Target aligned with previous resistance area.
3. Trade Setup
Entry Zone: Around 0.2410–0.2420 (near Monday Low).
Stop Loss: At 0.2291, below the structure and liquidity sweep area.
Take Profit: At 0.2594–0.2610, above Monday High and near prior resistance.
Risk/Reward Ratio: Roughly 1:2.5 (highly favorable).
4. Rationale
Price swept liquidity near Monday Low, trapping shorts and offering a favorable long entry.
Strong support confluence at Monday Low with risk defined just below.
Upside targets are clearly mapped to Monday High → Weekly Open/Daily Open → Resistance levels (~0.2610).
Momentum suggests potential mean reversion after the sharp decline.
✅ In summary:
This is a high R:R long setup with entry near 0.2410, invalidation at 0.2291, and targets up to 0.2610. The trade thesis is based on liquidity sweep and reclaiming key opens.

TradeCityPro | POL Testing Range Top Amid Bullish Momentum👋 Welcome to TradeCity Pro!
In this analysis I want to review the POL coin for you. One of the so-called Ethereum Killer projects that in the previous bull run was highly hyped to replace Ethereum and now with a market cap of 2.6 billion dollars is ranked 42 on CoinMarketCap.
📅 Daily Timeframe
In the daily timeframe, this coin, like most altcoins, is in a very long-term range box. Now, after significant buying volume, it has reached the Maker Seller zone at the top of the box.
✔️ Since the price has registered a higher low than the 0.1717 bottom, the probability of breaking the zone has greatly increased. On the other hand, buying volume has gradually increased as the price has moved from the bottom of the box to the top, which shows the strength of the bullish trend.
⚡️ Now several daily candles in a row are stuck near this zone, consolidating just below it. If the zone is broken, we can have a long-term long position or even buy this coin in spot.
📊 If the bullish move starts, the resistance levels we can use as targets are 0.3299, 0.4271, and 0.5310. If the bullish trend continues and there are no signs of weakness, each of these levels can act as a new trigger for a long position.
🔍 If the price gets rejected from the resistance zone, with the breakdown of the 0.2315 trigger, the probability of a bearish move toward the 0.1717 bottom also exists, and with the breakdown of 0.2315 we can open a risky short position.
💥 With the breakdown of 0.1717, we also get the main confirmation of the trend change, and if this level is broken, this coin could have a very large drop.
📝 Final Thoughts
Stay calm, trade wisely, and let's capture the market's best opportunities!
This analysis reflects our opinions and is not financial advice.
Share your thoughts in the comments, and don’t forget to share this analysis with your friends! ❤️

POLUSDTBINANCE:POLUSDT in high trading renge. But above dynamic trendline. We can open position buy but high risk level.
Supports: 0.2415 - 0.2300 - 0.2225
Resistances: 0.2600 - 0.2745
Please control risk management⚠️

Polygon (POL): Looking For Breakout | Good Trading Opportunity POL is about to explode, once again putting pressure on that 200 EMA zone. As soon as we break, this will give us a good opportunity to long so be ready!
More in-depth info is in the video—enjoy!
Swallow Academy

Polygon has successfully formed a strong bottom structurePolygon has successfully formed a strong bottom structure, showing signs of accumulation at lower levels. We are now witnessing the early stages of a potential breakout. If momentum sustains, this could confirm the bottom and open the path for a bullish move ahead.

The Top vs The Bottom · Polygon vs Bitcoin, Ether & XRPEthereum will keep on growing of course and Bitcoin as well. Notice the difference between Bitcoin, Ether, XRP and Polygon. What an incredibly huge difference. The three mentioned are trading at very high prices compared to past history while POL is trading very close to its bottom.
I mean, this can definitely be good.
POLUSDT is trading at bottom prices but the downtrend is no longer active. There are no new lows in more than four months. The entire wave between December 2024 and April 2025 lasted four months. So seeing the same amount of time that produced such a strong bearish move produce nothing more than consolidation, is good news.
Polygon has been trading at bottom prices but slowly going up. We have a rising bottom, an ascending triangle. The upper resistance that is keeping the pattern active is still valid and being challenged this week. As soon as this resistance breaks, expect maximum growth. Some pairs will move up right away while others will continue to consolidate for months.
Polygon's consolidation is reaching its end.
Thanks a lot for your continued support.
Namaste.

Polygon (POL): Possible Sellside Movement Well, the mic got detached and recorded on macs mic so here it is. Anyways, POL still looks bullish on bigger timeframes, but on smaller timeframes we are seeing a really good MSB has formed, so sell-side movement is our bet here.
Swallow Academy

POL/USDT Preparing for a Major Breakout?📊 Chart Overview:
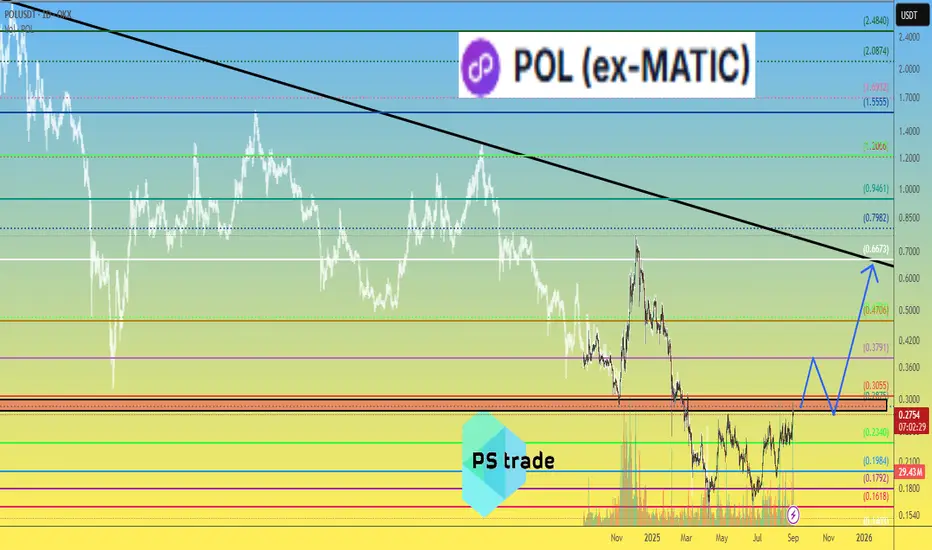
POL/USDT is currently showing signs of a potential trend reversal after months of sustained bearish momentum. The price is now testing a long-term descending trendline that has acted as a strong resistance since the November 2024 peak — and this moment could be a critical turning point for the market.
---
📌 Pattern Structure & Technical Setup:
🔸 Primary Pattern: Descending Trendline, capping every rally since late 2024.
🔸 Potential Reversal Structure: Falling Wedge Pattern – often a bullish reversal signal, supported by weakening bearish pressure and a series of higher lows forming since June 2025.
🔸 Current Position: Price is testing the trendline resistance around the $0.24–$0.27 zone.
---
📍 Key Price Levels:
✅ Resistance:
$0.2740 → Key breakout level; confirmation of trendline break.
$0.3290 → Important horizontal level, previously acted as major support.
$0.4301 – $0.7147 → Extended bullish targets based on Fibonacci retracement and historical price memory zones.
🛑 Support:
$0.2200 → Minor support if price rejects the trendline.
$0.1520 → Major long-term support (current all-time low).
---
📈 Bullish Scenario (Breakout Case):
If price successfully breaks and closes above $0.2740, we could expect:
Confirmation of a long-term downtrend breakout.
A shift in market sentiment from bearish to bullish.
Short-term target: $0.3290 → then $0.4301.
Higher upside potential if volume supports the breakout and altcoin momentum strengthens.
> 🚀 Volume will be the key validator – a breakout without volume = weak signal.
---
📉 Bearish Scenario (Rejection Case):
If the price fails to break the trendline:
Likely rejection and pullback toward the $0.2200 support zone.
If selling pressure increases, a retest of the $0.1520 demand zone is possible.
This would extend the consolidation phase or confirm continued bearish control over the medium term.
---
🔍 Conclusion & Trading Strategy:
POL/USDT is at a technical decision point. A confirmed breakout could mark the end of the accumulation/distribution phase and trigger a new bullish leg.
📌 Strategy Overview:
Breakout Traders: Enter after confirmed daily close above $0.2740, target levels above.
Reversal Traders: Enter conservatively after a retest of the breakout zone with a tight SL.
Bearish Traders: Consider shorts on strong rejection at the trendline, targeting $0.22 → $0.15.
---
🧠 Extra Notes:
Watch Bitcoin dominance and overall market sentiment.
Volume confirmation is crucial for validating breakout strength.
Be cautious of fakeouts, especially around dynamic resistance like trendlines.
#POLUSDT #CryptoBreakout #FallingWedge #AltcoinAnalysis #TechnicalAnalysis #CryptoSetup #PriceActionTrading #BullishBreakout #BearishScenario #CryptoReversal #TrendlineBreakout

PENDLE Breakout Watch – Red Resistance Being Tested! 🚨 CRYPTOCAP:PENDLE Breakout Watch – Red Resistance Being Tested! 🔴⏳
CRYPTOCAP:PENDLE is testing the red resistance zone.
📊 If breakout confirms, next move could target:
🎯 First Target → Green line levels
A breakout here could trigger buyer momentum and push price toward the next key resistance.

Polygon · Bottom, Recovery & 5,000% Growth PotentialPolygon has been bullish since April, clearly rising from its base for months. Now this Cryptocurrency trading pair is preparing for a new phase and market cycle. It is preparing for its 2025 bull market wave.
Polygon after a major drop produced a clear bottom and higher lows. This process has been active now four 120 days/4 months. This is a long consolidation period and there are no new lows, clearly. A rising triangle as a reversal signal is also present on the chart.
The accumulation period has been lasting, we can see how patience is key for success. Who would be able to hold for four long months? Who is still holding wise for 120 days?
Well, those who wait get paid. Those who waited will get paid but there is no need to wait because you can still buy and profit from the incoming bullish wave. The difference is that prices are higher now so growth potential is limited compared to several months in the past, that's how it works. The market builds up strength slowly and as this strength is being built prices grow.
When there is enough strength, enough interest and enough growth, the masses enter the market and this produces a major bull run. I've been warning you, we are getting very close. The action is already happening now, don't be surprised when you see a 300%+ bullish jump. That is exactly what is coming and it will all happen within a few months.
Expect 500% to start but aim for 1,000%, 2,000% and in some cases even more. Many good, strong and reputable pairs will grow 3,000%, 4,000% or 5,000%. Polygon will be one of the big ones.
Thanks a lot for your continued support.
Namaste.

POL USDT LONG TRADE SETUPNew Trade Setup: POL-USDT
LONG
Entry: 0.1979 OR CMP
Target: TP1: 0.2049, TP2: 0.2118, TP3: 0.2188, TP4: 0.2257
Stoploss: 0.1891
Leverage: 1X
Technical Analysis: POL/USDT has been facing strong resistance, and a price reversal may occur soon in the short term.

POL USDT LONG TRADE SETUPPOL/USDT is currently at strong support zone, High chance of price reversal after taking the liquidity from this zone.
Polygon (POL): Really Good Buying Opportunity | 250% IncomingWe are seeing a good buyside momentum kicking in very soon, which would give us really good R:R ratio trading setups, where we could easily make 100% and potentially 250%.
More in-depth info is in the video—enjoy!
Swallow Academy
