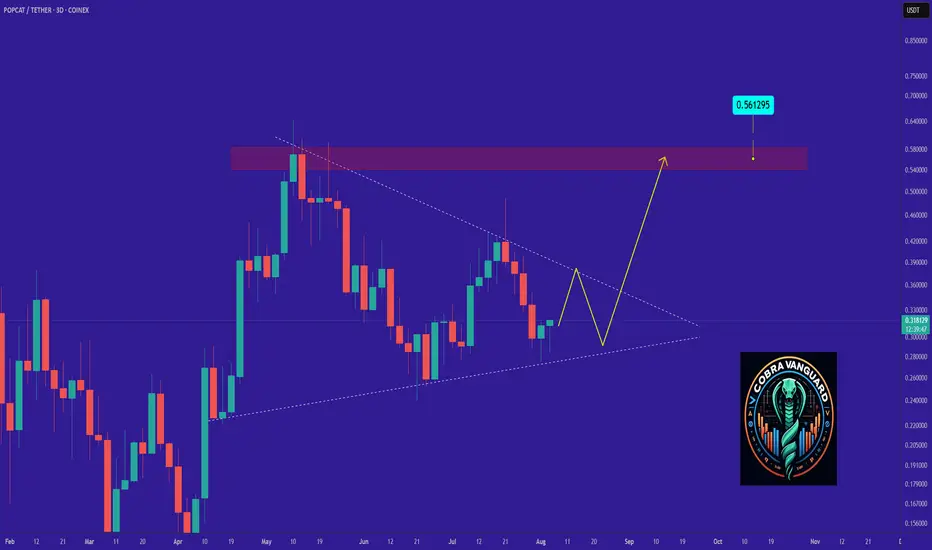
POPCAT's Situation (3D) !!!So if you pay attention to the POPCAT chart you can see that the price has formed a Ascending wedge which means it is expected to price move as equal as the measured price movement.( AB=CD )
NOTE: wait for break of the WEDGE .
Best regards CobraVanguard.💚

POPCAT/USDT — Descending Triangle: Ready for a Major Move?1. Current Market Condition
POPCAT/USDT is sitting at a very critical level. After a prolonged downtrend since late 2024, the price has formed a clear descending triangle, with consistent lower highs pressing from above while the 0.22–0.30 support zone continues to act as a strong demand area.
Thi

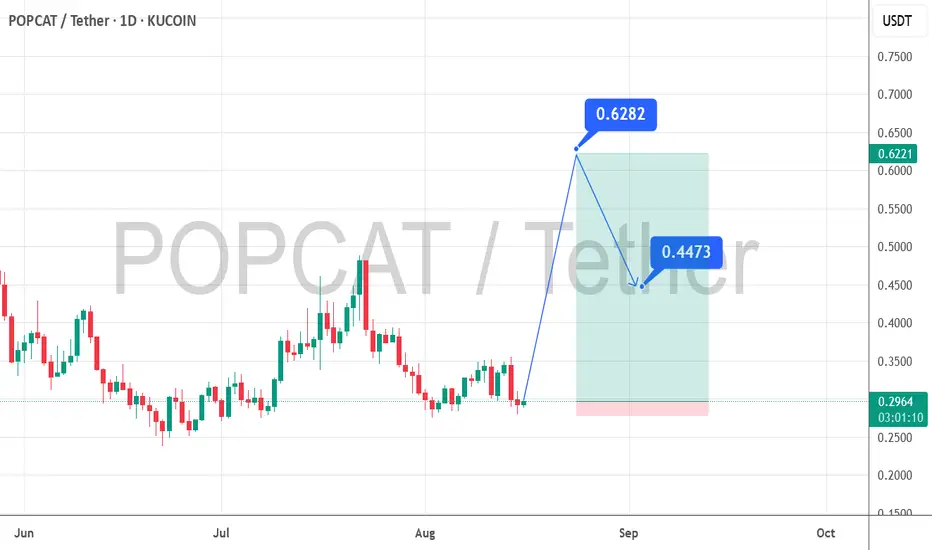
BEARISH SELL ON POPCATUSDTConfluences for the sell are-
1) Market Structure- BoS
2) POI/Key Level- Trendline & Supply
3) Quasimodo(QM)
Note: the market is all about probabilities which also makes my analysis a probability.

POPCATUSDT 100% Gains? After a period of consolidation, POPCAT is beginning to show signs of a bullish reversal. Indicators such as MACD and RSI are turning positive, and trading volume is on the rise — a classic setup for a breakout. If the price successfully breaks above the key resistance at $0.38, the next target coul
POPCAT/USDT – Weekly Chart TAPOPCAT/USDT – Weekly Chart TA
Price abhi bhi falling channel ke andar trade ho raha hai, lekin support zone se bounce ka chance hai.
Key Support Zones:
0.2536 – 0.2500 USDT
0.1567 USDT (major last defense)
Breakout Confirmation:
Agar price 0.4290 ke upar close deta hai toh pehla target 0.5301 U

POPCATlet see what will happen my expactation it is. it is doing w and high. there is idm level and below of it exist fvg and order block when you check daily and weekly you will see the level which i mention

POPCAT - Time to buy again!The triangle pattern will break in the direction it is breached, and the price will move in that direction. In my opinion, the price could be bullish and may up to $0.50.
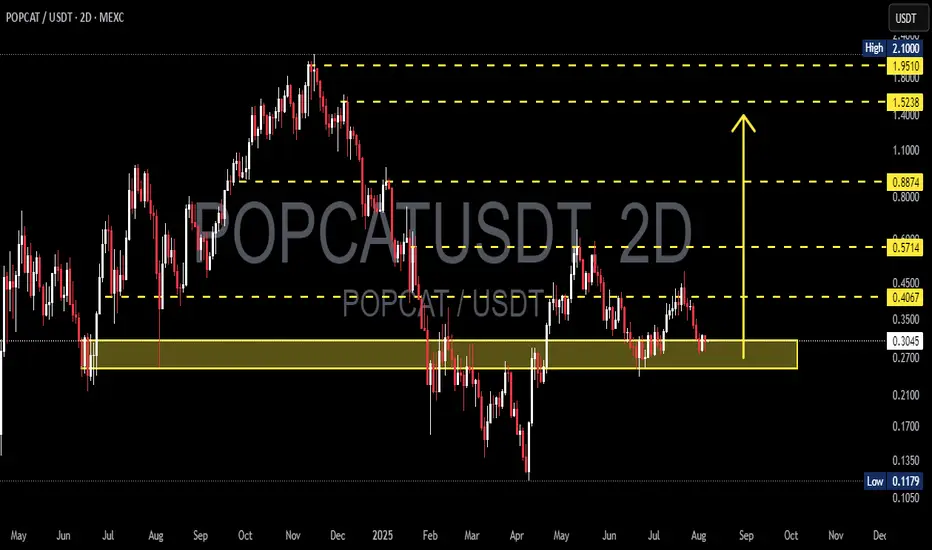
POPCAT/USDT – Testing Demand Zone: Reversal or Breakdown?POPCAT/USDT is currently retesting one of the most crucial demand zones in its mid-term price structure, located between $0.2700 – $0.3037. This area has historically acted as a strong support level and has triggered significant rebounds in the past. The market's reaction here will be key in determi
POPCAT down trend buy at weekly low BBPOPCAT andn All altcoins are in downtrend for past few days.
Both 3d and weekly charts not showing any reversal yet.
We have a plan and hope for weekly BB low band touch where we will load up. around
Patience is the key here.

$POPCAT – Patience Before the Pounce
BYBIT:POPCATUSDT holding up well—expecting a move after 2 weeks of ranging.
Starting to slowly scale in around 30c and under (if you haven't already).
Will reassess if 24c is lost and stays below for too long.
Still targeting $1 if momentum kicks in.

See all ideas
Summarizing what the indicators are suggesting.
Oscillators
Neutral
SellBuy
Strong sellStrong buy
Strong sellSellNeutralBuyStrong buy
Oscillators
Neutral
SellBuy
Strong sellStrong buy
Strong sellSellNeutralBuyStrong buy
Summary
Neutral
SellBuy
Strong sellStrong buy
Strong sellSellNeutralBuyStrong buy
Summary
Neutral
SellBuy
Strong sellStrong buy
Strong sellSellNeutralBuyStrong buy
Summary
Neutral
SellBuy
Strong sellStrong buy
Strong sellSellNeutralBuyStrong buy
Moving Averages
Neutral
SellBuy
Strong sellStrong buy
Strong sellSellNeutralBuyStrong buy
Moving Averages
Neutral
SellBuy
Strong sellStrong buy
Strong sellSellNeutralBuyStrong buy
Displays a symbol's price movements over previous years to identify recurring trends.