AVN – TECH BUY CALL | 1H TF| 04 Oct 2025| By The Chart AlchemistAVN – TECH BUY CALL | 1H TF | 04 Oct 2025 | By The Chart Alchemist
The stock is moving within a bullish channel (marked with light pink). After touching the bottom of the channel, it has started to show signs of reversal. We expect the stock to move upward from here and achieve multiple bullish targets.
📢 Disclaimer: Technical analysis by Mushtaque Muhammad (The Chart Alchemist).
Trade ideas

AVN Breakout with Strong FundamentalsTechnicals: AVN broke out of the daily supply zone and has retraced to the 0.5 Fibonacci level. A buy at CMP is recommended, with a stop loss below the last low and targets at recent highs.
Fundamentals: Avanceon Limited has successfully secured $8.8 million worth of strategic projects across Qatar, Saudi Arabia, and the UAE, strengthening its regional presence and growth outlook.
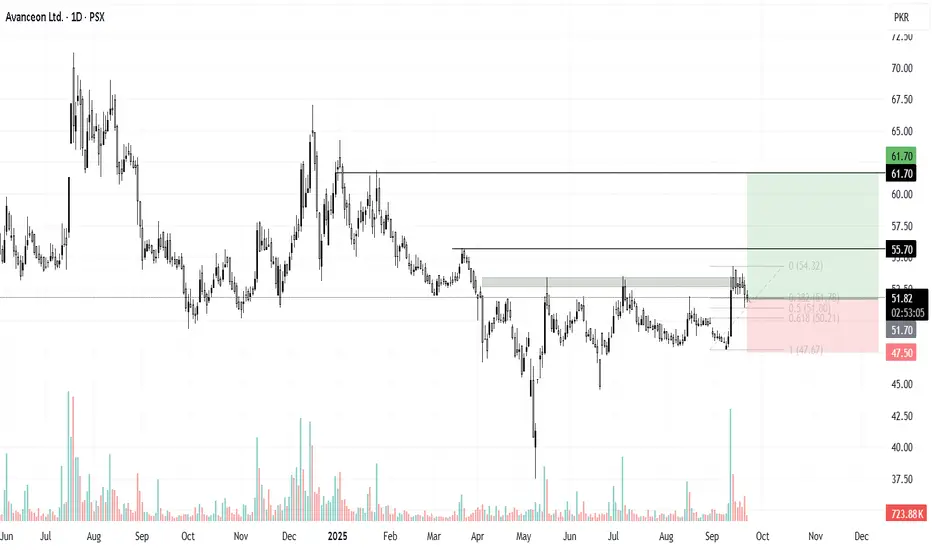
Bullish Divergence on DTF.
Bullish Divergence on DTF.
Important Resistance is around 52.50
However, sustaining this level will
expose 55 - 60 zone.

AVNTrade Plan (Not Financial Advice)
Entry: On retest of 49–50 zone or breakout above 52 with volume.
Stop-loss: Below 46.
Targets:
T1: 57
T2: 60–62

AVN AnalysisAVN is tricky one. In my humble opinion, and you may disagree with it, it is forming a bullish harmonic gartley pattern.
It may retrace to around Rs. 30 and then may go up to 150+.
This is as per my limited knowledge and understanding and is not a buy / sell call.

AVN can become volcanic anytime...AVN can become volcanic anytime...
Currently, it is in a rising channel, being accumulated slowly in a rising channel.

AVN has completed its retracementAVN has completed its retracement, and taking support from its trendline

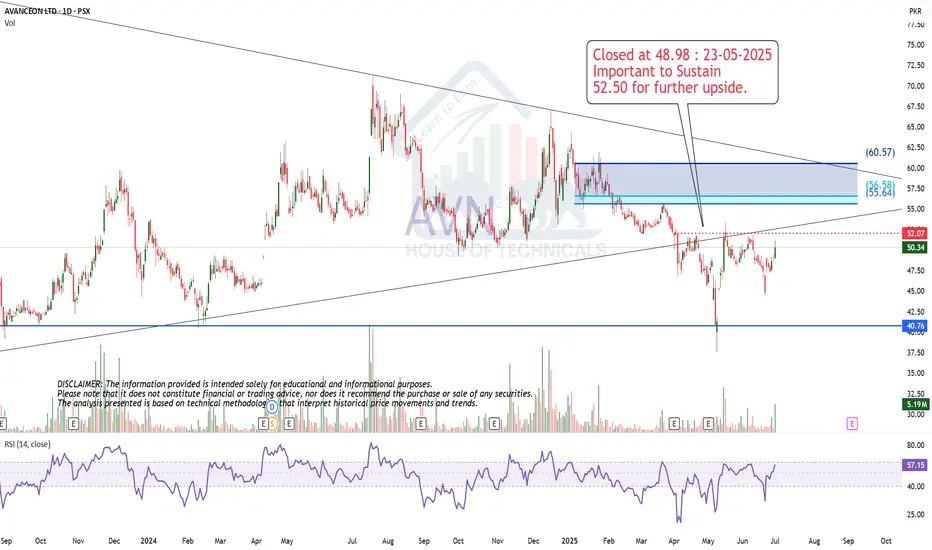
Let it Sustain 52 - 52.50Closed at 48.98 : 23-05-2025
Important to Sustain
52.50 for further upside.
AVN SHORT-SELL/EXIT TRADE 19-05-2025AVN Short Sell Setup/Exit Call:
AVN is in a continuous downtrend, having previously changed character to bearish. Multiple supply zones and flipped supply zones indicate potential for further downside. Supported by strong selling volumes.
*Short Sell Levels:*
- *Short Sell 1:* PKR 47.8 (current level)
- *Short Sell 2:* PKR 49.1
- *Short Sell 3:* PKR 51
*Target Prices:*
- *TP1:* PKR 45.1
- *TP2:* PKR 41.1
*Stop Loss:* Above PKR 53.7
*Risk-Reward Ratio:* 2.8

AVANCEON PSX (Daily Time Frame) Technical Analysis – AVANCEON LTD (PSX, Daily Chart)
Pattern: Inverse Head and Shoulders
Divergence: Bullish
Analyst: Musarrat Karamat | Date: 13-06-2025
AVANCEON Ltd (listed on PSX) is currently forming a classic Inverse Head and Shoulders pattern, which is a strong bullish reversal setup. The neckline breakout has been identified near the ₨53.97 level, which is the Buy Stop trigger for a long position.
Buy Stop: ₨53.97 – A breakout above this level would confirm the reversal and signal bullish entry.
Stop Loss: ₨47.12 – Placed below the right shoulder, providing a safe risk buffer in case of a failed breakout.
Target 1 (TP1): ₨60.57 – The first target is derived from the neckline-to-head distance projected upward.
Target 2 (TP2): ₨66.35 – A more optimistic target if bullish momentum continues post-breakout.
The RSI (Relative Strength Index) below the chart shows a bullish divergence, which further supports the reversal thesis. The RSI broke out of a downtrend with increasing momentum, hinting that institutional buying may be underway.
The price is currently trading around ₨50.05, indicating that the breakout hasn’t occurred yet. Traders should patiently wait for confirmation above the buy stop level before entering the trade.
Conclusion:
The setup reflects a textbook inverse head and shoulders with bullish divergence confirmation. If the neckline is broken decisively with strong volume, the stock may rally toward ₨60.57 and ₨66.35. However, prudent risk management is crucial, with a stop loss at ₨47.12 to limit downside exposure.

AVN SHORT-SELL/EXIT FOLLOW-UP TRADE (FRESH ENTRY)AVN is trending in a downward channel. After posting a healthy pull-back, AVN has been rejected from Breaker Block.
🚨 TECHNICAL SHORT SELL/EXIT CALL –AVN 🚨
🎯 SHORT-SELL/EXIT ZONE: Rs. 48.3-51
📈 TP1 : Rs. 45.1
📈 TP2 : Rs. 41.1
🛑 STOP LOSS: ABOVE Rs. 53.7(Daily Close)
NOTE – Prices are of ready market
📊 RISK-REWARD: Medium Conviction | 1:2.75
Caution: Please enter/exit in 3 parts in give range. Close at least 50% position size at TP1 and then trail SL to avoid losing incurred profits in case of unforeseen market conditions.
PLEASE BOOST AND SHARE THE IDEA IF YOU FIND IT HELPFUL.

AVN SHORT-SELL TRADEAVN been in DOWNTREND since Sep 2024.
Recent up leg has been mostly due to across the board Bullish Sentiments because of improvement in Geo Political Environment.
Current Up Move is also just a healthy Pullback in overall Downtrend.
There's strong Bearish Breaker Block overhead current levels which will obstruct any upward movement.
🚨 TECHNICAL SHORT SELL CALL –AVN 🚨
🎯 SHORTSELL ZONE : 52.2-50.2
📈 TP1 : Rs. 46.5
📈 TP2 : Rs. 41.2
🛑 STOP LOSS: Above Rs. 55 (Daily Close)
📊 RISK-REWARD: High Conviction | 1:3.8
Caution:
Please close at least 50% position size at TP1 and then follow strict trailing SL to avoid losing incurred profits in case of unforeseen market conditions
PLEASE BOOST THE IDEA IF YOU FIND IT HELPFUL.


AVN SHORT TRADEAVN has recently broken its uptrend and also made Bearish Breaker Block which will act s resistance and further downfall
Short Sell AVN 47-51
TP1 43
TP2 37
SL 56

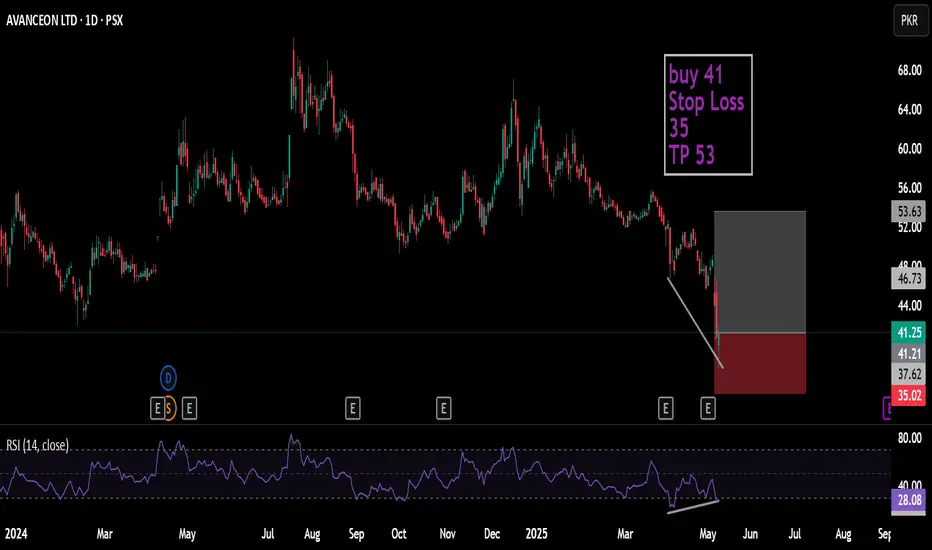
AVNbuy 41
Stop Loss 35
TP 53
Buy at stronge support with Bulish Divergence at RSI also Green candle close.
AVN is BullishPrice was in a downtrend consistently printing lower highs and lower lows. However, a bullish divergence on daily timeframe hints the return of bulls, and if previous lower high is broken with good volume then we can expect a bullish breakout as per Dow theory. Targets are mentioned on the chart.

AVN in Bearish trend AVN in Bearish trend about to face a trend reversal RSI diversions can be seen. Entry with a buy stop above the last lower high

Play wisely!Currently at an Important Support level.
Bullish Divergence on Daily Tf.
Currently also at Channel Bottom.
Couple of Bullish Candles will confirm that
Channel Bottom is respected.

Trading in a Parallel Channel on Monthly TF.Trading in a Parallel Channel on Monthly TF.
Strong Support around 49 - 50 & then 54.
However, 53.20 if SUstained on Weekly
basis, may give further upside around 57 - 58
To be in Uptrend, it should cross 61 - 62. &
Don't Forget the Channel Top is around 75 - 77
On the flip side, 46 is the last level that should
not break.

AVN-Available at a trendlineAVN is at the trend line support and therefore can be bought at CMP=53.08 with a SL of 50 and TP can be 66

Currently at a Very Good SupportMonthly Closing above 58 would be a positive sign.
It is Currently at a Very Good Support & it should bounce
from this level towards 60 - 62.
However, Next Support levels are around 55 - 56 & then 49 - 50.
More Positive Momentum will start after 71 - 72.
Initial Resistances are around 63 - 65 & then around 82 - 83.

AVN | Inverse Head & ShoulderInverse head & shoulder pattern is observed in hourly time frame, that leads the price towards 62 - 63.70

Analysis of AVN Stock: Bearish Trend and Short SellingIn our recent analysis of AVN stock, we have identified a prevailing bearish trend that suggests a strategic pivot towards short selling. The current market conditions indicate that the stock is poised for further declines, making it an opportune moment for traders to consider short positions.
Key indicators suggest that AVN's price may continue to drift lower, reinforcing the idea of a potential downtrend. Our analysis has determined a target price level where we believe the stock could reach its lowest point in this cycle. This provides a clear framework for risk management and profit-taking for those engaging in short buying.
Given the negative sentiment surrounding AVN and external factors impacting its performance, we recommend closely monitoring market developments while positioning oneself to capitalize on anticipated price movements. As always, prudent risk management strategies should be employed when trading in bearish conditions.
Overall, with careful consideration and strategic execution, there are promising opportunities within the current landscape of AVN stock for savvy investors looking to navigate this bearish phase effectively.
