AVN Offers 50% gainthe stock is currently in its uptrend, Instant entry can be made here with strict SL of 49 with first TP around 86 and second TP around 98 for over 50% gain within next 4-6 months.
However, careful traders should enter the trade only once it breaks its previous HH around 71.2 with same SL (mentioned above), however, this time the gain will be confined to 37-38%
The stock after significant consolidation has broken out the Falling Wedge Pattern on Weekly time zone, Thereafter making consistent HHs and HLs.
Trade ideas

AVN to provide 38% gain within next 4-6 monthsthe stock is currently in its uptrend, Instant entry can be made here with strict SL of 49 with first TP around 86 and second TP around 98 for over 50% gain within next 4-6 months.
However, careful traders should enter the trade only once it breaks its previous HH around 71.2 with same SL (mentioned above), however, this time the gain will be confined to 37-38%
The stock after significant consolidation has broken out the Falling Wedge Pattern on Weekly time zone, Thereafter making consistent HHs and HLs.


AVN - Monthly TargetThis signal is only for long term investor who can hold their holding in AVN with patients. this is good time to accumulate and buy on dip. you will see the Target price soon.
only for Investers not for traders :)

AVN, Bullish Channel with Flag Breakout- Weekly Bullish Flag
- Breakout of flag
- Now trading in Bullish Channel
- Time cycle indicated
- A complete cycle takes around 220 days
- This cycle completed around 200 days
- New cycle and bullish moment is expected in next 20-30 days
- upcoming board meeting may trigger this cycle
- Buy suggested with SL of closing below 48
- Take profit on top of channel
- Ultimate target is 140

AVN potential Buy setup (Weekly)Reasons for bullish bias:
- Price bounced from ascending channel support
- Price respecting long-term upward trendline
- Strong weekly closing at support
- RSI is synched
Here are the recommended trading levels:
Buy 1(CMP): 54.55
Buy 2: 43
Stop Loss Level: 36
Take Profit Level 1: 69
Take Profit Level 2: Open

AVN-PSXUsing pure price-volume analysis with a Renko chart, you can identify different support and resistance levels. By using a volume indicator, you can determine the most traded price level, which represents the accumulation zone—around 55.74. The price range between 54.12 and 56.90 is also an accumulation zone. Adjust your strategy accordingly by taking profit or accumulating more, based on your level.

AVN- intarday callis currently in a bearish trend , possibility of reversal from this zone
intraday entry is recommended

...but that needs a ConfirmationImportant Support seems to be around 46 - 47.
However, Immediate Support can be around 52 - 53
but that needs a Confirmation.
Immediate Resistance is around 62 - 62.50

Avanceon buy IDEAIf AVN holds its long term resistance turned into support and keeps moving in the same parallel channel 70 and 80 could be the next targets

AVN - Look & LeapLarger Trend: Bullish
Smaller Trend: Bearish
Buy Scenerio:
1. Price reaches to buy zone, put stoploss at below of buy zone and tp must be at mid range.

Bullish on Weekly TF.
Initial Support lies around 64 - 64.50 & then around 61.
Immediate Resistance lies around 66 and then around 69.
However, important to Sustain 66 - 67 on Monthly basis.
In worst case, it may touch 57 - 59 area.

AVN - Break of horizontal resistance on daily.AVN was in downtrend, it had broken its trendline previously. Recently it has broken its horizontal resistance, we are anticipating a long move in AVN, stoploss is placed to manage the risk effectively.

AVN | Pennant Pattern OR Double Top?The AVN stock price currently exhibits a Pennant pattern with a confirmed breakout, indicating a bullish momentum in its price action. Presently, the resistance level stands at 63.20, potentially forming a double top pattern. Upon completion of this pattern, the projected target for the Pennant pattern is approximately 70.


AVN (LONG) ANALYSIS 2.0pateeince do same
ChatGPT
🚀 Trade Alert: AVN Bullish Trend & Horizontal Support 🚀
We have identified a bullish setup in AVN, highlighted by the following observations:
Bullish Trend: AVN is in a confirmed bullish trend.
Sideways Movement: Currently in a sideways consolidation phase.
Bearish Divergence: Previously present but now dissolved.
Support Line: The price is at a horizontal support line.
RSI: Supporting a bullish flag pattern, indicating potential upward movement.
Entry Point:
Buy: At the current market price (CMP) near the horizontal support line
Target Prices (TP):
TP 1: 📈
TP 2: 📈
Longer Ride: Must surpass point D with good volumes for a rally towards 76.00
Stop Loss (SL):
SL: Below the horizontal support line to manage risk
Trade Summary:
Buy: At CMP near horizontal support line
TP 1:
TP 2:
Longer Ride: Surpass point D with good volumes for a rally at 76.00
SL: Below horizontal support line
Technical Indicators:
RSI: Supporting the bullish flag pattern
Patience: Targets will be triggered soon, stay patient
Trade Type: Long Swing 🎢
Good Luck! 🍀
Stay informed and trade smart! 📊


AVNLooking at the chart, we observe the formation of a symmetrical triangle pattern. The converging trendlines suggest a period of indecision in the market. As breakout is observed, we could see a bullish continuation with a potential target based of 68 on the triangle's height. Conversely, a downside breakout might indicate a bearish move (stop loss: 50), and traders should be cautious, considering the support level as a key point to watch."

AVN=====Bearish Trend Before Bullish Making Higher high and higher low hen came to Resistance gets Rejection of Prices Show with Divergence in RSI and Volume Now Trend is Change Making Bearish Flag Breakout of This Flag Gets more chances to Trend continue to Bearish

AVN | Flag PatternAVN is currently within a Bull Flag pattern, facing resistance around 53. Multiple barriers hinder breakout. Anticipation for bullish reversal towards 56-59 post-breakout; breach below 49 signals potential bearish momentum.

AVN (Intraday/Short Swing)AVN is in a bullish trend. 2 hourly channel tops. Consolidating to go for further targets at 63 after crossing 66 is our next target.
Sell AVN from 63-66.
Buy AVN from 59-61.
SL At 57.

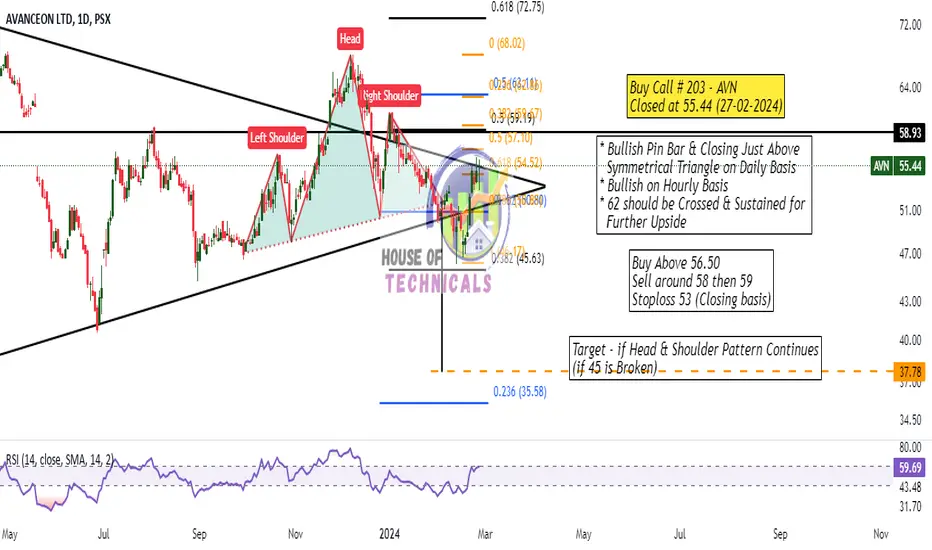
Test Case - Bullish Divergence will Play or H&S Pattern?Bullish Divergence on Daily TF
H&S Pattern yet to complete its Right Shoulder

Bullish Pin Bar* Bullish Pin Bar & Closing Just Above
Symmetrical Triangle on Daily Basis
* Bullish on Hourly Basis
* 62 should be Crossed & Sustained for
Further Upside