Mari Energies Breaks Out of TriangleMARI is displaying a strong bullish setup as price has successfully broken out of a long consolidation within a symmetrical triangle pattern, confirming strength above the key 0.5 Fibonacci retracement level at 664.95. With the breakout accompanied by higher lows and steady upward momentum, the stock is now targeting the next Fibonacci levels at 720.40 and 789.00, with a broader upside potential extending towards 899.90 and even 1,027.71. The breakout structure suggests buyers are regaining full control, while the invalidation zone remains below 609.50, keeping the risk-reward profile highly attractive for positional traders.
MARI trade ideas

MARIPSX MARI :: Day Level
📈 MARI Trading Recommendation
Current Market Price (CMP): PKR 685
💎 Bullish Bias: BUY & HOLD
✅ My clear view: MARI is a strong buy for long-& Mid term investors. Fundamentals are solid, and the recent dividend announcement strengthens the positive outlook.
💹 Long-Term Investors:
Enter at the current price for early entry and hold for very strong returns.
Support Levels for Accumulation (if price dips):
🔹 654 (immediate support; key level after breaking smaller range Jan–Sep 2025)
🔹 643
🔹 620
🔹 610
This allows accumulating MARI at discounted prices while maintaining a bullish long-Mid term view.
📊 Technical Outlook:
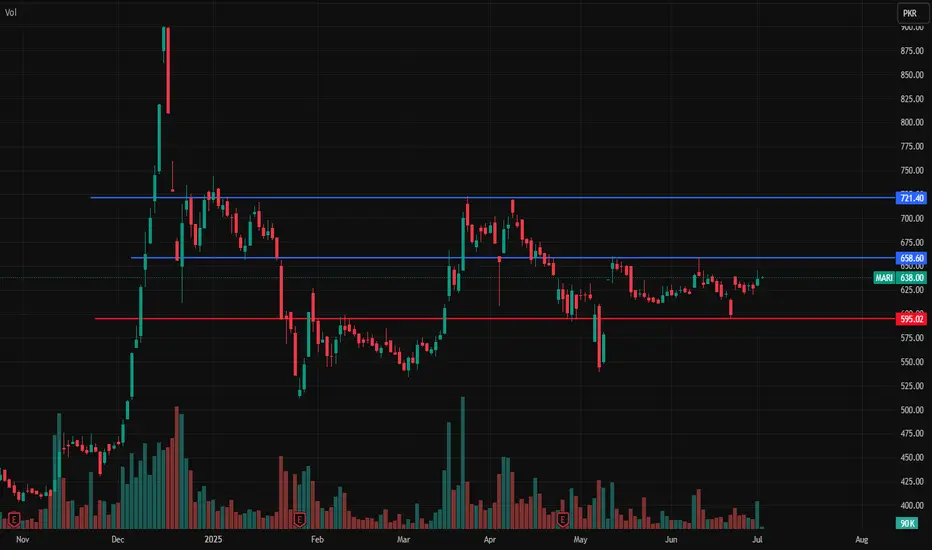
Range Bound: Since January 2024, MARI has been trading in a broader range of 590–744.
Resistance: 723–744
Support: 590–612
Smaller Positive Range: 605–654, which has been positively broken.
654 now acts as key support.
⚡ Intraday / Short-Term Traders:
Monitor daily price action carefully. Not recoomended for intraday Trading but can manag as per below:
Rule: Do not hold if the price closes below 654 with a bearish candle on the daily chart.
A break below may lead to pullbacks toward 643–610.
Target TP1: 723 TP2: 744
Pattern: Formation of a bullish flag indicating potential upward movement.
✅ Summary:
Long-Mid term: Buy & hold 💎
Short-term: Watch 654 closely ⚡
Market sentiment favors upward movement, making MARI attractive for both accumulation and swing trading.

MARI PROBABLY IN WAVE '' C '' OR " 5 " - LONGThis is in continuation to our ongoing tracking of MARI.
Our preferred wave count suggests that we are in a wave C of an ABC correction which will target, level of 710 - 720 and then 740 - 750. Alternately price can take resistance from the
green trend line, in which case price might reverse from 680-690 level towards 580 - 590 level.
There's also a possibility that the 5th wave has started which will take prices above 900+ but we hardly doubt it. Price movement and volume will confirm either this is a C or 5 wave.
Posting this with delay as I was unable to post this during trading hours, price might dip back toward 630 - 640 level giving another buying opportunity.
Trade setup:
Entry price: 661 (we are already active in this trade)
Stop loss: We are not marking any stop loss because MARI has very strong fundamentals and we are bullish for the long term in it.
Targets:
T1: 710 - 720
T2: 740 - 750
T3: 900 +
Let see how this plays, Good Luck!
Disclaimer: The information presented in this wave analysis is intended solely for educational and informational purposes. It does not constitute financial or trading advice, nor should it be interpreted as a recommendation to buy or sell any securities.

MARI – TECHNICAL BUY CALL | 16 SEPT 2025 (1H TIME FRAME) MARI – TECHNICAL BUY CALL | 16 SEPT 2025 (1H TIME FRAME)
The stock broke out of a trading range and after a pullback, is now ready to move upward with a bullish structure.

#MARI ENERGIES LTD (PSX) – LONG-TERM BREAKOUT ANALYSIS & TARGETSTechnical Overview
Mari Energies has officially broken out of its second consolidation box after 18 weeks (≈5 months) of range-bound movement, forming a bullish harmonic AB=CD pattern on the weekly timeframe.
✅ Breakout Confirmation: The stock has once again repeated its historical behavior—breaking out of consolidation, followed by a strong impulsive leg, similar to the previous 4-month base.
🟩 Short-Term Target: PKR 900, aligning with the previous all-time high.
🟩 Mid-to-Long-Term Targets (2026–2027): PKR 1225 to 1234, in line with the AB=CD extension.
🔻 Stop Loss: PKR 533, below the consolidation base for risk management.
🔍 Fundamental Snapshot (as of 2025)
Metric Value
EPS (Trailing 12M) ~PKR 272.25
P/E Ratio ~2.5× (extremely undervalued relative to sector)
Market Cap Over PKR 800 billion
Dividend Yield ~13% (exceptionally strong)
Revenue Growth (YoY) Consistent double-digit growth
Net Profit Margin Over 40%, indicating strong operational efficiency
Debt-to-Equity Low – strong balance sheet
Strategic Assets Operates Pakistan’s largest onshore gas field – Ghotki Block
Stability Low beta, defensive utility stock, strong dividend payer
Mari remains fundamentally one of the most stable and cash-rich companies on PSX, with strategic importance in the energy sector. Its earnings consistency and dividend payouts offer strong downside protection.
🔮 Outlook for 2026–2027
If macroeconomic and energy market stability continues, Mari is well-positioned for compound gains in both price and dividends.
Price Forecasts:
🎯 2026 Target: ~PKR 900+ (short-term pattern completion)
🎯 2027 Target: ~PKR 1230+, subject to sustained volume and earnings support
With its low P/E, high yield, and technical breakout, Mari could re-rate significantly if broader market sentiment improves.
📌 TL;DR – Mari Energies Weekly Trade Plan (2025)
Parameter Value
Pattern Harmonic AB=CD
Buy Zone Current price (~PKR 681–700)
Stop Loss PKR 533
TP1 PKR 900
TP2 PKR 1234
Time Frame Long-Term (Weekly/Monthly)
📎 Has broken consolidation after 18 weeks — mirroring prior breakout setup. As long as it holds above 533, structure remains bullish.

MARI ShortSince July 2023, Mari has never breached and closed below SMA10 on monthly timeframe.
If it breaches it and closes below 588, the downfall will be sharp.
Its first stop would be 519 and then 446 and 415 can also be on cards.
Sorry for Mari lovers but it can become a harsh reality.
However, 415 to 446 can be an ideal time for accumulation for long term investment purpose.
its not a buy / sell call, just my personal opinion.

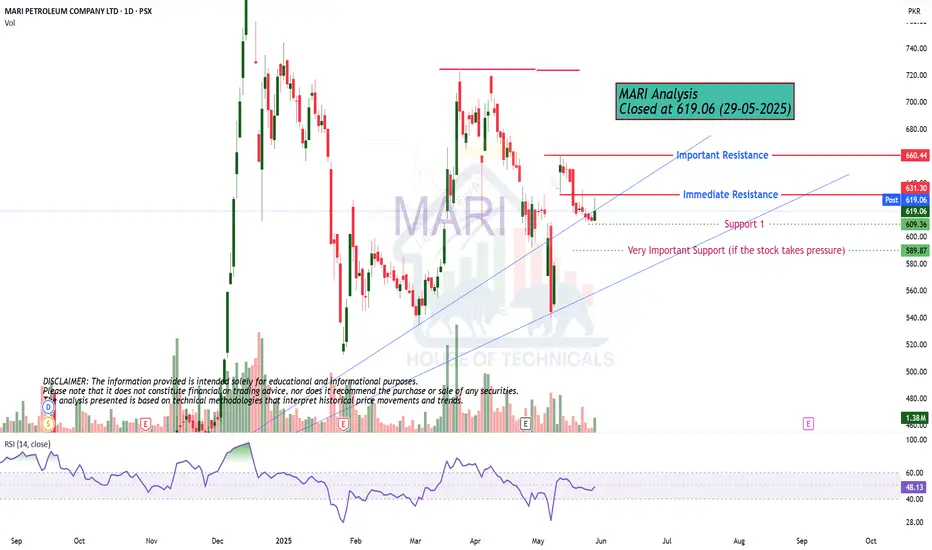
Near Breakout!MARI Analysis
CMP 671.65 (09-09-2025 01:17PM)
Near Breakout!
Weekly Closing above 665 - 667 would
be a positive sign.
It has the potential to touch 800 & then 900+
On the flip side, Immediate Support lies around 665 - 672
& then around 630 - 640.
If it breaks 625 this time, more selling pressure will be observed.

MARI - S&R - DOW THEORYMARI - S&R -Dow Theory
charts drawn for the TAAP course to learn Dow Theory and S&R for daily, weekly and monthly periods


Mari* Stock broke out of a **falling channel** → bullish sign.
* **Immediate support:** 620 PKR, stronger support near 600 PKR.
* **Next resistance / target:** 710–715 PKR.
* **RSI \~57** → bullish momentum building.
👉 Overall bias: **Bullish towards 710 PKR if above 620 PKR**.

MARI – TECHNICAL BUY CALL | 24 AUG 2025 (5-MIN TF) MARI – TECHNICAL BUY CALL | 24 AUG 2025 (5-MIN TF)
The stock accumulated in a trading zone (marked with a yellow channel), broke out to Rs. 675, pulled back to Rs. 624, and now looks ready to resume its upward move.


MARI – TECHNICAL BUY CALL (11 AUGUST 2025– 2nd Strike) | MARI – TECHNICAL BUY CALL (New Targets Unlocked – 2nd Strike) | 11 AUGUST 2025
The stock previously made a high of Rs. 900 in a powerful spike fashion and then went into a complex pullback. This pullback has now taken the shape of a wedge (light purple), and inside this wedge, the stock has formed a springboard trading range (light blue). We expect the stock to continue moving upwards.

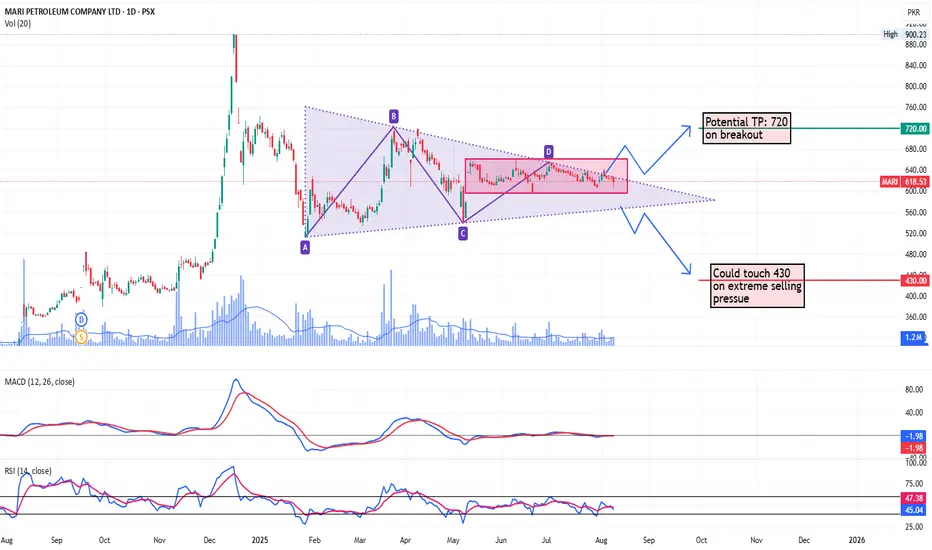
PSX: MARI Energies Daily timeframeMARI energies moving in a triangle
Potential TP in case of a breakout
Major support area in case of extreme selling
Mari Key levelsMari is in bullish trend and buying is possible with blue lines TP and red line SL
Note: This is not a buy/sell trade call.
MARI Trade Idea1- Price is in uptrend and HH/HL are intact.
2- Price is stalling within golden pocket zone.
3- Price squeezing in between wedge pattern.
4- RSI on weekly @ 52 and monthly @ 66 which
is showing that bullish momentum is intact.
5- We need to wait for bullish candlestick pattern
within GP or breakout of the wedge pattern.
.

MARI Petroleum Company Ltd (PSX) Buy Idea✅ Buy Idea Summary
Symbol: MARI
Timeframe: Daily
Current Price: 652.96
📊 Analysis & Plan
Context:
Price has bounced from a higher-timeframe demand zone (highlighted in blue) and is currently forming a bullish structure.
Key Observations:
Swing Failure Pattern near top (distribution clue).
Liquidity Pool marked at 720 — likely target for short-term buy-side liquidity.
Strong bullish reaction after price tapped near the low of the previous range.
🛒 Entry:
At/around: 652.96 (Post price).
🎯 Target Levels:
TP1 (Partial/Intraday): 720 (Liquidity Zone)
TP2 (Major Target): 829.88
TP Final: 900.23
🛑 Stop Loss:
Below 539.13 (last swing low and structural invalidation)
📥 Reinforcement Buy Zone:
Blue Demand Area (around 460–500):
“If I got here, I will look to buy more.”
→ A key reaccumulation area if price revisits.

MARI PROBABLY IN WAVE '' C '' OF CORRECTION - SHORTThis is in continuation to our ongoing tracking of MARI.
MARI is most probably in wave C of an ABC correction and since prices moved down giving confidence to our bearish wave count, we are taking a small position by short selling.
Due to market volatility we will trade this setup with cautious using trailing stop loss until we reach our target. We only recommend small positions at the beginning and once prices starts to unfold in our favor we will add more to our positions on bounce backs
Alternately prices can move up toward 650-660 level which is highly unlikely now but not out of question
If our wave count is correct then we can make around 8.50% or 15.50% on this trade.
Trade setup:
Entry price: 604
Stop loss: 632
Targets:
T1: 535-550
T2: 515-500
Let see how this plays, Good Luck!
Disclaimer: The information presented in this wave analysis is intended solely for educational and informational purposes. It does not constitute financial or trading advice, nor should it be interpreted as a recommendation to buy or sell any securities.

Mari Swing trading targetsMari is entered into bullish trend and entry is possible, TP1 is 660 and TP2 is 700. SL is 593.
Note: This is not a buy/sell trade call. trade at your own will and analysis. This is for education purpose.

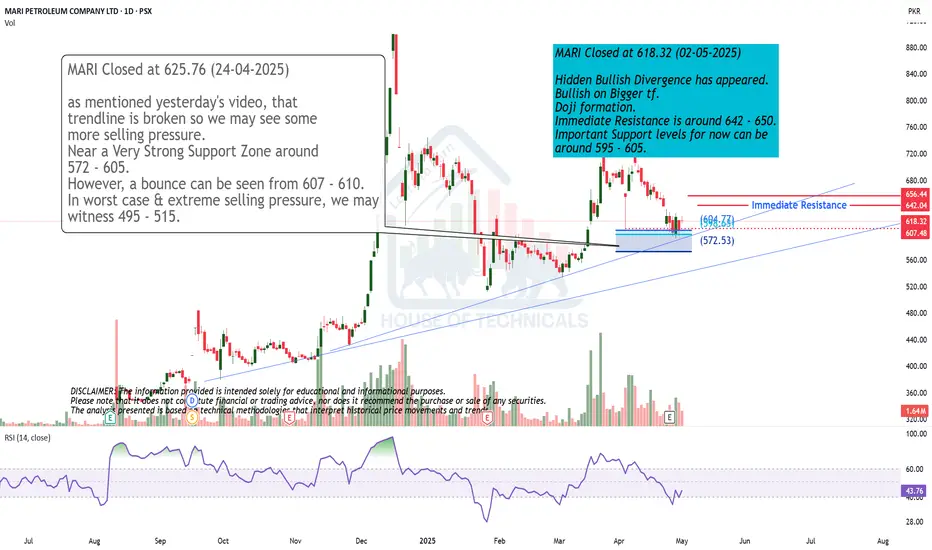
Hidden Bullish Divergence
Hidden Bullish Divergence has appeared.
Bullish on Bigger tf.
Doji formation.
Immediate Resistance is around 642 - 650.
Important Support levels for now can be
around 595 - 605.
Play on levelsas mentioned yesterday's video, that
trendline is broken so we may see some
more selling pressure.
Near a Very Strong Support Zone around
572 - 605.
However, a bounce can be seen from 607 - 610.
In worst case & extreme selling pressure, we may
witness 495 - 515.
