TRG Pakistan Limited - Technical Analysis ReportDate: November 04, 2025
Current Price: PKR 83.05
Change: +2.24 (+2.77%)
Volume: 9.78M
Executive Summary
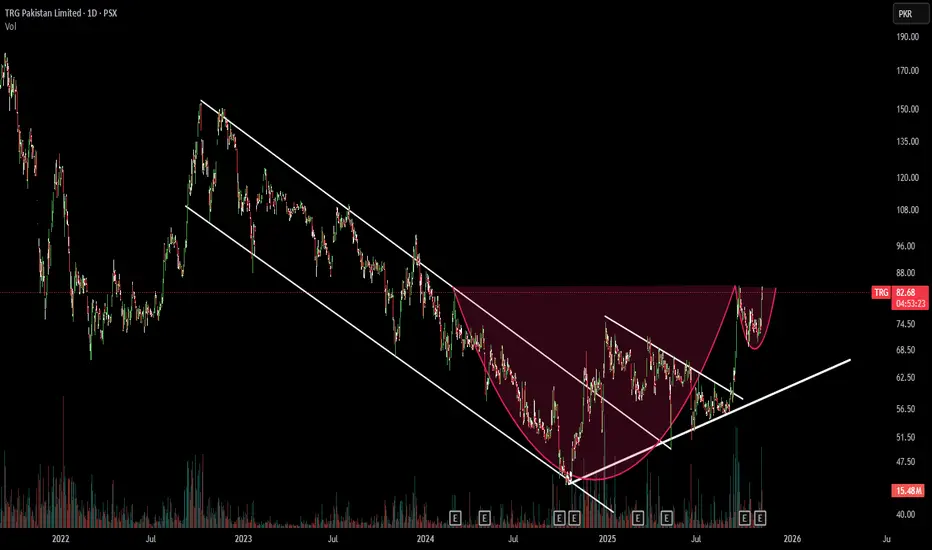
TRG Pakistan Limited exhibits a highly bullish technical setup with multiple confirming patterns signaling a potential major reversal. The stock has broken out from both a falling wedge and a cu
TRG Pakistan Limited
No trades
15.37 PKR
3.92 B PKR
1.95 M PKR
514.03 M
About TRG Pakistan Limited
Sector
CEO
Hasnain Aslam
Website
Headquarters
Karachi
Founded
2002
Identifiers
2
ISINPK0079201015
TRG Pakistan Ltd. is a holding company, which engages in investing in a portfolio of investments primarily in the technology and IT services sectors. The company was founded on December 2, 2002, and is headquartered in Karachi, Pakistan.
Related stocks
TRG Pakistan Limited – Breakout and Technical OutlookTRG Pakistan Limited (PSX: TRG) has been consolidating within a multi-year descending channel and is now approaching a critical technical juncture.
Technical Structure
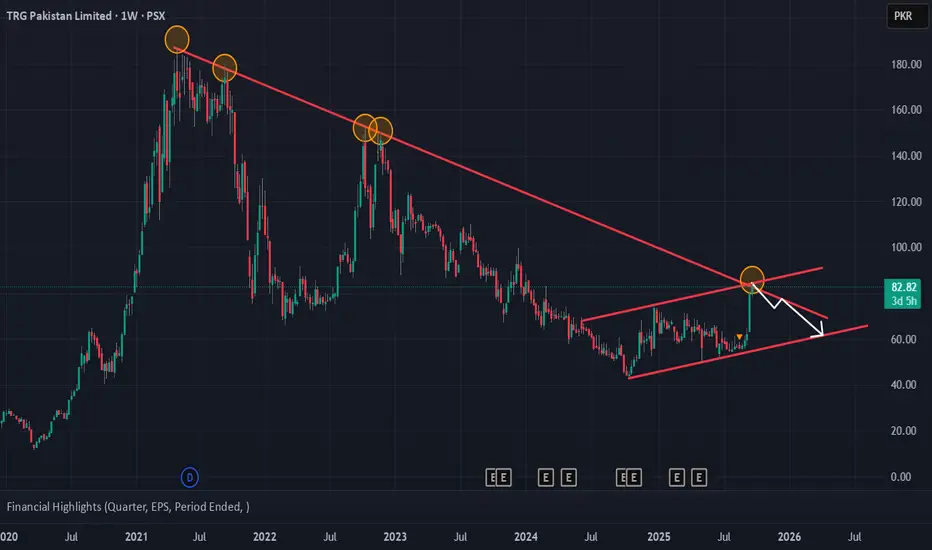
Downtrend Resistance: The stock has remained under a long-term declining trendline since early 2021, consistently making lower hig

TRG – BUY TRADE | 1W | 11 OCT 2025 | TCATRG – TECH BUY CALL | 1W | 11 OCT 2025 | By The Chart Alchemist
After a strong bearish trend from Rs. 153 to Rs. 43.9, the stock broke out of a bearish channel (marked light pink) and consolidated within a trading range, forming a Wyckoff accumulation structure. The stock has now broken out of this

TRG Pakistan – Key Resistance at 83 | Possible Pullback AheadTRG is testing a major long-term downtrend line around 83 PKR, which aligns with the upper boundary of its short-term rising channel. This confluence has historically acted as strong resistance.
🚩 Resistance Zone: 82–85 PKR
📉 Possible Pullback Targets: 75 → 62 PKR
✅ Bullish Scenario: A clean brea
TRG From 58 -- 75 in no time (+29%) after our call TRG From 58 -- 75in no time (+29%) after our call — breakout delivering strong gains
TRG ELITE KATCHRA💎
CMP: 58.76
From forgotten junk to potential multi-bagger 2x... 3X...4X...? will see what unfolds...
TRG is showing signs of a potential long-term reversal after a multi-year downtrend. Price

TRG – Bear Flag at Critical SupportTRG is currently testing a major trendline support. The chart is showing a bear flag formation — if the price fails to hold this zone, more downside pressure could follow.
📉 Pattern: Bear Flag
📌 Critical Support: ~57 PKR trendline
⚠️ Breakdown Risk: If broken, potential drop toward 10.90 PKR
🛡️

TRG – SHORT SELL / EXIT SIGNAL (FLIP TRADE) | 20 JULY 2025TRG – SHORT SELL / EXIT SIGNAL (FLIP TRADE) | 20 JULY 2025
TRG has maintained a bearish market structure, consistently printing lower highs and lower lows—confirming an established downtrend. After a short-term retracement to the 20 EMA, the stock has resumed its downward movement, suggesting that f

TRG FALLING WEDGE 2x... 3X...4X...?TRG ELITE KATCHRA💎
CMP: 58.76
From forgotten junk to potential multi-bagger 2x... 3X...4X...? will see what unfolds...
TRG is showing signs of a potential long-term reversal after a multi-year downtrend. Price action is compressing within a large falling wedge pattern, typically a bullish format

TRG LongTRG has made a perfect bullish harmonic pattern where it has retraced to exact 127.2% of its last top and now will move till 161.8% of its all-time high which is nearly 295. This is not a buy/sell call, its just my own analysis and you may disagree. However, I'd urge you to study bullish and bearish

TRG LONG TRADETRG was in BULL RUN since March 2020 to April 21, it is trending in bullish channel since 2020, it has now bottomed out in this channel as seen in 1W chart at bottom.
As seen in 1D chart it has given bullish reversal on heavy volumes on upward leg and much lighter volume on downward pullback, furth

See all ideas
Summarizing what the indicators are suggesting.
Oscillators
Neutral
SellBuy
Strong sellStrong buy
Strong sellSellNeutralBuyStrong buy
Oscillators
Neutral
SellBuy
Strong sellStrong buy
Strong sellSellNeutralBuyStrong buy
Summary
Neutral
SellBuy
Strong sellStrong buy
Strong sellSellNeutralBuyStrong buy
Summary
Neutral
SellBuy
Strong sellStrong buy
Strong sellSellNeutralBuyStrong buy
Summary
Neutral
SellBuy
Strong sellStrong buy
Strong sellSellNeutralBuyStrong buy
Moving Averages
Neutral
SellBuy
Strong sellStrong buy
Strong sellSellNeutralBuyStrong buy
Moving Averages
Neutral
SellBuy
Strong sellStrong buy
Strong sellSellNeutralBuyStrong buy
Displays a symbol's price movements over previous years to identify recurring trends.
Frequently Asked Questions
The current price of TRG is 71.50 PKR — it has increased by 1.00% in the past 24 hours. Watch TRG Pakistan Limited stock price performance more closely on the chart.
Depending on the exchange, the stock ticker may vary. For instance, on PSX exchange TRG Pakistan Limited stocks are traded under the ticker TRG.
TRG stock has fallen by −1.74% compared to the previous week, the month change is a 1.37% rise, over the last year TRG Pakistan Limited has showed a 10.87% increase.
TRG stock is 1.42% volatile and has beta coefficient of 0.98. Track TRG Pakistan Limited stock price on the chart and check out the list of the most volatile stocks — is TRG Pakistan Limited there?
Today TRG Pakistan Limited has the market capitalization of 38.73 B, it has decreased by −0.78% over the last week.
Yes, you can track TRG Pakistan Limited financials in yearly and quarterly reports right on TradingView.
TRG net income for the last quarter is 6.87 B PKR, while the quarter before that showed −90.67 M PKR of net income which accounts for 7.67 K% change. Track more TRG Pakistan Limited financial stats to get the full picture.
As of Dec 24, 2025, the company has 6 employees. See our rating of the largest employees — is TRG Pakistan Limited on this list?
EBITDA measures a company's operating performance, its growth signifies an improvement in the efficiency of a company. TRG Pakistan Limited EBITDA is −600.10 M PKR, and current EBITDA margin is −27.94 K%. See more stats in TRG Pakistan Limited financial statements.
Like other stocks, TRG shares are traded on stock exchanges, e.g. Nasdaq, Nyse, Euronext, and the easiest way to buy them is through an online stock broker. To do this, you need to open an account and follow a broker's procedures, then start trading. You can trade TRG Pakistan Limited stock right from TradingView charts — choose your broker and connect to your account.
Investing in stocks requires a comprehensive research: you should carefully study all the available data, e.g. company's financials, related news, and its technical analysis. So TRG Pakistan Limited technincal analysis shows the sell today, and its 1 week rating is buy. Since market conditions are prone to changes, it's worth looking a bit further into the future — according to the 1 month rating TRG Pakistan Limited stock shows the buy signal. See more of TRG Pakistan Limited technicals for a more comprehensive analysis.
If you're still not sure, try looking for inspiration in our curated watchlists.
If you're still not sure, try looking for inspiration in our curated watchlists.