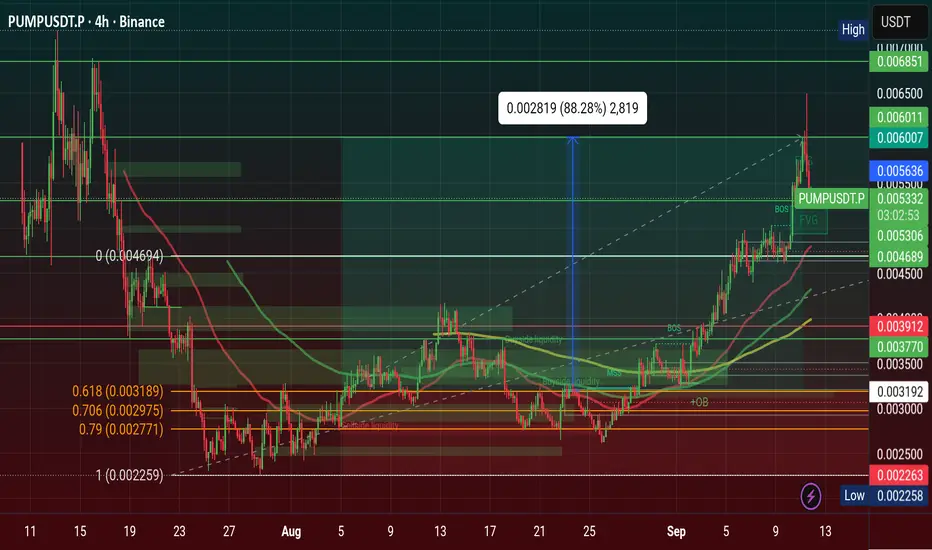
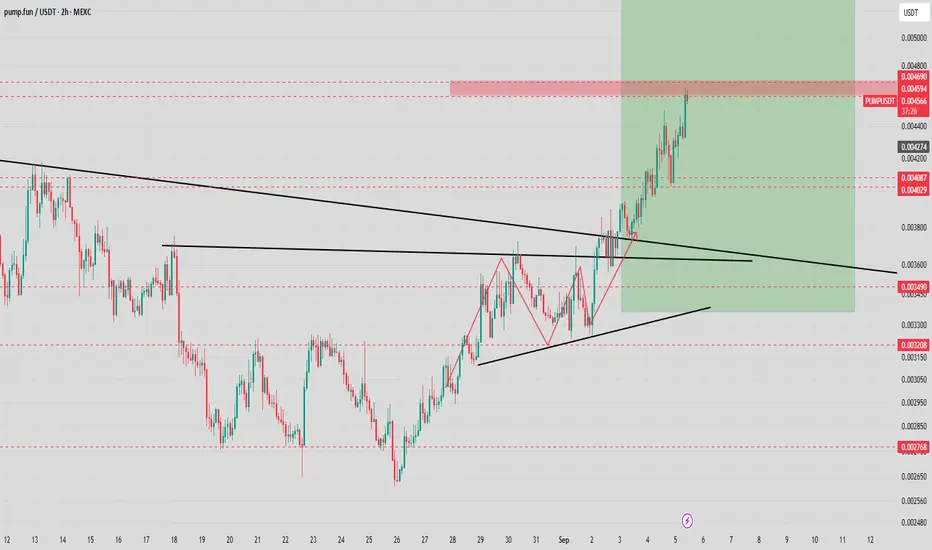
$PUMP on 4-HR: early sign of weakness at the start of WAVE 5NYSE:PUMP might be looking like it's about to continue its attack on the ATH and above but also flashing early signs of weakness here with OBV bearish divergence, which means rising distribution.
Not showing in the price action yet but that falling volume profile does have to worry. But as long as its printing HHs and HLs, no need to worry, but best to monitor the HOURLY if one's in a position.
No leverage for me either way here👽💙
PUMPFUNUSDT.P trade ideas

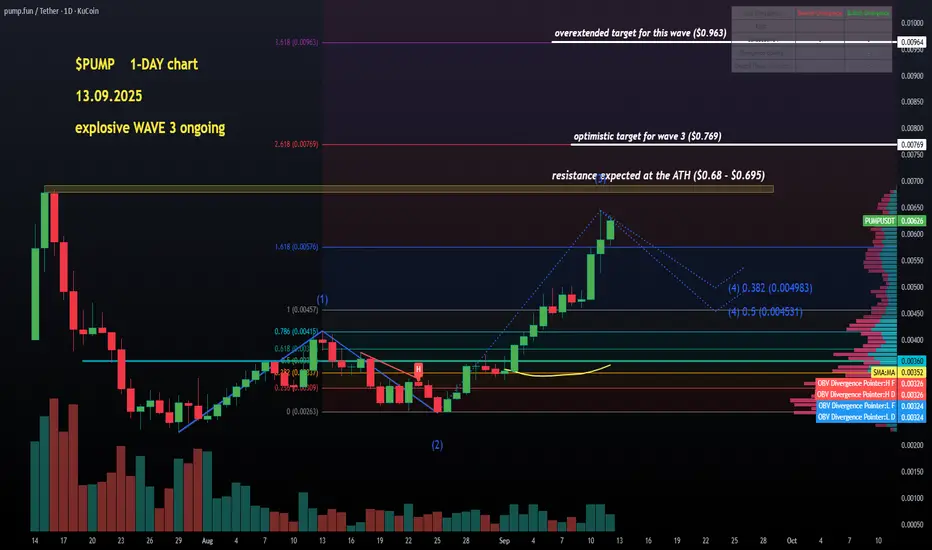
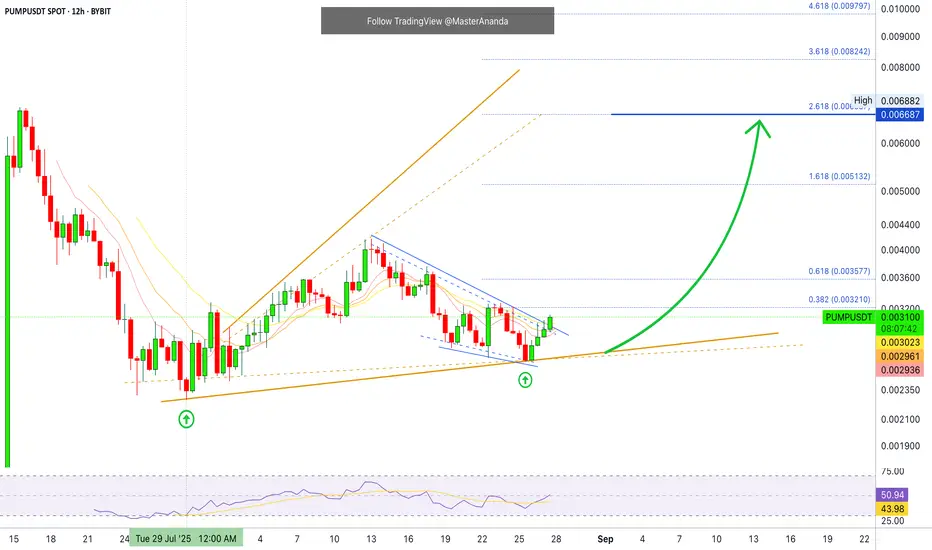
$PUMP poised to test its ATH any time soon on this WAVE 3NYSE:PUMP on 1-DAY chart is looking so strong but this wave 3 could be ending soon quite possibly after finishing with a rally to either the ATH or higher towards the Fib extensions at $0.769 (fib 2.618) or $0.963 (fib 3.618)...
RSI at 77 so still some room to keep growing before a correction.💙👽
Needs to bo monitored on lower timeframes for signals of weakness, next posts on my wall☝️
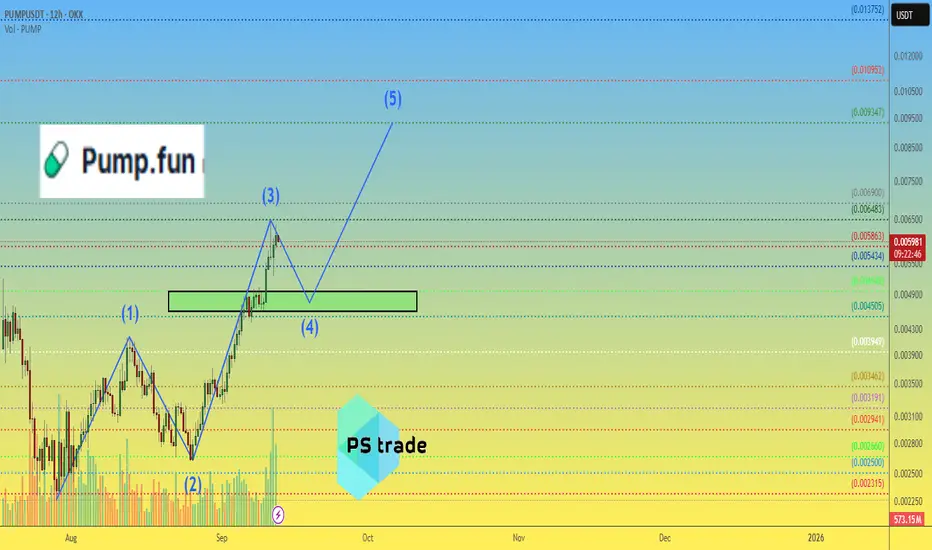
PUMP price— Correction or another rally?If bulls manage to keep OKX:PUMPUSDT price above the $0.0046–0.00495 support range, there’s room for another x2 #PumpFun move.
Such a rally would lift market capitalization above $3 billion.
⚠️ However, the 5th Elliott wave is notoriously unpredictable and could drive price impulsively higher.
❓ Which target do you see for #PUMP? $0.01? $0.02? Or even more? Comment below.
______________
◆ Follow us ❤️ for daily crypto insights & updates!
🚀 Don’t miss out on important market moves
🧠 DYOR | This is not financial advice, just thinking out loud.
$PUMP Surprised Today $0.0064 and Finally hit $0.006, My PredictPump Price is Consolidation Now, i guess If the Prce is Breakout at ATH with Retest than My Prediction will hit $0.011-$0.022 in 2026. Pump.fun Price Jumps 42% in a Week, Bulls Eye $0.0069 Resistance
Pump.fun has been one of the most talked-about tokens this week, and for good reason. The memecoin launchpad is not only helping new tokens gain traction but also making a strong case for its own native token, PUMP.
At press time, PUMP is changing hands at $0.005814, with a daily premium of 10.52%, and an impressive 42.34% weekly jump. With a market cap of $2.06 billion and intraday trading volume soaring 89% to $500.47 million, momentum around the project is building fast.
Onchain Metrics PUMP Coin
Revenue is one of the signals of Pump.fun's current strength. According to DeFiLlama, Pump.fun generated $2.57 million in the last 24 hours, placing it right behind Hyperliquid among the top protocols. This revenue primarily comes from trading and token launch fees, which the platform keeps at a rather slim 0.05%, making it attractive for new projects.
What's pushing adoption further is the growing ecosystem impact. On September 8, MEXC listed TBCN, a Solana-based memecoin born out of Pump.fun's platform. This listing came shortly after Pump.fun launched the Glass Full Foundation in August, a liquidity injection initiative designed to support fresh projects.
These moves highlight the platform's growing role as a memecoin incubator. On the tokenomics side, Pump.fun has aggressively reduced supply through buybacks. Since July, the protocol has bought back over $30.65 million worth of PUMP, including $705,000 in a single day last month. This reduced the circulating supply by 0.76%, directly easing selling pressure from early investors and fueling the latest rally.
PUMP Price Analysis 2026
Pump Price is Consolidation Now, i guess If the Prce is Breakout at ATH with Retest than My Prediction will hit $0.011-$0.022 in 2026. Pump.fun Price Jumps 42% in a Week, Bulls Eye $0.0069 Resistance.
From a technical perspective, PUMP has been showing strength. The token reclaimed the 23.6% Fibonacci retracement level at $0.005, a critical support zone that now underpins bullish sentiment. As long as the price stays above this level, the path of least resistance points higher. Immediate resistance sits at $0.006888, a level traders are eyeing for the next breakout attempt. If PUMP clears this hurdle, bulls could push toward the $0.0075 zone, setting the stage for a run back to its all-time high of $O.01214.
Conversely, a close below $0.005 could see PUMP retest support at $0.0045. The RSI is currently at 72, suggesting the market is flirting with overbought territory, so short-term pullbacks cannot be ruled out. Still, with buybacks, listings, and revenue momentum backing the move, dips are likely to attract fresh buyers.
#Write2Earn #BinanceSquareFamily #Binance #PUMP #SUBROOFFICIAL
Disclaimer: This article is for informational purposes only and does not constitute financial advice. Always conduct your own research before making any investment decisions. Digital asset prices are subject to high market risk and price volatility. The value of your investment may go down or up, and you may not get back the amount invested. You are solely responsible for your investment decisions and Binance is not available for any losses you may incur. Past performance is not a reliable predictor of future performance. You should only invest in products you are familiar with and where you understand the risks. You should carefully consider your investment experience, financial situation, investment objectives and risk tolerance and consult an independent financial adviser prior to making any investment.
Key Holders Fuel PUMP’s Next Leg Higher
On the daily chart, PUMP is trading above its Parabolic Stop and Reverse (SAR). The indicator’s dots remain below price, signaling that buyers continue to dominate and demand outweighs selling pressure. This suggests that the current uptrend is intact, and the rally may extend further if momentum holds.
Alongside the SAR, PUMP’s Smart Money Index (SMI) has been trending higher and recently hit a two-month peak at 1.0005. The SMI measures the difference between early retail-driven selling and later institutional-driven buying. Its current rise signals that smart money is accumulating positions, often a precursor to strong price movements.
The alignment of bullish signals from both SAR and SMI reinforces the positive sentiment around PUMP. With key holders showing support and trend indicators pointing upward, the asset appears well-positioned for further gains, provided market conditions remain favorable.

Expecting more pump to the upside Seeking a moonshot to 0.006 then 0.007 👏 look forward to seeing you soon 🥳

Pumpcoin scalp long to $0.005033Took this trade a while ago
Sl: 0.004753
tp area is at least 1:1
Monitor from there exit.

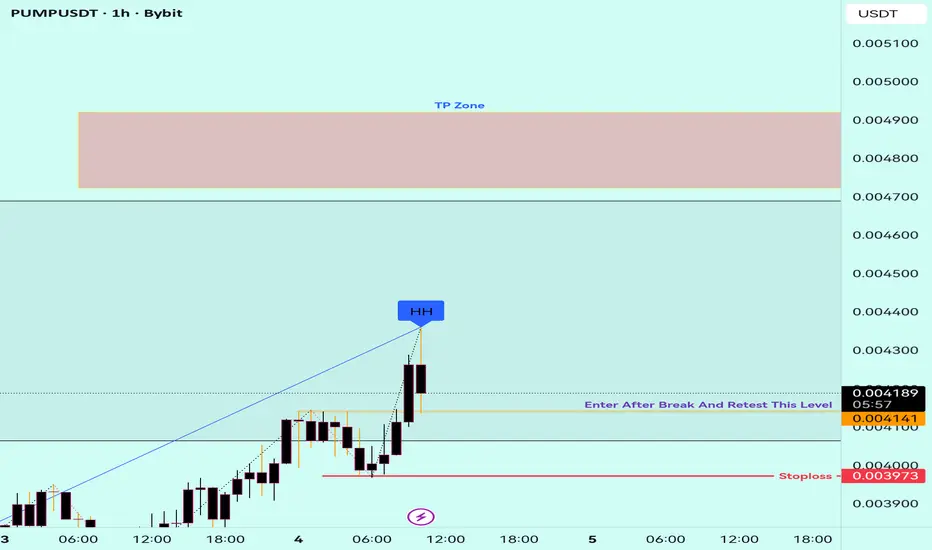
PUMPUSDT.P Trade Setup – Clean Break Above Key Resistance🎯 Trade Idea (Long Bias):
Entry: 0.00491 (after strong bullish candle closed above recent resistance)
Stop Loss: 0.00480 (below rejection wicks and minor support)
Take Profit 1: 0.00501 (historical resistance zone)
Take Profit 2: 0.00513 (upper range with selling reaction last time)
Risk-to-Reward Ratio: Approx 1:2.1 — favorable
🔍 Key Observations:
Strong Bullish Candle broke above the horizontal level at 0.00491
Volume increased at breakout, indicating buyer confidence
Clean move with no resistance until 0.00501 – price is likely to retest that area
SL is tightly placed under small consolidation and previous rejection zone
⚠️ Risk Notes:
Protect profits near 0.00501 if price slows down or rejects sharply
Avoid entry if price fails to hold above 0.00491 and closes below 0.00480
Overall market sentiment (BTC/ETH) may influence momentum

Pumpcoin long to $0.005Just now opened a long position on pumpcoin. I anticipate that the market will..pump. No pun intended
Sl: 0.004473
tp: 0.005
3.3RR

Pumpfun 4.5R Trade ideaPrice returned to nPOC from yesterday and is showing some signs of rejection.
Will let trade run 2R and move stops to BE

$PUMP Parabolic Starting & if Break ATH price hit $0.011 in 2026🚀 NYSE:PUMP Parabolic Starting & if Break ATH price hit $0.011 in 2026
IN 2026 PUMP will be happened break ATH and my Prediction $0.006 price area will be breaks after Price will stay accumulation in previous ATH areas. In 2026 price could hit $0.011 and 0.008 areas.
Pump.fun Executes $62M Token Buyback as Class-Action Lawsuit Looms
The platform generated more than $775 million in revenue since launch, according to DefiLlama, though income briefly slumped in late July, when weekly revenue fell to $1.72 million- its lowest lev el since March 2024. At its peak in May, weekly revenue topped $56 million, coinciding with a surge of Solana memecoins that briefly pushed SOL itself above $200, its highest level since late 2021.
Market Impact and User Growth
The buybacks appear to be lifting sentiment. PUMP has gained 12% in the past month and 9% in the past week, trading at $0.003522 — up 54% from an August low of $0.002282. The number of unique PUMP holders has climbed to more than 70,800, with smaller accounts holding under 10,000 tokens now making up nearly half of distribution, pointing to stronger retail participation. Blockchain explorer Solscan shows wallet activity on Pump.fun has nearly doubled since May, with daily active users averaging 48,000 compared with 25,000 earlier in the year.
#Write2Earn #PUMP #TrumpTariffs #highlight #SUBROOFFICIAL
Disclaimer: This article is for informational purposes only and does not constitute financial advice. Always conduct your own research before making any investment decisions. Digital asset prices are subject to high market risk and price volatility. The value of your investment may go down or up, and you may not get back the amount invested. You are solely responsible for your investment decisions and Binance is not available for any losses you may incur. Past performance is not a reliable predictor of future performance.
We are up 40% on $PUMP - let's go! 1 week later.... 🔥
+40% up on NYSE:PUMP , setup given on a silver platter!
Congrats if you followed team!
PUMP Holds Above Key EMAOn the daily chart, PUMP continues to trade well above its 20-day exponential moving average (EMA), reflecting sustained short-term strength in the market.
Currently, the 20-day EMA sits at $0.003485, acting as dynamic support for the token. This indicator gives more weight to recent prices, making it a reliable gauge of momentum.
Trading above the 20-day EMA suggests buyers remain in control, reinforcing short-term bullish momentum and keeping the market outlook favorable for now.

PUMP | Technical Outlook with Market Context📖 Description:
PUMP has recently gained traction in the crypto community as a high-volatility token that attracts both speculative interest and short-term trading opportunities. While its fundamentals are still developing compared to established projects, the token’s growing visibility and liquidity are key drivers behind its price action.
From a technical perspective, the current chart setup highlights strong momentum with notable volume spikes and clear reaction zones around recent support and resistance levels. Traders are closely watching these areas for potential breakouts or pullbacks, as market sentiment remains highly reactive.
⚠️ Disclaimer: This content is for educational and informational purposes only. It does not constitute financial advice. Always conduct your own research and risk management before making any investment or trading decision.
\#PUMP #CryptoAnalysis #CryptoTrading #Altcoins #TechnicalAnalysis #TradingView #CryptoMarket #PriceAction #MomentumTrading #BreakoutTrading #RiskManagement
PUMP - Price discovery mode soon? As expected NYSE:PUMP , is gonna fly hard soon! 🚀
✅ Bullish breakout confirmed on my lines
🔥 Liquidity inflow, plus weekly token burn & buy back coming in hot!
💸 TP4 already hit for us, congrats if you jumped in around the $0.0320–$0.0330 retest area I highlighted!
🎯Upper key resistance zone: 0.0450 - 0.0470$
Momentum looks set to continue.
Who’s still holding with me? 📈

Pumpcoin long to $0.004175 todayJust opened a long position on pumpcoin. Aiming for $0.004175 tp area
potential early closure at $0.004008
sl: 0.003643

PUMPUSDT TRADE SETUPPUMPUSDT | 1H Bullish Setup
📌 Key Structure: Market Shift (MSS) confirmed, price rejected higher.
🟦 POI Zone: Fresh Order Block + FVG marked below (support area).
🔑 SSL: Sell-side liquidity sits under POI, waiting to be swept.
📊 Outlook: Watching for retracement into POI to confirm bullish continuation. Setup still in development.

Pumpcoin short to $0.003250Recently opened a short on pumpcoin. Aiming for a retest of $0.003250 area
Sl: 0.003445 area

PUMP | #4h #long — Watching for Breakout Confirmation Early signals for a reversal, but not rushing in.
Some clear bullish divergence on the 4h RSI — first positive sign after an extended downtrend. Price can pop from here, but my plan is to wait for a break and hold above the 4h Order Block + MSS zone (red box) before taking any long entry.
Confirmation is key — I only want to get involved if we reclaim this area with momentum.
Scenario:
If we get a strong breakout and close above the red OB + MSS zone, that’s the first entry trigger for a potential trend reversal.
Until then — standing aside, letting the setup prove itself.
Reasoning:
Bullish RSI divergence often marks the beginning of a reversal, but without a structural breakout, the move can easily fail.
Patience pays off in these high-risk, low-liquidity coins.


PUMP/USDT – Retest Trendline: Bullish or Bearish Continuation?🔎 Market Structure & Pattern
PUMP/USDT is showing signs of momentum shift after being trapped in a prolonged downtrend. The major descending trendline (yellow) — which has consistently acted as a dynamic resistance — has finally been broken to the upside.
This signals the potential transition from a distribution/sideways phase into an accumulation → expansion phase.
The 0.0030 – 0.0032 zone (yellow box) is now a key support area. Previously it acted as a strong resistance, but after the breakout, the zone is being retested (role reversal). How the price reacts here will determine the next major move.
---
📈 Bullish Scenario
Condition: Price holds above 0.0030–0.0032 after the breakout.
Additional confirmation: Strong 6H/Daily close above the trendline with rising volume.
Upside targets:
R1: 0.003692
R2: 0.004108
R3: 0.004459
R4: 0.005521
R5: 0.006779 – 0.006891 (previous high)
If these levels are cleared one by one, the structure will officially shift into higher highs & higher lows, confirming a trend reversal.
---
📉 Bearish Scenario
Condition: Price fails to hold above 0.0030–0.0032 and closes back below the support zone.
Additional confirmation: Strong bearish rejection at R1–R2 with patterns like bearish engulfing or shooting star.
Downside targets:
First support: 0.0028
Key structural low: 0.002254
If this happens, the current breakout will be considered a false breakout, and the long-term downtrend may continue.
---
⚖️ Conclusion
The market is currently at a critical juncture.
A confirmed hold above 0.0030–0.0032 could open the door for a rally towards 0.0044 → 0.0055 → 0.0067.
Failure to hold this support, however, may send the price back to 0.002254.
Risk management is essential — keep tight stop-losses below the support zone.
---
🚀 PUMP/USDT (6H) Trendline Breakout
Price has broken out of the major downtrend and is now retesting the 0.0030–0.0032 key support zone.
📈 If the zone holds → potential rally towards 0.003692 / 0.004108 / 0.004459 / 0.005521 / 0.006779.
📉 If the zone fails → watch for downside continuation to 0.002254.
🔥 The market is at a decisive point — watch price action closely.
(Not financial advice — always apply proper risk management.)
#PUMPUSDT #Crypto #Altcoins #Breakout #Trendline #TechnicalAnalysis #PriceAction #SwingTrade #CryptoTrading #RiskManagement

Pump.Fun · Futures Trade-NumbersPUMPUSDT and we are trying to catch the next bullish wave trading futures. We have some supporting signals for a bullish move. It is early but the market is moving ahead.
PUMPUSDT is trading just now above EMA8/13/21. We have a strong RSI and a higher low. The current bullish chart appeared after a major launch crash.
Pump.Fun started trading and went down strong. This is good, the market looks for support. There was a low 29-July followed by no new lows. Here I am seeing an early change of trend. We are already on the bullish trend, it will be confirmed with the coming higher high and for this the numbers are available below:
________
LONG PUMPUSDT
ENTRY: 0.002900 - 0.003150 (STOP: 0.002800)
TARGETS: 0.003577, 0.004171, 0.005132, 0.005726, 0.006687
________
These Futures Trade-Numbers should all hit fast, short-term. It is early in the move, only 24 hours green but we are ready to move ahead.
I will show you a chart which proves with 100% certainty the altcoins market bull market is on. It happens over and over, after each major low. When some projects break-up more than 100% in a single day...
Thank you for reading.
Namaste.
PUMPUSDT Showing Strong Accumulation StructurePUMPUSDT is developing a compelling base formation, suggesting a possible imminent rally. Price is currently reacting within a key accumulation zone, where early positioning remains strategic. The structure hints at underlying strength, with momentum gradually shifting in favor of bulls.
If the current support zone holds, the setup favors a multi-leg rally. Immediate targets have been mapped for short-term profit-taking, while extended projections align with the final breakout objectives.
Plan: Accumulate within the marked zone and monitor price reaction closely. A break above the immediate neckline will validate continuation toward midterm and final targets.
