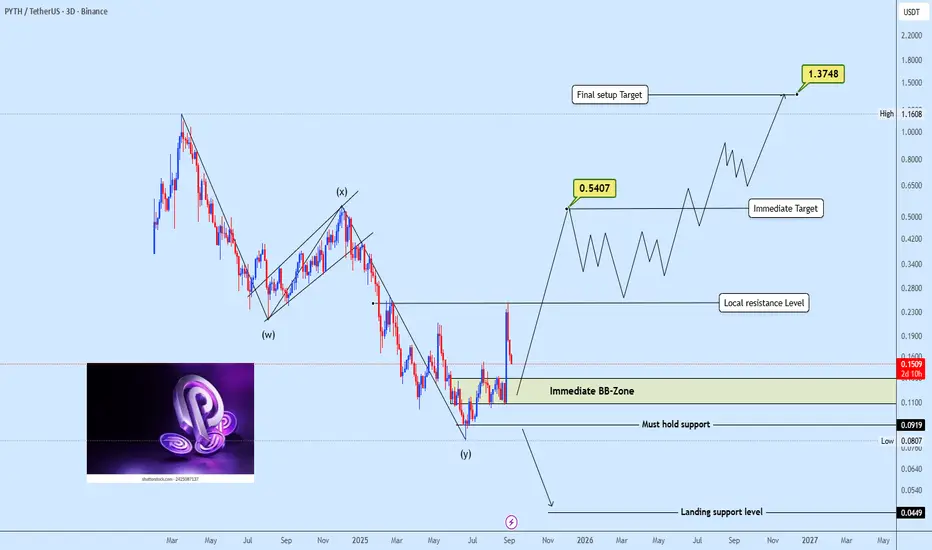
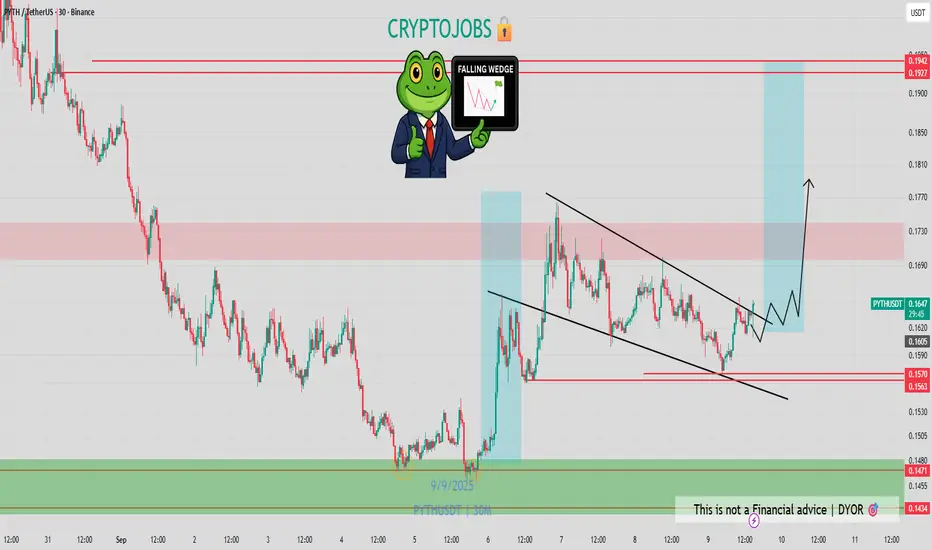
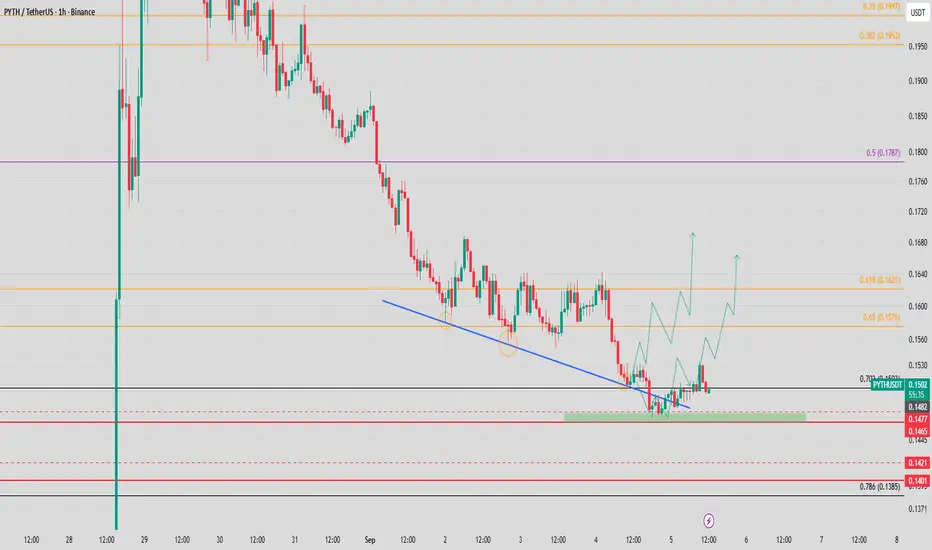
Could this be a bottom for PYTHUSDT?Pythusdt has completed its extended WXY correction, and the current rise from wave Y suggests a potential bottom formation.
Accumulate within the immediate BB-zone, then Watch local resistance closely a breakout could trigger a strong bullish move toward higher targets and If the BB-zone fails, pri
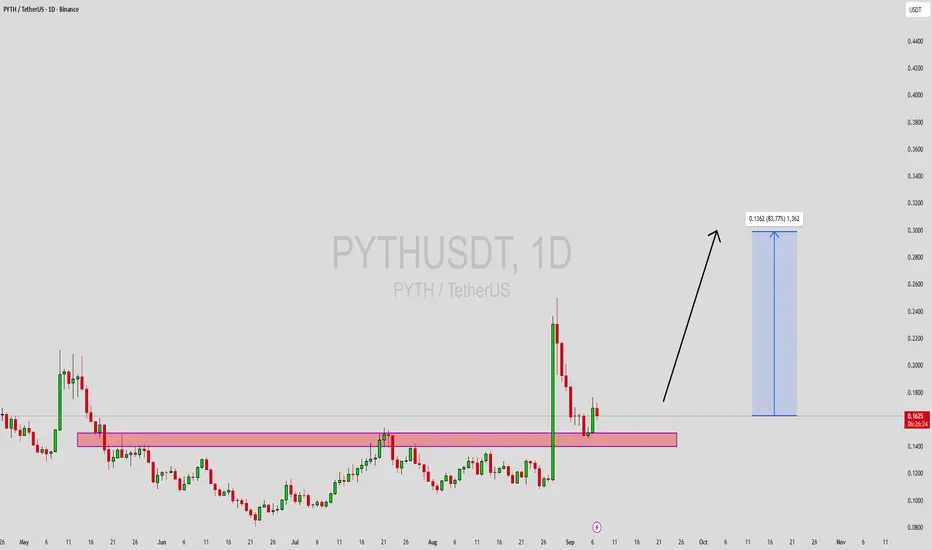
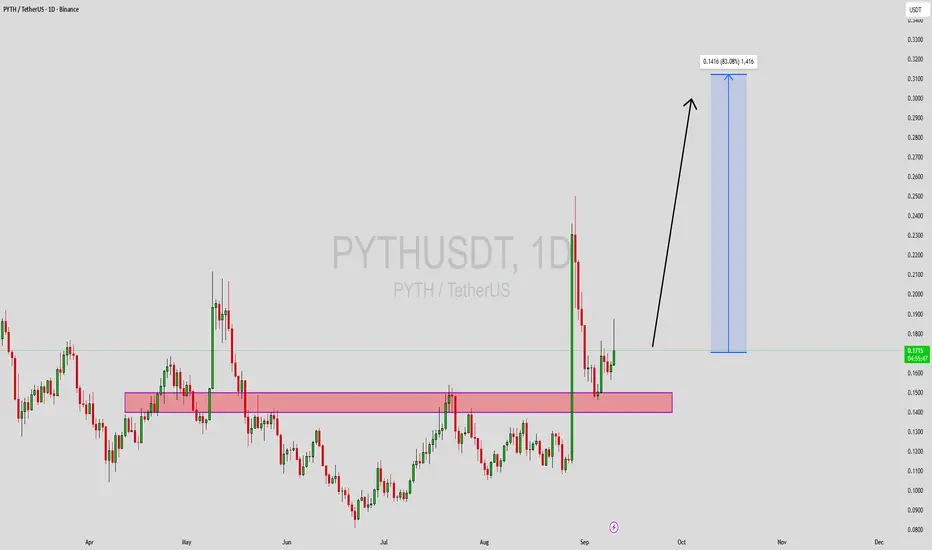
PYTHUSDT Forming Bullish WavePYTHUSDT is showing a strong bullish wave pattern, signaling the potential for a major upward rally. The recent price action suggests that the market is preparing for a breakout, with higher highs and higher lows forming a strong bullish structure. With expectations of a 70% to 80%+ gain, this setup
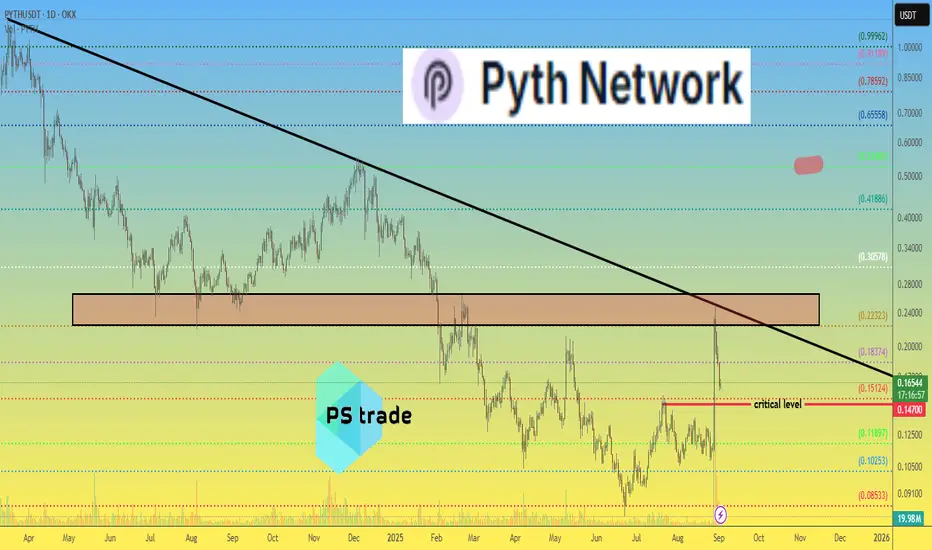
PythNetwork PYTH price analysis🔥 Recently, #PYTH delivered a real X2 show!
But if you’re expecting an immediate continuation of the rally — probably not ❌
📌 Why:
1️⃣ OKX:PYTHUSDT has entered a strong liquidity zone at $0.225–0.265.
2️⃣ #PYTHUSD hit the descending trendline, stretching back from last year.
Now the key is to h
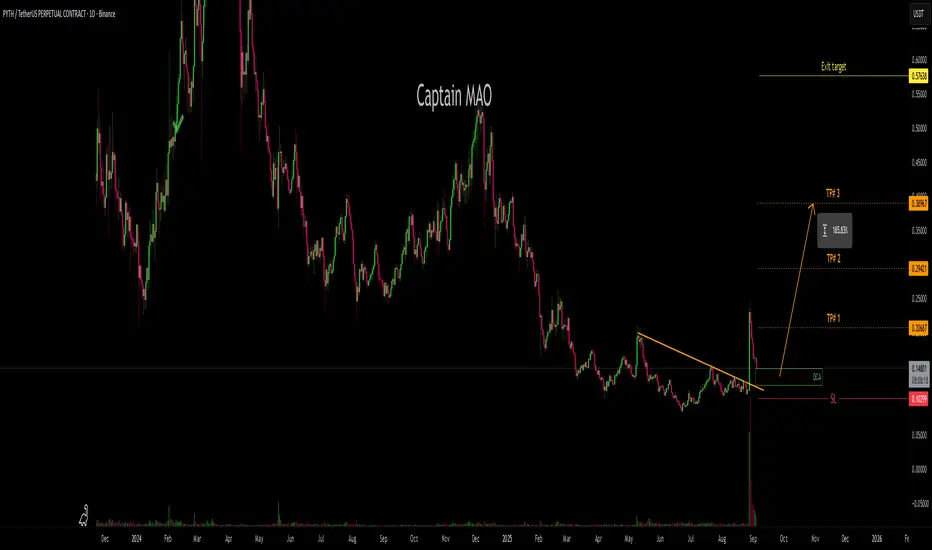
PYTH/USDT +300%Recently delivered a powerful breakout fueled by strong buyers, confirming bullish momentum. Following that move, price has now entered a healthy ~40% correction phase, offering a chance to reset before the next leg higher.
This correction presents an excellent opportunity to accumulate and DCA wit
PYTHUSDT Forming Bullish WavePYTHUSDT is showing a strong technical recovery after successfully retesting a key support zone. The price action indicates growing buying pressure as the coin establishes a solid base for the next bullish move. With good trading volume backing the recent surge, market sentiment is leaning positive,
Pyth is gonna fileld the gap! As mentionned yesterday, it was the bottom on #PYTH 🔥
After the 40% correction downard, this may be a key bottom before to see a new high. The gape is probably gonna be filled soon! News and FA are too bullish 📈
0.1760 - 0.1800$: next big level to be tested 🎯
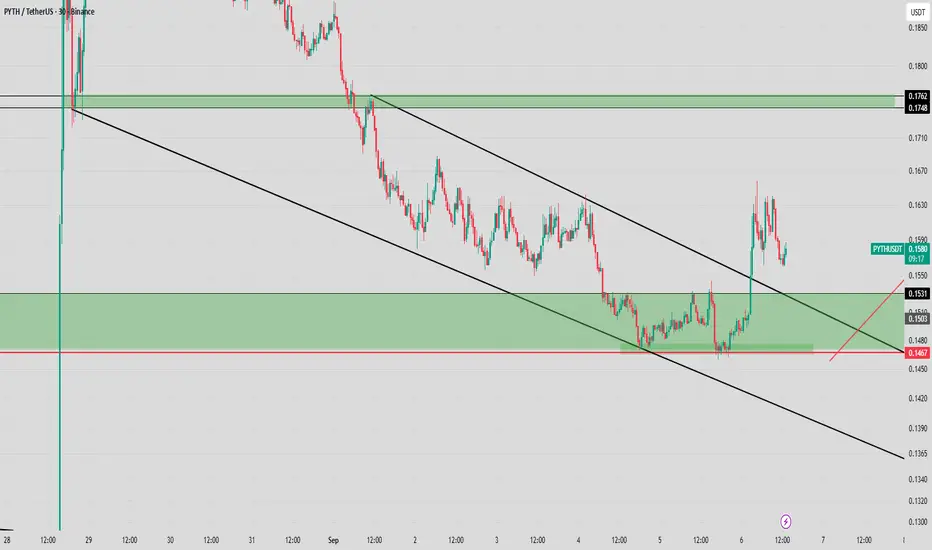
PYTH - bullish reaction awaited above 0.1450$ Will EURONEXT:PYTH pump back from this key level I mentionned?
1st entry was bad, but I think it's a good area for bulls here!
Key demand zone 0.1470 - 0.1450$
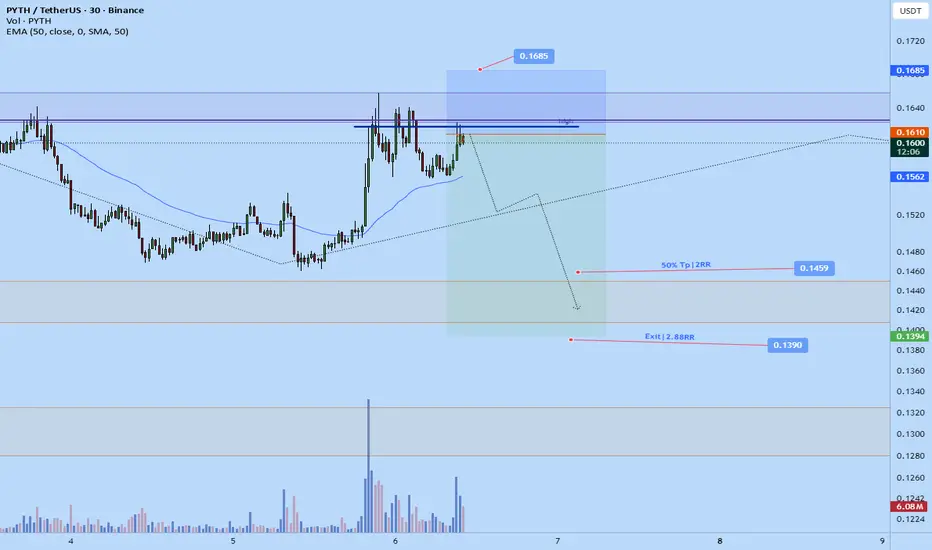
Pyth expected to dump back to $0.139Opened a new short position on pyth not too long ago.
Sl above daily LH on the internal structure at $0.1685
tp 1: 0.1459
tp2: 0.1390
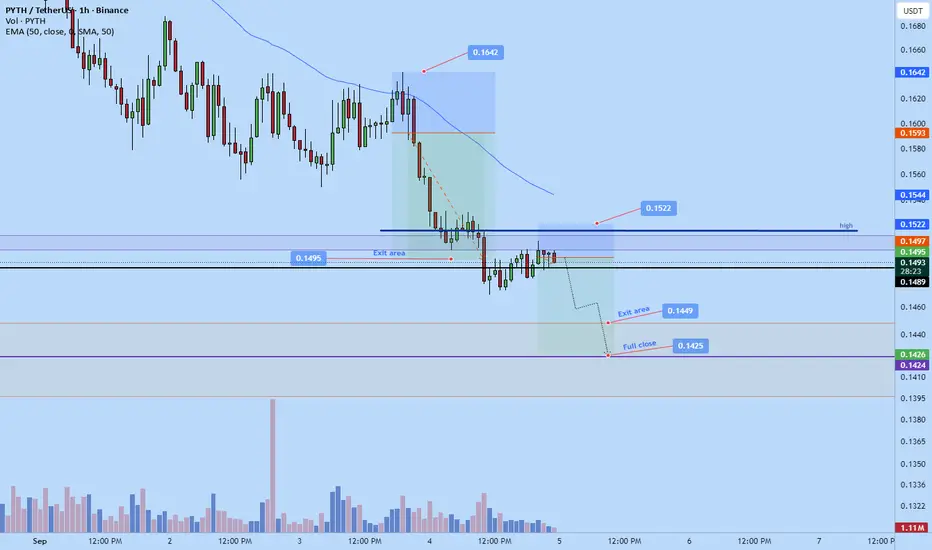
Pyth to dump again! $0.1425Just now opened a new short position on pyth. Expecting the dumping to continue today.
tp: 0.1425
Potential early closure at $0.1449
See all ideas
Summarizing what the indicators are suggesting.
Oscillators
Neutral
SellBuy
Strong sellStrong buy
Strong sellSellNeutralBuyStrong buy
Oscillators
Neutral
SellBuy
Strong sellStrong buy
Strong sellSellNeutralBuyStrong buy
Summary
Neutral
SellBuy
Strong sellStrong buy
Strong sellSellNeutralBuyStrong buy
Summary
Neutral
SellBuy
Strong sellStrong buy
Strong sellSellNeutralBuyStrong buy
Summary
Neutral
SellBuy
Strong sellStrong buy
Strong sellSellNeutralBuyStrong buy
Moving Averages
Neutral
SellBuy
Strong sellStrong buy
Strong sellSellNeutralBuyStrong buy
Moving Averages
Neutral
SellBuy
Strong sellStrong buy
Strong sellSellNeutralBuyStrong buy
Displays a symbol's price movements over previous years to identify recurring trends.