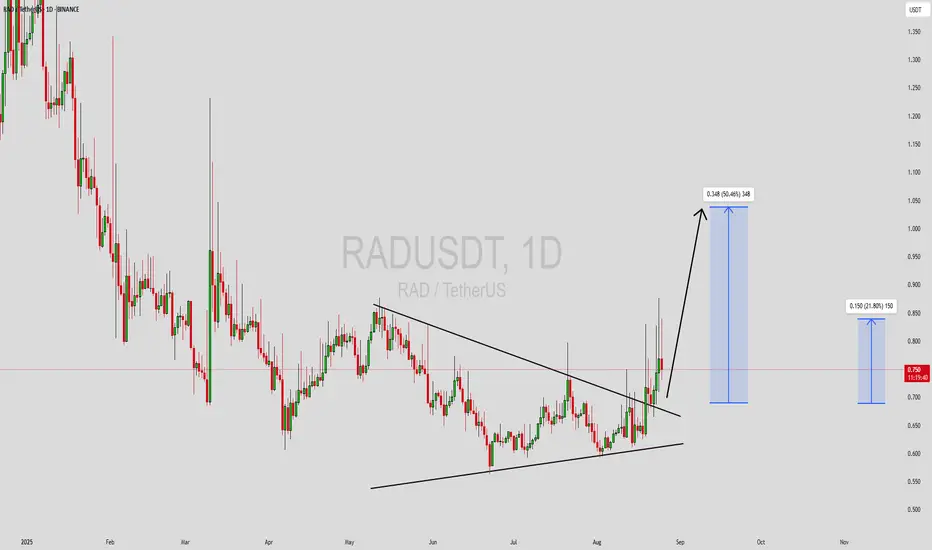
RADUSDT Forming Bullish ReversalRADUSDT is currently forming a strong technical setup that suggests a potential bullish move ahead. The chart reflects a narrowing price action that is setting the stage for a breakout. With good trading volume supporting the structure, this setup is gaining momentum and drawing increased attention from traders and investors. If confirmed, this move could deliver an upside potential of around 40% to 50% in the coming sessions.
The consolidation phase has allowed RADUSDT to build a strong base, which often precedes explosive moves. A breakout from this level could trigger fresh buying interest, as market participants look to capitalize on the upcoming trend shift. The volume pattern is in alignment with this bullish outlook, highlighting growing interest and participation.
Investor sentiment around this project has also been strengthening, which aligns with the technical indicators pointing toward a potential bullish reversal. With patience and careful entry timing, traders could position themselves for strong gains as RADUSDT gears up for a possible breakout rally.
✅ Show your support by hitting the like button and
✅ Leaving a comment below! (What is You opinion about this Coin)
Your feedback and engagement keep me inspired to share more insightful market analysis with you!
RADUSDT.P trade ideas

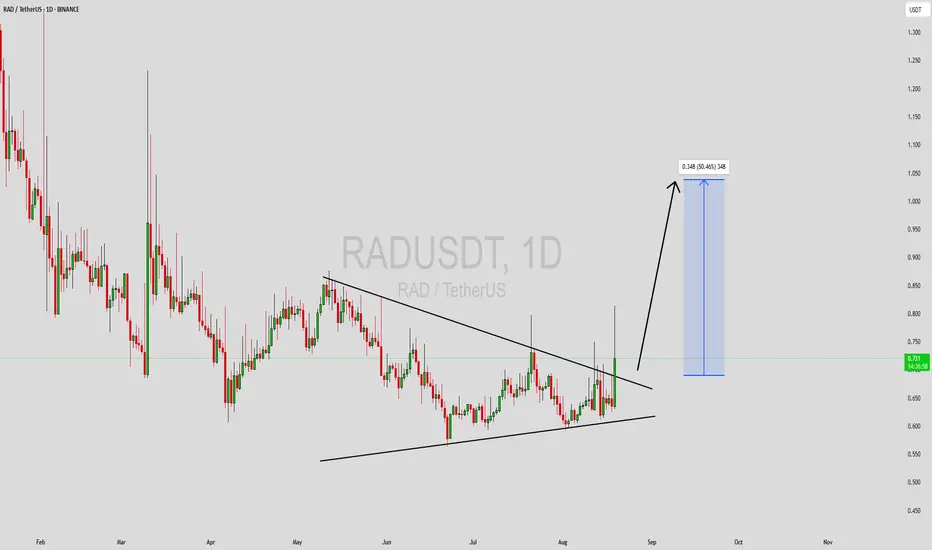
RADUSDT Forming Descending WedgeRADUSDT is currently forming a classic descending wedge pattern, a structure often recognized for its bullish reversal potential. This pattern indicates that while prices have been trending downward, the rate of decline has been slowing — often a sign that sellers are losing momentum and buyers are preparing to take control. A breakout above the upper trendline of the wedge could spark a strong upside move, especially with the supportive volume seen in recent trading sessions.
Volume levels are holding steady, suggesting accumulation within this compression zone. When paired with a descending wedge setup, this usually strengthens the case for an imminent breakout. Traders and investors closely watching this pair will likely treat a clean breakout as a signal to enter long positions, aiming for potential gains in the range of 40% to 50% based on the measured move technique from the wedge’s widest part.
The RAD project itself has been gaining visibility, which adds further strength to the technical breakout potential. With broader market recovery sentiment and increasing community support, RADUSDT could be setting up for a high-momentum rally. The confluence of price structure, volume, and investor interest makes this pair a standout candidate for bullish breakout setups on traders’ watchlists.
✅ Show your support by hitting the like button and
✅ Leaving a comment below! (What is You opinion about this Coin)
Your feedback and engagement keep me inspired to share more insightful market analysis with you!
RADUSDT 1D#RAD after several attempts to break above the falling wedge, finally managed to break out of the pattern and also above the daily EMA100. It can go higher only if a successful retest is completed and the support holds. In this case, the potential targets are:
🎯 $0.868
🎯 $1.056
🎯 $1.208
🎯 $1.360
🎯 $1.576
⚠️ As always, use a tight stop-loss and apply proper risk management.

RADUSDT Forming Descending WedgeRADUSDT is currently forming a classic descending wedge pattern, a structure often recognized for its bullish reversal potential. This pattern indicates that while prices have been trending downward, the rate of decline has been slowing — often a sign that sellers are losing momentum and buyers are preparing to take control. A breakout above the upper trendline of the wedge could spark a strong upside move, especially with the supportive volume seen in recent trading sessions.
Volume levels are holding steady, suggesting accumulation within this compression zone. When paired with a descending wedge setup, this usually strengthens the case for an imminent breakout. Traders and investors closely watching this pair will likely treat a clean breakout as a signal to enter long positions, aiming for potential gains in the range of 40% to 50% based on the measured move technique from the wedge’s widest part.
The RAD project itself has been gaining visibility, which adds further strength to the technical breakout potential. With broader market recovery sentiment and increasing community support, RADUSDT could be setting up for a high-momentum rally. The confluence of price structure, volume, and investor interest makes this pair a standout candidate for bullish breakout setups on traders’ watchlists.
✅ Show your support by hitting the like button and
✅ Leaving a comment below! (What is You opinion about this Coin)
Your feedback and engagement keep me inspired to share more insightful market analysis with you!
RADUSDTRAD can make 3x easy they have great project
Good Entry now with these price, you can keep it for long term investment.

RADUSDT UPDATE
Pattern: Falling Wedge Breakout
Current Price: \$0.819
Target Price: \$1.45
Target % Gain: 80.77%
Technical Analysis: RAD has broken out of a long-term falling wedge on the 1D chart. Price is consolidating above the breakout level, signaling potential continuation. A measured move targets 80% upside.
Time Frame: 1D
Risk Management Tip: Always use proper risk management.

RADUSDT CHART ANALYSİS - EDUCATIONAL POSTHow NFT Technology Developed
NFT technology was created in 2017 based on Ethereum smart contracts. Since then, we have witnessed many successful NFT projects and deals. Stories like these perfectly describe the current and future possibilities of the technology.
The development of blockchain technology and the emergence of NFT services coincided with other processes in society and the economy. Many new players appeared in the stock markets, including non-professional traders and amateur investors.
The democratization of financial markets coincided with the pandemic: being in self-isolation, alone with their devices, many people began to pay attention to new financial instruments.
The information that arose around them also played a specific role in the “revival” of NFTs. The big names in the news headlines supporting NFTs couldn’t help but draw attention to them. That is one of the reasons why the success of the technology was inevitable.

RADlike the trades I posted already it a long-term trade and a very good opportunity to trade stick with the stoploss
best wishes .

Trading opportunity for RADUSDTBased on technical factors there is a Buy position in :
📊 RADUSDT
🔵 Buy Now
🪫Stop loss 1.260
🔋Target 1.490
📏 R/R 1.6
💸RISK : 1%
We hope it is profitable for you ❤️
Please support our activity with your likes👍 and comments📝

RADUSDT: %220 Daily Volume Spike – The Smartest Entry Revealed!RADUSDT is seeing a massive %220 daily volume spike , signaling an intense surge of activity. For those looking to capitalize on this momentum, the blue box zone represents the most rational and carefully chosen entry point.
Why This Matters:
The Blue Box Advantage: This zone has been meticulously selected using advanced tools like volume footprint, volume profile, cumulative delta volume (CDV), and liquidity heatmaps . It’s designed to pinpoint where buyers are likely to step in.
Confirmation Is Key: I will validate trades in the blue box using CDV, liquidity heatmaps, volume profiles, volume footprints (ensuring buyer presence), and upward market structure breaks in lower time frames .
Risk Management: While the opportunity is huge, the market still demands caution. Always maintain strict risk management rules.
Why Boost and Comment?
Your engagement motivates me to keep sharing such precise and actionable insights. If you find this analysis helpful, please don’t forget to boost and comment ! Let’s win together.
Want to Learn the Process?
I’m happy to teach anyone for free! DM me to learn how I use CDV, liquidity heatmaps, volume profiles, and volume footprints to find these high-probability zones.
If you think this analysis helps you, please don't forget to boost and comment on this. These motivate me to share more insights with you!
I keep my charts clean and simple because I believe clarity leads to better decisions.
My approach is built on years of experience and a solid track record. I don’t claim to know it all, but I’m confident in my ability to spot high-probability setups.
If you would like to learn how to use the heatmap, cumulative volume delta and volume footprint techniques that I use below to determine very accurate demand regions, you can send me a private message. I help anyone who wants it completely free of charge.
My Previous Analysis (the list is long but I think it's kinda good : )
🎯 ZENUSDT.P: Patience & Profitability | %230 Reaction from the Sniper Entry
🐶 DOGEUSDT.P: Next Move
🎨 RENDERUSDT.P: Opportunity of the Month
💎 ETHUSDT.P: Where to Retrace
🟢 BNBUSDT.P: Potential Surge
📊 BTC Dominance: Reaction Zone
🌊 WAVESUSDT.P: Demand Zone Potential
🟣 UNIUSDT.P: Long-Term Trade
🔵 XRPUSDT.P: Entry Zones
🔗 LINKUSDT.P: Follow The River
📈 BTCUSDT.P: Two Key Demand Zones
🟩 POLUSDT: Bullish Momentum
🌟 PENDLEUSDT.P: Where Opportunity Meets Precision
🔥 BTCUSDT.P: Liquidation of Highly Leveraged Longs
🌊 SOLUSDT.P: SOL's Dip - Your Opportunity
🐸 1000PEPEUSDT.P: Prime Bounce Zone Unlocked
🚀 ETHUSDT.P: Set to Explode - Don't Miss This Game Changer
🤖 IQUSDT: Smart Plan
⚡️ PONDUSDT: A Trade Not Taken Is Better Than a Losing One
💼 STMXUSDT: 2 Buying Areas
🐢 TURBOUSDT: Buy Zones and Buyer Presence
🌍 ICPUSDT.P: Massive Upside Potential | Check the Trade Update For Seeing Results
🟠 IDEXUSDT: Spot Buy Area | %26 Profit if You Trade with MSB
📌 USUALUSDT: Buyers Are Active + %70 Profit in Total
🌟 FORTHUSDT: Sniper Entry +%26 Reaction
🐳 QKCUSDT: Sniper Entry +%57 Reaction
📊 BTC.D: Retest of Key Area Highly Likely
I stopped adding to the list because it's kinda tiring to add 5-10 charts in every move but you can check my profile and see that it goes on..

Trading opportunity for RADUSDTBased on technical factors there is a Buy position in :
📊 RADUSDT
🔵 Buy Now
🪫Stop loss 1.190
🔋Target 1.600
📏 R/R 2
💸RISK : 1%
We hope it is profitable for you ❤️
Please support our activity with your likes👍 and comments📝

RAD Pump to 2.4XX $ is about to happen after break 1.8XX $ Area Radicle (RAD) has recently experienced a significant price surge, but it's important to be cautious about its future direction.
Key Technical Analysis:
* Fakeout: to 2.4XX is more likely to happen
* Potential Correction: A deeper correction towards the $1.6 or $1.5 support levels is possible.
Remember:
* Do Your Own Research: Always conduct thorough research before making any investment decisions.
* Risk Management: Use stop-loss orders to protect your investments from potential losses.
* Diversification: Spread your investments across different assets to reduce risk.
Stay tuned for more updates on Radicle and other cryptocurrencies!
Disclaimer: This is not financial advice. Please do your own research before making any investment decisions.
TRY TO HAVE AN ADVENTAGE FROM FAKEOUT PUMPS AND TRADE THE RANGE UNTIL IT BREAKS

#RAD #Next 7X Gem on Spot! 06/12/2024💎 Next 7X Gem on Spot! 💎
Get ready, traders! We have multiple confirmations for a breakout alert based on the 4D Chart! 🚀
🔥 Key Indicators:
- Falling Wedge Breakout
- Three-Ball Bottom
- Very close to breaking the triangle and rectangle patterns!
⏰ Current Price: $1.72
🎯 Targets: $2.70 | $4.50 | $6.63 | $8.20 | $9.70 | $11.00 | $12.50
❌ Invalidation Level: If the 4D candle closes below $1.09
Stay alert and happy trading! 💰✨
#Trading #Crypto #Breakout #Investing #SRFXGlobal

RAD to FLIP 1.3 to Support Will open Doors to 1.8Radicle (RAD) has recently experienced a significant price surge, but it's important to be cautious about its future direction.
Key Technical Analysis:
* Fakeout: The recent pump above the $1.53 level could be considered a fakeout, as the price has since retraced to the $1.3 support level.
* Potential Correction: A deeper correction towards the $1.20 or $1.00 support levels is possible.
Remember:
* Do Your Own Research: Always conduct thorough research before making any investment decisions.
* Risk Management: Use stop-loss orders to protect your investments from potential losses.
* Diversification: Spread your investments across different assets to reduce risk.
Stay tuned for more updates on Radicle and other cryptocurrencies!
Disclaimer: This is not financial advice. Please do your own research before making any investment decisions.
TRY TO HAVE AN ADVENTAGE FROM FAKEOUT PUMPS AND TRADE THE RANGE UNTIL IT BREAKS

RAD/USDT: Eyeing a Potential Breakout Above Trendline Resistance RAD/USDT: Eyeing a Potential Breakout Above Trendline Resistance
RAD/USDT is showing strong potential for a breakout 🚀 as it approaches a key trendline resistance on the chart 📉➡️📈. The price action is consolidating within a narrowing range, hinting at a potential explosive move 💥. If a breakout occurs, it could trigger a solid bullish run 📊. Traders should watch closely 👀 for confirmation signals before making any decisions.
Key observations:
1. Trendline resistance: RAD/USDT is testing a well-defined downward trendline. Multiple rejections at this level make it a critical zone to monitor.
2. Volume dynamics: A spike in trading volume during a breakout would confirm strong buyer interest 📈.
3. Bullish momentum: Indicators such as RSI and MACD are currently signaling improving momentum ⚡, which aligns with the potential breakout narrative.
Tips for confirming a breakout:
- Candle close above resistance: Wait for a 4H or daily candle to close convincingly above the trendline resistance 🔑.
- Increased volume: A significant rise in volume during the breakout indicates strong participation by buyers 📊.
- Retest of broken resistance: A retest of the trendline as support post-breakout strengthens the validity of the move 🔄.
- Avoid false breakouts: Monitor for wicks or quick reversals above the resistance, which may indicate a trap ⚠️.
Potential targets (if breakout is successful):
- Immediate resistance:
- Next resistance:
Risk management:
- Always use stop-loss orders to protect your capital 🛡️.
- Position sizing should align with your risk tolerance 🎯.
This analysis is for informational purposes only. It is not financial advice. Always do your own research (DYOR) 🔍 before making any investment decisions.

RAD fake out Pump above 1.6 and then flip 1.4 to support RAD fake out Pump above 1.6 and then flip 1.4 to support its time now to have some liquidity

#RAD (SPOT) entry range ( 1.000- 1.110)T.(2.470) SL(0.990)BINANCE:RADUSDT
entry range ( 1.000- 1.110)
Target (2.470)
1 Extra Targets(optional) in chart, if you like to continue in the trade with making stoploss very high.
SL .1D close below (0.990)
Golden Advices.
**********************
* collect the coin slowly in the entry range.
* Please calculate your losses before the entry.
* Do not enter any trade you find it not suitable for you.
* No FOMO - No Rush , it is a long journey.
Useful Tags.
**********************
My total posts
( www.tradingview.com )
1Million Journey
( www.tradingview.com )
( www.tradingview.com )
********************************************************************************************************************** #Manta ,#OMNI, #DYM, #AI, #IO, #XAI , #ACE #NFP #RAD #WLD #ORDI #BLUR #SUI #Voxel #AEVO #VITE #APE #RDNT #FLUX #NMR #VANRY #TRB #HBAR #DGB #XEC #ERN #ALT #IO #ACA #HIVE #ASTR #ARDR #PIXEL #LTO #AERGO #SCRT #ATA #HOOK #FLOW #KSM #HFT #MINA #DATA #SC #JOE #RDNT #IQ #CFX #BICO #CTSI #KMD #FXS #DEGO #FORTH # AST #PORTAL #CYBER #RIF #ENJ #ZIL #APT #GALA #STEEM #ONE #LINK #NTRN #COTI #RENDER #ICX #IMX #ALICE #PYR #PORTAL #GRT #GMT # IDEX #NEAR #ICP #ETH #QTUM #VET #QNT #API3 #BURGER .

$RAD will fly - Breakout & RetestBroke out of the wedge and retested on the daily.
Same pattern can be seen in other altcoins as well.
Market is bullish, CRYPTOCAP:BTC going to 78K and alts following with strong pump.
After new ATH i expect for CRYPTOCAP:BTC.D to calm down and fall below 60% , at this point with bitcoin approaching and breaking ATH we want a strong dominance.
US elections pump is here and either you're locked or missed it .

Radworks Perfect Chart Setup For Sudden/Fast GrowthThis is it. If you are looking for a pair/chart that is about to produce a strong jump, suddenly, this is it.
The rounded bottom already proved twice to be a strong reversal signal on this pair. In this instance, we are looking at the third one in a row. It is the lowest one and the biggest one... We are looking at Radworks (RADUSDT).
There was a major low in November 2022. Another one in October 2023. RADUSDT moved below these levels and is now trading back above them. This trading above is ultra-bullish and opens the doors for a massive bullish wave.
We are talking about a short-term bullish breakout, fast, but the overall growth can happen long-term. The bottom will be something of the past. So it can move fast at first and then continue growing long-term based on an uptrend. This is what the chart is currently saying.
Looks good. We will now let the market take care of the rest.
Thank you for reading.
Namaste.

#RAD $RAD#RAD still have 100% profit before it goes anywhere
Check the trade with stop loss
BINANCE:RADUSDT

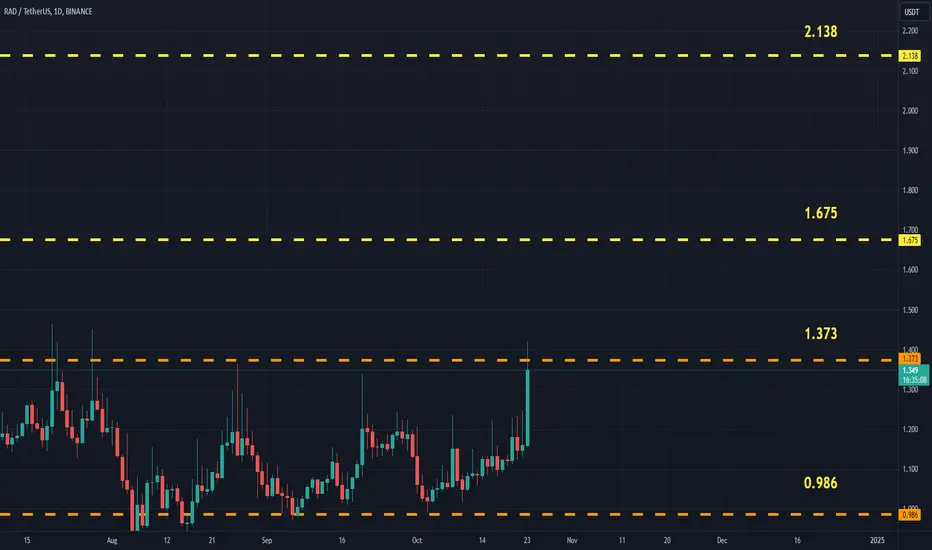
RADUSDT (Radworks) Updated till 23-10-24RADUSDT (Radworks) Daily timeframe range. another alt been in its local low level for a long time now. trying to break through 1.373 a clean close over it can push it further. local support at 0.986.
$rad to 1.4XX Area in no time MIL:RAD is showing strength from time to time with healthy pullback
now its time for Rising and convert 1.4X area to Support ,
buy now on discounted Price and Chil Later BINANCE:RADUSDT BINANCE:RADUSDT

RADUSDT - UniverseMetta - Analysis#RADUSDT - UniverseMetta - Analysis
Update of the previous forecast..
On D1, the price consolidated above the upper border of the narrowing channel, which may be a signal for long-term purchases, with targets for updating 3.58. It is clear that the price tried to return to the channel, but found support there at 0.97. Further, consolidation is visible at these values and the formation of a triangular formation with a breakout of the trend line. Now a potential retest of this level may be realized, which may lead to a continued increase in volumes for purchase.
Target: 1.34 - 3.58
