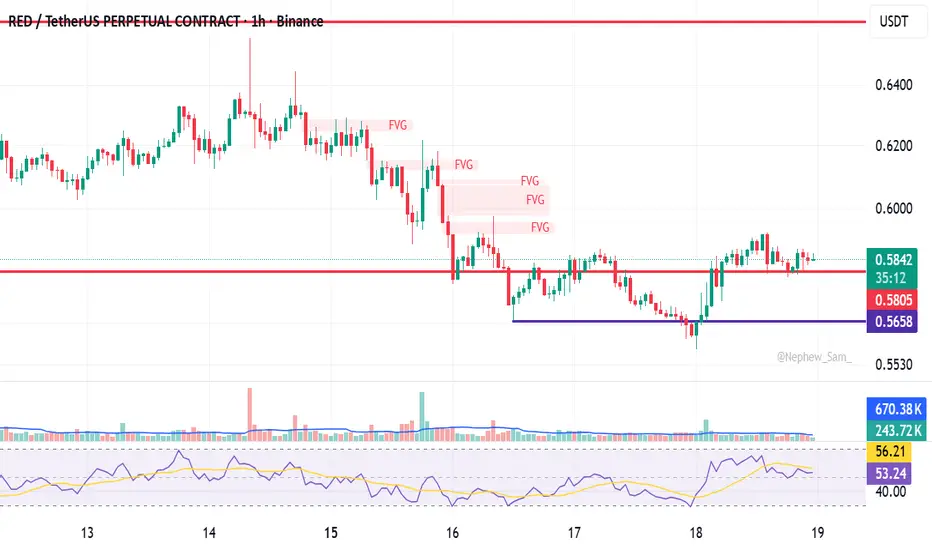
redusdt done a bullish reversal triangle pattern redusdt just done a bullish reversal triangle pattern in 1hr tf.
it looks like is a successful reversal play to continuation pump above the moon.
confluence with other factor:
daily rsi momentum is 59.
still remain in bullish momentum in higher time frame.
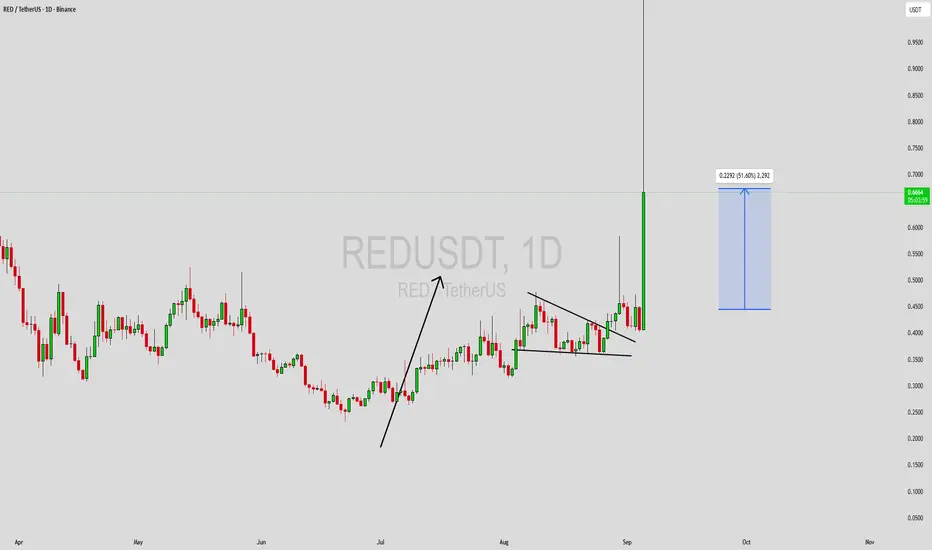
REDUSDT Forming Falling WedgeREDUSDT is currently forming a falling wedge pattern, a bullish reversal setup that often indicates the end of a downtrend and the beginning of a strong upward move. This structure reflects tightening price action, with lower highs and lower lows converging, typically followed by a breakout to the u

REDUSDT Forming Falling WedgeREDUSDT is currently forming a falling wedge pattern, a bullish reversal setup that often indicates the end of a downtrend and the beginning of a strong upward move. This structure reflects tightening price action, with lower highs and lower lows converging, typically followed by a breakout to the u
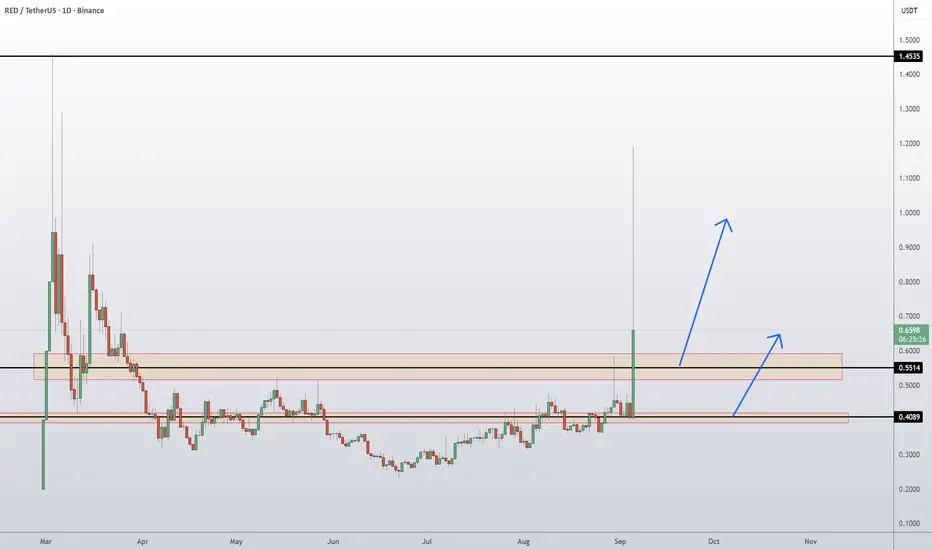
RED Coin RedStone Token Price Prediction and Technical AnalysisRED/USDT has broken out of its long consolidation phase with a sharp rally, showing strong momentum. Price surged above the 0.5514 resistance and is now trading around 0.6703, attempting to hold above this breakout structure. If buyers maintain control, continuation toward the major resistance at 1.
SPOT BREAKOUT ALERT - RED/USDT📈SPOT BREAKOUT ALERT 📈
BME:RED is up average +65% today, but I think bulls could push price much higher!
Quick stats:
✅ $2.4B+ TVL, 300k+ users
✅ Live on Binance Loans
✅ Integrated with 50+ protocols, securing 25+ DVNs
✅ Kelp: 2nd largest LRT on ETH
✅ Leading staking infrastructure on BNB Chai

RED/USDT - GOD Candle Over the past two months, RED/USDT has been trending in a sloppy but steady uptrend, signaling accumulation and gradual strength building. Recently, price has successfully reclaimed the $0.35 zone and stabilized above it, a strong indication that buyers are firmly in control.
This reclaim sets the

#RED/USDT – Too Late, or One More Chance?#RED
The price is moving within a descending channel on the 1-hour frame, adhering well to it, and is heading for a strong breakout and retest.
We have a bearish trend on the RSI indicator that is about to be broken and retested, supporting the upside.
There is a major support area (in green) at

RED Market Update📊 RED Market Update
RED is currently retracing after its recent move 📉
If you missed the first entry or are looking for a re-entry / more accumulation, the smart play is to wait for price to reach the green support zone 🟢
👉 Volume Profile shows strong buyer accumulation at this level.
👉 If price pu

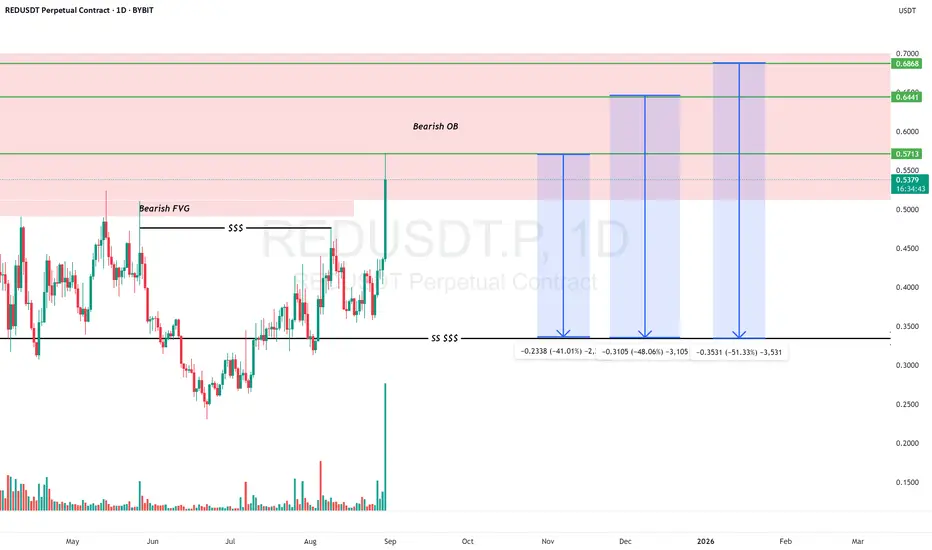
REDUSDT Next Possible MoveLikely a reversal to the downside from $0.5713, $0.6441 or $0.6868 provided the weekly order block is not mitigated.
The preferred position should be a short position.
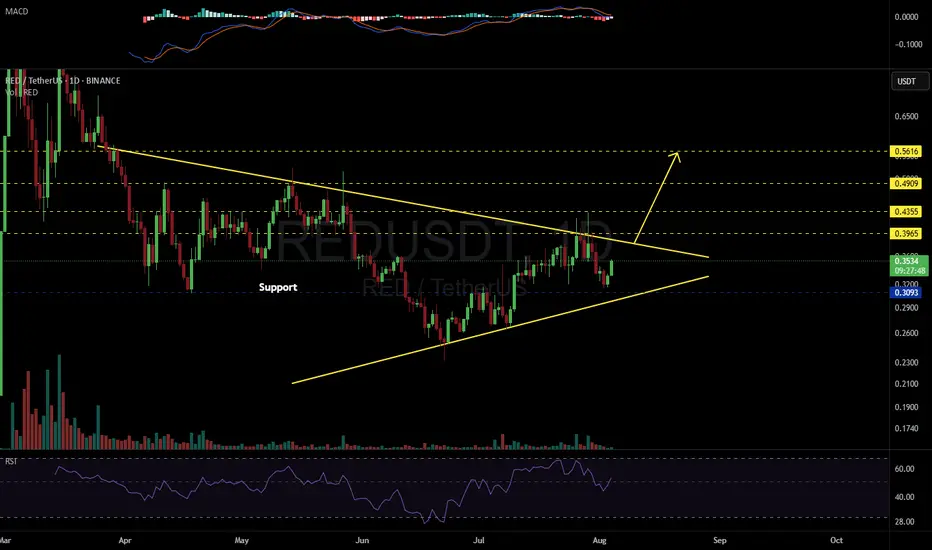
REDUSDT 1D#RED is moving inside a symmetrical triangle on the daily chart.
📌 Consider buying at the current price and near the support level at $0.3093 in case of a dip.
If a breakout occurs above the triangle resistance, the potential upside targets are:
🎯 $0.3965
🎯 $0.4355
🎯 $0.4909
🎯 $0.5616
⚠️ As alwa
See all ideas
Summarizing what the indicators are suggesting.
Oscillators
Neutral
SellBuy
Strong sellStrong buy
Strong sellSellNeutralBuyStrong buy
Oscillators
Neutral
SellBuy
Strong sellStrong buy
Strong sellSellNeutralBuyStrong buy
Summary
Neutral
SellBuy
Strong sellStrong buy
Strong sellSellNeutralBuyStrong buy
Summary
Neutral
SellBuy
Strong sellStrong buy
Strong sellSellNeutralBuyStrong buy
Summary
Neutral
SellBuy
Strong sellStrong buy
Strong sellSellNeutralBuyStrong buy
Moving Averages
Neutral
SellBuy
Strong sellStrong buy
Strong sellSellNeutralBuyStrong buy
Moving Averages
Neutral
SellBuy
Strong sellStrong buy
Strong sellSellNeutralBuyStrong buy