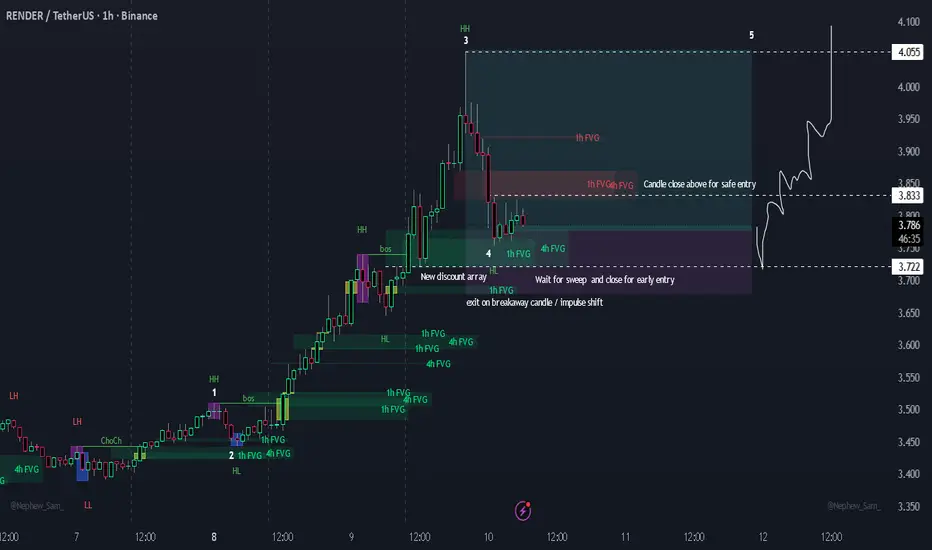
New Render/USDT Discount ArrayNew Render/USDT Discount Array
Price may possibly use new discount array to move higher from - see the chart for ideas. All the best.
🚩 Invalidation: If the Daily FVG breaks with a clear breakaway candle, this setup is void.
RNDR 8H – Demand Zone Retest, Watching Downtrend BreakRender continues to respect the demand zone near 3.2–3.3, with price forming a series of lower highs under descending resistance. Price is once again retesting this support while momentum (Stoch RSI) attempts a rebound.
If buyers can defend this zone and push through downtrend resistance, continuat

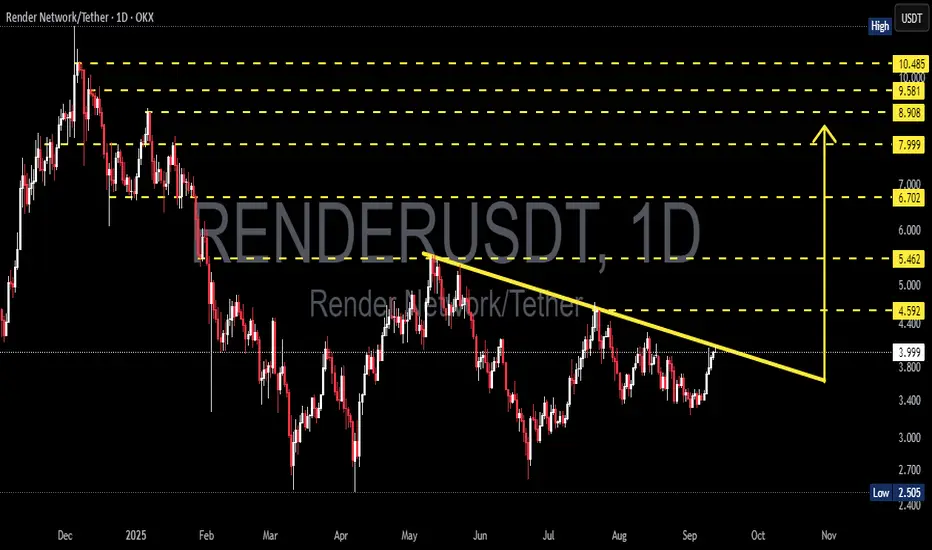
RENDER/USDT — Time Decide: Major Breakout or Another Rejection?RENDER is now at a critical point after being suppressed for months by the descending trendline (yellow). Each rally attempt has been rejected at this line — but once again, price is testing it. This zone will decide the next major move.
---
🔎 Technical Overview
Main trend: Since the peak at $10.
RENDER Long zonesRENDER possible zones where it's going to have rejections.
If hits them, be sure you set the TP ~2-3% and SL as well.

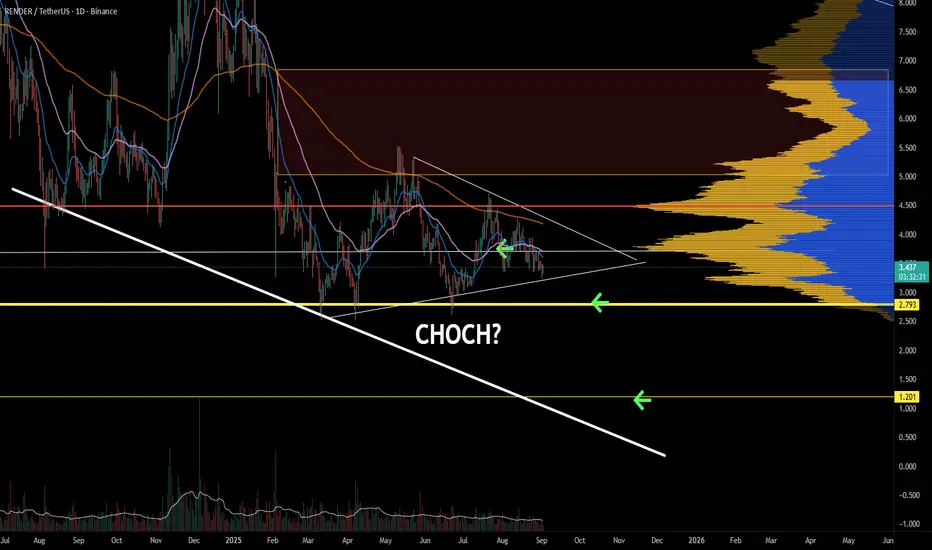
RNDER is trying to form its pivot bottom. RNDR is consolidating in a triangular formation. The bias is to the downside. However, this could be the last consolidation for swing failure that causes the reversal—time to focus.
RENDER 4H – EMA Bullish Cross, Testing $4.22 ResistanceRENDER has confirmed an EMA bullish cross, signaling a potential shift toward upside momentum. Price is currently pressing against the $4.22 resistance level.
Upside:
Clearing $4.22 opens the path toward the next resistance at $4.41.
A breakout above $4.41 would target the $4.64 liquidity pool, w

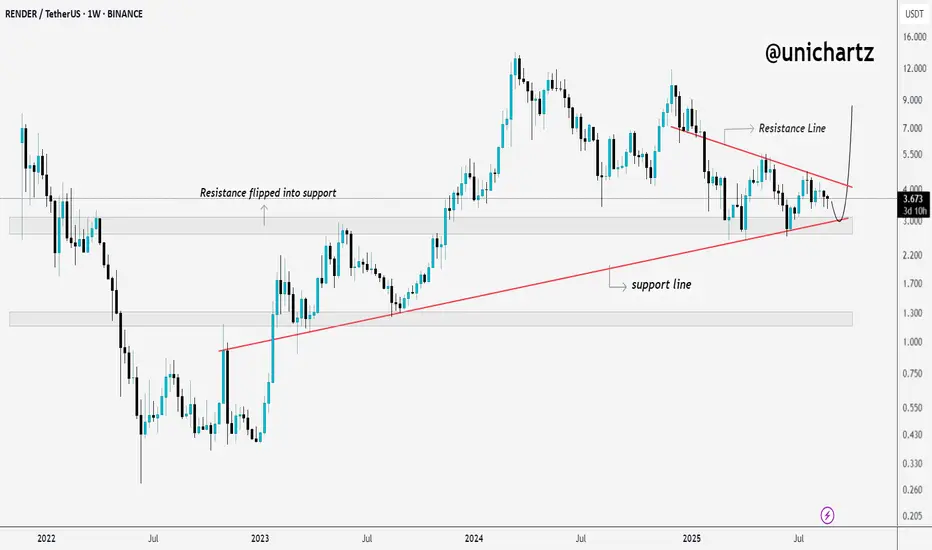
Watch This Zone – RNDR Weekly Setup Heating UpCRYPTOCAP:RENDER is trading within a tightening wedge, squeezed between a descending resistance and a rising support line, a setup hinting at a potential breakout.
The previously broken resistance has flipped into support and continues to hold. If bulls maintain this level and break above the wedg
RNDR 4H – Bounce From Demand, Channel Resistance Next?Render is trading inside a descending channel, bouncing from the demand zone near 3.35.
Bullish path: A move through local resistance could push price back into channel highs, with liquidity sitting around 4.71.
Bearish path: Failure to break above resistance leaves price vulnerable to another swe

RENDER on the RiseAfter months of consolidation, RENDER is preparing to breach the resistance band and the resistance trend line. Depending on how ETH performs, movement to the upside could happen very soon.
However, if we see ETH and BTC dip in September (which seems quite possible), we'll see a drop to the $2.5–$

RNDR 4H – Supply Hit, Demand Still in PlayRNDR spiked from the 3.59–3.50 demand zone and tagged supply around 3.85–3.90, where sellers have stepped in.
Key structure to watch:
A hold above ~3.82 could see another retest of the 3.90 supply box.
A break lower reopens the path toward the 3.59–3.50 demand zone for potential liquidity grabs.

See all ideas
Summarizing what the indicators are suggesting.
Oscillators
Neutral
SellBuy
Strong sellStrong buy
Strong sellSellNeutralBuyStrong buy
Oscillators
Neutral
SellBuy
Strong sellStrong buy
Strong sellSellNeutralBuyStrong buy
Summary
Neutral
SellBuy
Strong sellStrong buy
Strong sellSellNeutralBuyStrong buy
Summary
Neutral
SellBuy
Strong sellStrong buy
Strong sellSellNeutralBuyStrong buy
Summary
Neutral
SellBuy
Strong sellStrong buy
Strong sellSellNeutralBuyStrong buy
Moving Averages
Neutral
SellBuy
Strong sellStrong buy
Strong sellSellNeutralBuyStrong buy
Moving Averages
Neutral
SellBuy
Strong sellStrong buy
Strong sellSellNeutralBuyStrong buy
Displays a symbol's price movements over previous years to identify recurring trends.