RETADRIO 0.002 most hated AI Agent and Worse when nobody wants it
perhaps somebody will take over it
or maybe this is just how meme ai tokens work
they really flush out the last man holding or outsiders
until they all buy it all for themselves
in time for ANATOLY to reveal the Good New Order of SOLANA on December in ABY DHABI
Not Financial Advice guys
this is a totally a RETARD move
not even a CONTRARIAN will do
you can loose all your money here
Trade ideas

$Retardio LongI have added to my Retardio long. The entire crypto memespace is well... you get it.
No other token comes close to defining the entire space. I'll be holding this one for a long time just because of the lolz. Not advice. This is retardio.
$RETARDIO: Falling Wedge Pattern Hints at Potential Reversal$RETARDIO, a Solana-based meme token that has recently experienced a dip while forming a falling wedge pattern—a historically bullish formation. As market participants assess its price action and fundamentals, could this signal an imminent breakout?
Technical Analysis: Falling Wedge and Fibonacci Insights*
Since January 20th, $RETARDIO has been consolidating within a falling wedge pattern, a setup known for its potential to reverse downward trends into bullish breakouts. Despite the overall bullish sentiment in the crypto market, $RETARDIO has yet to follow suit, instead hovering near a key support level.
A crucial technical level to watch is the 65% Fibonacci retracement point. If the asset gravitates towards this zone, it could serve as an ideal liquidity pool for buyers, allowing for a shakeout of weak hands before a potential rally. Supporting this perspective is the Relative Strength Index (RSI) at 56, which suggests the token is not yet overbought, providing room for an upside move.
Furthermore, a breakout above the wedge’s resistance could signal the beginning of a bullish trajectory, drawing in traders eyeing confirmation of the reversal pattern.

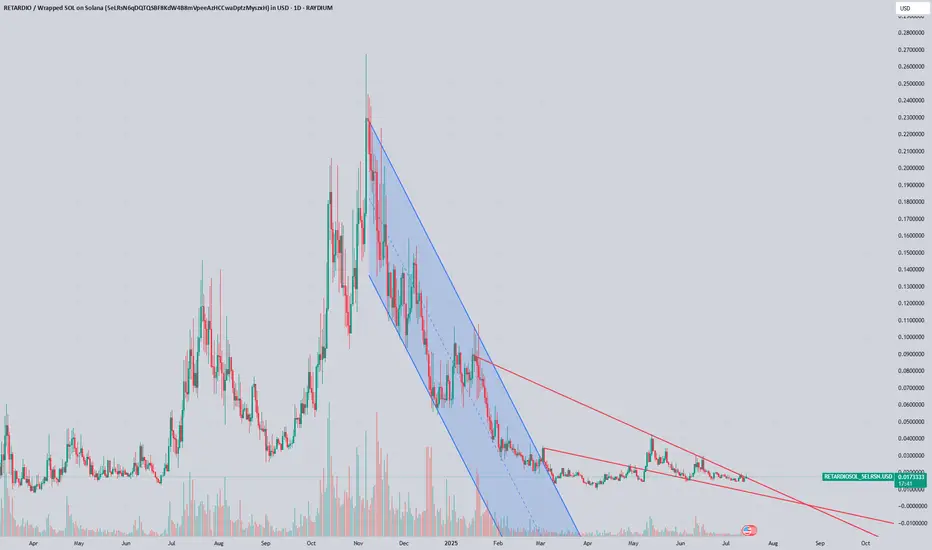
RETARDIO trend reversalRETARDIO one of Murads shilling meme coins has confirmed that it is confined within the channel. All signs where there, low RSI <30 , inversion of MACD. im seeing a test of the median line.
Edit: my initial analysis was reported due to a tweeter link that I had embedded... :(

RETARDIO MeMeCoinRETARDIO, is a token based on the Solana blockchain.
Its daily trading volume is approximately $3.19 million, and its market capitalization amounts to $62.7 million.
keep a part of its "Profit" for probable big gain!

Retardio (RETARDIOSOL) - Technical Analysis (1D Chart)Retardio (RETARDIOSOL) is showing signs of a potential reversal on the 1D chart. The price is holding above the key $0.0651 support zone, which aligns with previous levels where buyers stepped in. The stochastic oscillator is in oversold territory, adding to the possibility of a bounce. If the reversal plays out, the price could move towards the $0.10-$0.15 resistance zone, with a longer-term target near $0.29, as highlighted by the green area on the chart. A breakdown below $0.0651 would invalidate this setup, but for now, the support looks solid. Let’s see how this plays out!

5-0 RetardioBullish 5-0 pattern forming on the 4 hour chart for Retardio. Looks like a good risk/reward trade to me.
