XRP heading towards ATH $3.66Price Action: The current price (3.0435) is within a consolidation range, with a recent upward movement. The chart shows a potential resistance zone around 3.0435–3.24, where previous highs were tested, and a support level near 3.031, aligning with the 50-period Simple Moving Average (SMA 50) close.
Bullish 🚀
RIPPLE trade ideas

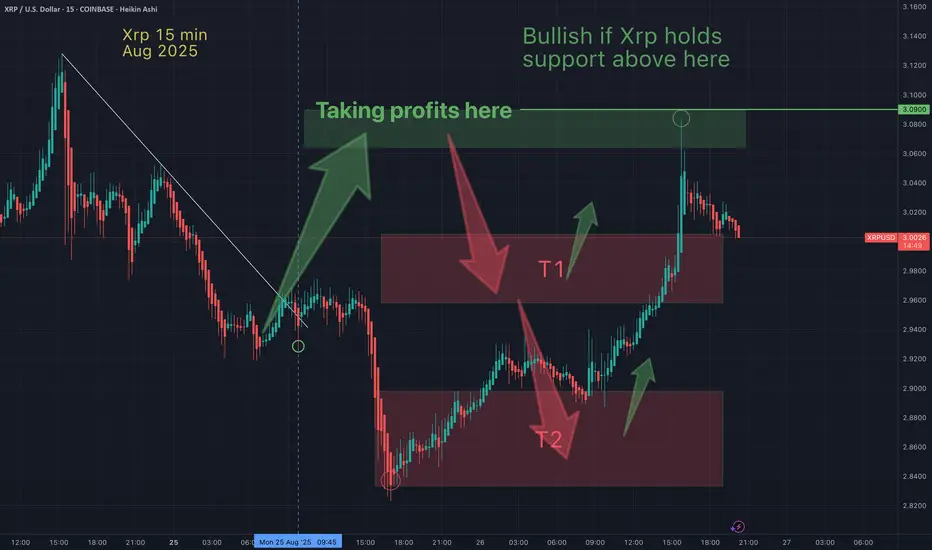
Xrp - I was wrongFor the first time in the last 50+ charts I was wrong about (initial) direction. I believed Xrp would hit my bullish (take profit) target 1st... then hit my beasrish T2 target. But the opposite occured. I like to keep stats on my calls and be transparent when I wrong. Errors can always be a learning opportunity.
The upshot is that my support and resistance were spot on (and profits were taken within less than 1% of my take profit target). TA works!
Published yesterday (Aug 25th):
May the trends be with you.
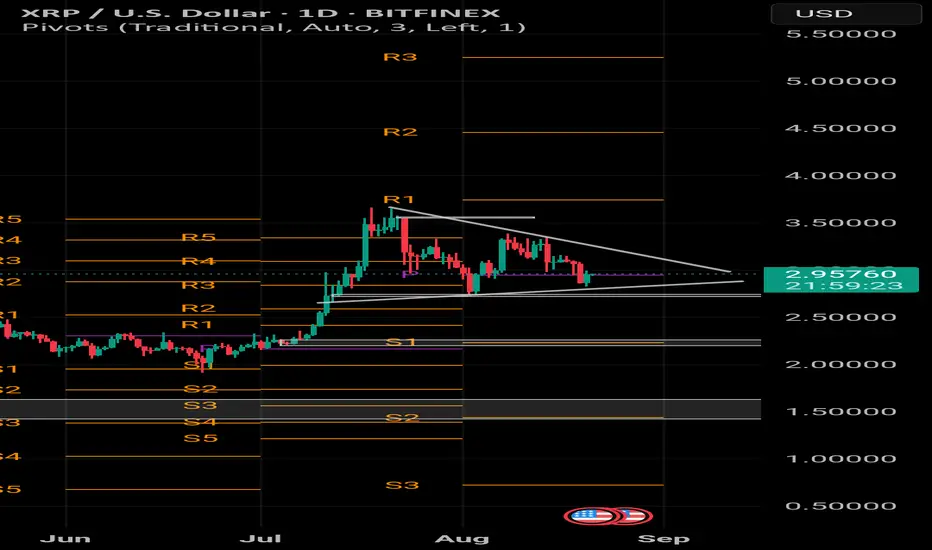
XRP – Triangle Intact but Bearish Momentum BuildingI typically like to look for short term trades but felt like sharing what I see on the daily chart,
XRP remains inside a large symmetrical triangle (2.85–3.12 range). Price rejected strongly at 3.12 (upper trendline) and sold off to 2.85 (lower support), confirming the pattern is still valid.
• RSI: slipped under 50 → bearish momentum creeping in.
• Bollinger Bands: Basis line near 2.95 acting as resistance; price is sitting closer to the lower band (2.80) than the upper (3.20). Bands are tightening, showing volatility compression before a bigger move.
• Volume: Sellers showed conviction on the rejection at 3.12, while bounce volume is weaker, hinting at fading buyer strength.
Key Levels to Watch:
• Bearish trigger: Daily close below 2.80 → targets 2.60, then 2.30.
• Bullish trigger: Daily close above 3.10 with volume → targets 3.50, then 3.80.
👉 Until the breakout, XRP is neutral on structure but tilting bearish as it presses lower support with weakening momentum.
#XRP #Crypto #Altcoins #TechnicalAnalysis #PriceAction #TrianglePattern #CryptoTrading

H4 Gap Manipulation Here we have a four hour gap that we tapped into, but never expanded out of it and instead accumulated what comes next is manipulation and finally distribution. I anticipate a sweep on the liquidity to then displace higher.

Next xrp long updateSorry I actually did an update a little while ago but I guess it didn’t post.
That rejection at 2.94 turned green. Hit the first profit target of 2.95 which has flipped to short term support.
I set a stop loss just below to secure profits. About 9% at 30x margin. It’s a little tight but I’m headed out of reception and perfectly fine with the small wins.
Hopefully this short term support holds and we see the next leg up.

XRP SwingsThe July 2025 surge was fueled by a technical breakout, Bitcoin’s broader rally, Trump’s pro-crypto stance, Ripple’s SEC settlement, renewed institutional interest, and bullish trading forecasts.
Now, after the sharp move, XRP is consolidating in a triangle pattern and defining new territory. If no major news arrives, expect price to bounce inside the formation.
Setup: Buy near $2.80, take profit at $3.00, stop loss at $2.60. Suitable for short swing plays while range holds.

XRP in bearish territory XRP 95-Day Bearish Case (Target $2.45)
1. Current Setup (Day 0 – Now at $2.97)
• Struggling under the $3.00–$3.05 resistance zone.
• RSI downtrend → loss of bullish momentum.
• 50 SMA flattening → sideways/downward bias.
• Lower highs forming → sellers remain in control.
⸻
2. Short-Term (0–30 days → into late September)
• Likely rejection at $3.00 → drifting lower.
• First support test: $2.75–$2.70.
• If weakness continues → wick down to $2.50–$2.45 before bounce.
⸻
3. Long-Term (60–95 days → November)
• XRP retests $2.50–$2.75 support zone.
• Consolidation as sellers fade.
• Buyers begin stepping in → pushing XRP back toward $3.00.
⸻
Macro Outlook Beyond 95 Days
• 200 Days Out (≈ April 2026)
XRP establishes a medium price range, likely between $2.80–$3.20.
Market consolidates → creating a base for accumulation.
• +30 Days Later (≈ March 2026)
XRP blasts off into its final leg of the bullrun.
Historically, altcoin cycles peak after extended consolidation → this lines up with a March 2026 macro-top thesis.
⸻
📉 Short-term: XRP likely weakens to $2.45 before recovery.
📈 Long-term: Base formation leads to a parabolic move in early 2026.

XRP – Intraday Long Setup from Support BounceI just shared my thoughts on XRP being slightly bearish on the daily but somewhat neutral for taking a position but I also like to trade small moves for short term, days, hours or mins. Xrp is a little bullish on short time frames. My R/R isn’t great, you could set a tighter stop.
Entry: ~2.88-2.91
• Stop: 2.82 (below recent swing low)
• Targets: TP1 = 2.95, TP2 = 3, TP3 = 3.05
If the price rejects 3.0 I would be looking to short to 2.9/2.85/2.80
XRP bounced from 2.83 support with RSI recovering from oversold. This setup offers ~1.6–1.7 R/R, with partials at TP1 and runners toward TP2–TP3. A clean break above 3.05 could extend toward 3.10+.
If the price rejects 3.0 I would be looking to short to 2.9/2.85/2.80

XRP BUllish FlagConsolidation triangle trap. It wants to break out but where?
With upcoming news of a weakening dollar it seems that a lot of stocks and crypto will begin to break out of the range for newer highs.
There will be a short window of a money grab when the highs are hit.
Just brace for a break out to the bullish side but it will be short lived.

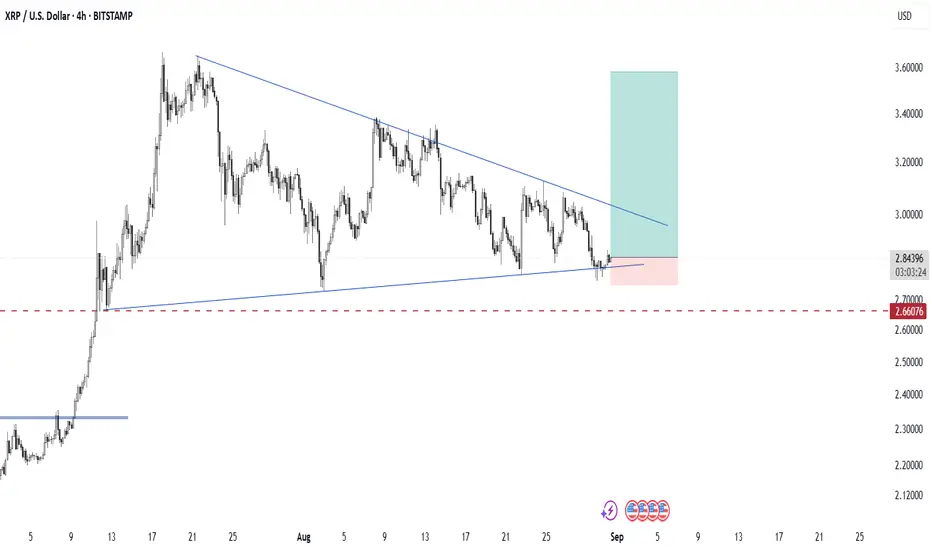
XRP 4H PatternXRP is currently consolidating within a symmetrical triangle pattern, with price action forming lower highs and higher lows. This indicates a period of compression where volatility is decreasing, and a potential breakout could be approaching.
At the moment, the price is testing the lower boundary of the triangle, showing signs of support. As long as XRP holds above the $2.66 support level (highlighted by the dashed red line), the bullish scenario remains valid.
Pattern: Symmetrical Triangle (continuation/neutral pattern)
Entry Zone: Current support trendline near $2.18–$2.20
Stop Loss: Below $2.66 support zone
Target Zone: $3.40 – $3.60 (upper projection of the triangle)
📌 A confirmed breakout above the descending trendline could trigger strong bullish momentum, while a breakdown below $2.66 would invalidate this setup and open the door for deeper correction.
XRP LABOR DAY SALEXRP HIT A CRITICAL SUPPORT ZONE BETWEEN $2.80-$2.76
Xrp can head back towards $3 to test resistance. If xrp breaks $3 it can head to $3.50 and breakout towards $5 on the weekly charting
This is not financial advice. Good luck!
-R2C

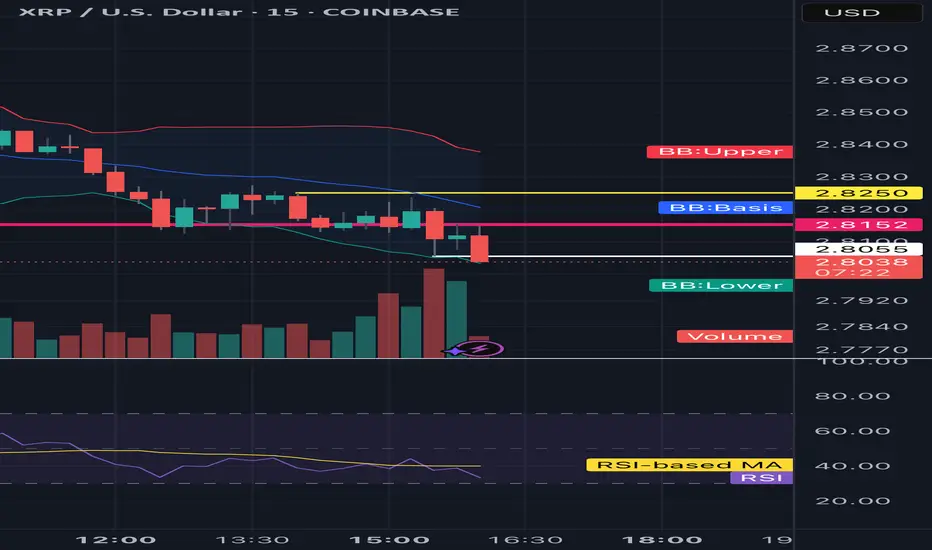
XRPUSD – Short Setup. Tread carefullyXRP Update (Short-term idea):
Price is in a clear downtrend, riding the lower Bollinger Bands across all timeframes. RSI is below 40 and still pointing down → momentum remains bearish. Volume confirms selling pressure.
📉 Setup leans short:
• Entry zone: $2.92–2.93
• TP: $2.90 → $2.87
• SL: Above $2.95
⚠️ Bullish reversal only if $2.90 support holds with strong bounce + RSI divergence. For now, bears remain in control.
It could flip bullish very easily tread carefully

GBPUSD & XRPUSDIn this video i went over my 2 trades set ups for the week i hope this video brings value information for you

XRP Next Extreme Area to Watch📉 CRYPTO:XRPUSD correction from the July peak is unfolding as a double three structure, with price still likely to test the $2.5–$2.2 zone before bulls return.
This area aligns with key Fibonacci symmetry and prior support, making it a potential launchpad for the next leg higher.
Let the structure complete then watch for confirmation.

XRP update all time frames XRP/USD – Bearish Bias, Watching 2.80 Support
XRP continues to trade in a downtrend across multiple timeframes.
🔹 Daily / 4H:
• Price below mid-Bollinger → bears in control.
• RSI < 40, weak momentum.
• Key support: 2.80 → break = 2.75–2.70.
🔹 1H / Lower TFs:
• Rejections at 2.83–2.85.
• Weak bounces near 2.81 but sellers dominant.
• Volume favors downside moves.
📉 Bias: Bearish unless 2.85–2.90 is reclaimed with strong volume.
⚠️ Break below 2.80 opens 2.75–2.70.
✅ Relief bounce possible only above 2.85 → targets 2.93–3.00.
XRP next 50 day analysis 🔎 Current Market Context is Bullish 🐂
• Price: ~$2.92 (as shown on your chart).
• Trend: Currently retracing after a sharp run-up, consolidating near support.
• Support Zone: Around $2.70- $2.80.
• 50-day SMA: Sloping upward, acting as dynamic support.
• RSI (7 close): Looks like it’s cooling off from an overbought region.
📉 Short-Term (next 10–15 days)
• If XRP holds above the horizontal support & 50-day SMA, buyers may step in.
• Expect sideways to slight upward action → potential retest of ~$3.27 - $3.35
📈 Medium-Term (15–30 days)
• Based on the bullish projection sketched:
• A rally could push XRP toward $3.80–$4.20.
• Likely stair-step pattern: higher highs & higher lows (as drawn).
• If volume increases, a breakout above $4 could attract momentum traders.
🚀 Long-Term (30–50 days)
• Strong bullish case: After a 20 percent pullback to previous resistance of $3.35 it will wave towards $5.
🐻 Bearish case - none of this will happen if the $2.70 support zone is broken downwards.

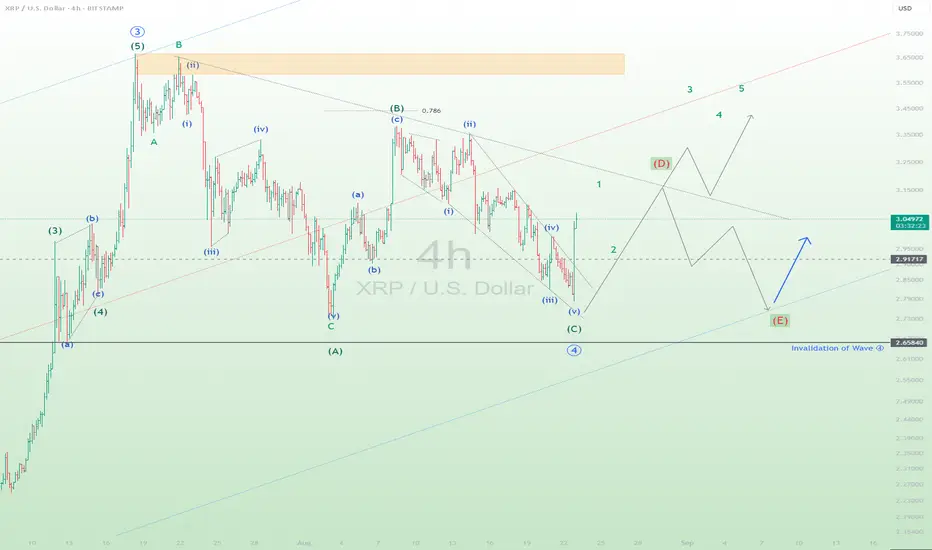
XRPUSD Wave C of Wave 4Trend: Correction within wave 4.
As of now, XRPUSD seems to have completed the wave (C) of wave 4 in the blue circle.
Now XRPUSD is making sub-wave 1 of wave 5 in the blue circle. Let the big trader complete wave 1 first.
If wave 4 in the blue circle is going to make a triangle, we can expect that she will reject the downtrend line at point (D). Let's see the next move.
This prediction is only my opinion. Only showing the EW counting and looking for trends. No trade recommendation.
XRP to $4 dollars 🔎 Chart Observations
1. Current Price: $3.07
2. Pattern: symmetrical triangle (consolidation before a breakout.)
3. Support: Around $2.98- $3.00
4. Resistance: Descending trendline near $3.20 – $3.33
5. Projected Move: Orange arrow shows breakout toward all time highs and reaching $4.20–$4.40 for the first wave 🌊
Bullish elephant bar 🐘 🚀

XRP - a note about pivotsShe's gonna bounce around in this area until the end of the month. Squeeze them new daily pivots and then rip.
Pivots are a marker for the average price of open orders, both to buy (S1-5) and sell (R1-5). The pivot itself is the most common price of the two right smack in the middle, a very powerful pull. They change based on the time frame you're in. The larger the time frame the stronger the pull.
Once a new time cycle starts, new pivots are issued. They will expand and contract as orders push the price quick or slow. If they become closer together the move out will be explosive, and you'll have to use other indicators to tell which way she'll break.
You'll often see pivots line up within supply and demand zones. (Again areas of open orders). Give them a watch for a while and see how it plays.
Follow for more
SELL XRPThe market show good seller demand at the bottom so I gonna sell it here , the previous trend line is broken by a strong buyer so now the market must be go down to take some liquidity

XRP Holds $2.80 Support as Bulls Target BreakoutXRP has pulled back into the $2.80 support zone, a region reinforced by the 50-day moving average and the value area high. Strong buying volume suggests this retest could fuel a move toward new highs.
XRP’s correction has settled into a critical support area that has so far absorbed selling pressure effectively. The $2.80 zone, supported by the 50-day moving average and the value area high, has provided stability for price action in recent sessions. This confluence of technical levels gives buyers a strong foundation to defend, increasing the probability of continuation if the level holds.
The importance of this region lies not only in its structural strength but also in its volume profile. The overlap between high-time frame support and a high-volume trading area suggests that demand is concentrated here. Such zones are often treated as accumulation ranges, where long-term buyers absorb supply and prepare for a new leg upward.
Key Technical Points:
- $2.80 High-Time Frame Support: Aligned with both the 50-day moving average and the value area high.
- Bullish Retest Developing: Current reaction shows resilience, keeping the higher-highs and - higher-lows structure intact.
- Volume Confirmation: Above-average buying volume signals strong demand at this level.
Structurally, XRP continues to respect its bullish market trajectory. Since reclaiming the point of control earlier in the year, the asset has moved in a steady rhythm of higher highs and higher lows. The current bounce from $2.80 underlines that the broader bullish trend remains intact despite short-term volatility.
Volume trends further strengthen the case for continuation. The presence of above-average bullish inflows suggests that the current retest is less a breakdown and more a validation of support. This level of participation shows that market participants are prepared to accumulate XRP at higher price zones, a sign of confidence that often precedes impulsive upside moves.
It is also worth noting that XRP does not need an immediate breakout to remain constructive. Consolidation above $2.80 would serve as a healthy base, helping to stabilize the market while flushing out weak hands. Periods of sideways price action often act as launchpads for stronger moves when buyers eventually regain momentum.
What to Expect in the Coming Price Action
As long as XRP sustains multiple daily closes above $2.80, the bullish case remains intact. Continued strong volume will reinforce the likelihood of an advance beyond the swing high, opening the path toward new all-time highs. The current retest represents a pivotal juncture, and if buyers maintain control, XRP could soon resume its bullish expansion into uncharted territory.

possible movepossible further move to the downside, then move back up toward the resistance area. Hopefully, all will be well in the world, and we will make some money! LOL Just an idea.

Long!! I opened a leverage long position over the weekend. I am planning to take profit at $4, $4.50 and $5. Stop loss is at $2.7
Reasons for a long position:
1) The price has pulled back and found a clear support at Fib .5 and EMA55.
2)The current chart set up is very similar to that in Jan 2025 (see green vertical line in the chart).
3) RSI is consolidating in the bull zone.
4) MACD lines are bunched up together and moving horizontally. However, the lines are in the bull zone and MACD histogram shows bear momentum is waning. It might be safer to wait for MACD lines to cross to the upside, but there are enough confluences for bullish bias.
5) The daily candle is now moving above Fib 0.236. Fib 0.236 often works as the last line of defence for the bear and if it is breached, it is very likely to move to the upside.
