XRP Holds $2.80 Support as Bulls Target BreakoutXRP has pulled back into the $2.80 support zone, a region reinforced by the 50-day moving average and the value area high. Strong buying volume suggests this retest could fuel a move toward new highs.
XRP’s correction has settled into a critical support area that has so far absorbed selling pressure effectively. The $2.80 zone, supported by the 50-day moving average and the value area high, has provided stability for price action in recent sessions. This confluence of technical levels gives buyers a strong foundation to defend, increasing the probability of continuation if the level holds.
The importance of this region lies not only in its structural strength but also in its volume profile. The overlap between high-time frame support and a high-volume trading area suggests that demand is concentrated here. Such zones are often treated as accumulation ranges, where long-term buyers absorb supply and prepare for a new leg upward.
Key Technical Points:
- $2.80 High-Time Frame Support: Aligned with both the 50-day moving average and the value area high.
- Bullish Retest Developing: Current reaction shows resilience, keeping the higher-highs and - higher-lows structure intact.
- Volume Confirmation: Above-average buying volume signals strong demand at this level.
Structurally, XRP continues to respect its bullish market trajectory. Since reclaiming the point of control earlier in the year, the asset has moved in a steady rhythm of higher highs and higher lows. The current bounce from $2.80 underlines that the broader bullish trend remains intact despite short-term volatility.
Volume trends further strengthen the case for continuation. The presence of above-average bullish inflows suggests that the current retest is less a breakdown and more a validation of support. This level of participation shows that market participants are prepared to accumulate XRP at higher price zones, a sign of confidence that often precedes impulsive upside moves.
It is also worth noting that XRP does not need an immediate breakout to remain constructive. Consolidation above $2.80 would serve as a healthy base, helping to stabilize the market while flushing out weak hands. Periods of sideways price action often act as launchpads for stronger moves when buyers eventually regain momentum.
What to Expect in the Coming Price Action
As long as XRP sustains multiple daily closes above $2.80, the bullish case remains intact. Continued strong volume will reinforce the likelihood of an advance beyond the swing high, opening the path toward new all-time highs. The current retest represents a pivotal juncture, and if buyers maintain control, XRP could soon resume its bullish expansion into uncharted territory.
RIPPLE trade ideas

XRP at Channel Support – Bounce or Breakdown?XRP is trading inside a clear descending channel on the 4H timeframe, with price now sitting near the bottom support zone around $2.85–$2.89. RSI is in oversold territory and curling upward, suggesting a possible short-term bounce.
Key levels to watch:
• Support: $2.85 (channel bottom).
• Resistance: $2.95–$3.00 (channel midline), then $3.05–$3.06 (channel top / EMA).
📈 If XRP breaks above $3.06 with strong volume, it would confirm a potential bullish breakout toward $3.15–$3.20.
📉 But if $2.85 fails, the next downside targets are $2.82 and $2.75.
For now, this looks like a possible bounce inside a bearish channel — reversal confirmation only comes on a breakout.
⸻
Tags:
#XRP #Crypto #TechnicalAnalysis #RSI #Trading

SHORT | XRPUSDCOINBASE:XRPUSD
XRPUSD Daily – Bearish Continuation in Play
Trend Structure
Market printed a Higher High near 3.66 but failed to sustain momentum.
Recent price action has shifted into a sequence of Lower Highs, confirming bearish control.
Current structure shows LH → LL pressure, with momentum pointing lower.
EMA Context
Price is already below the 9 EMA, confirming short-term weakness.
The 35 EMA has failed to hold as support.
The 100 EMA aligns with demand and marks a critical inflection point.
Fib + Key Levels
38.2% retracement at 2.995 has been broken — bearish confirmation.
50% retracement at 2.788 is the near-term magnet.
61.8% retracement at 2.580 is a strong support cluster with EMA + demand zone.
Targets
TP1: 2.247 (aligns with 78% retracement + demand)
TP2: 1.909 (major liquidity zone and deeper correction target)
Invalidation
A daily close above 3.25–3.30 would weaken the bearish thesis and shift focus back to range consolidation.
Bias
Short-term to mid-term bearish. Expecting continuation toward 2.78 → 2.58 first, with potential extension into 2.24 and 1.90 if supports fail.

XRP next 50 day analysis 🔎 Current Market Context is Bullish 🐂
• Price: ~$2.92 (as shown on your chart).
• Trend: Currently retracing after a sharp run-up, consolidating near support.
• Support Zone: Around $2.70- $2.80.
• 50-day SMA: Sloping upward, acting as dynamic support.
• RSI (7 close): Looks like it’s cooling off from an overbought region.
📉 Short-Term (next 10–15 days)
• If XRP holds above the horizontal support & 50-day SMA, buyers may step in.
• Expect sideways to slight upward action → potential retest of ~$3.27 - $3.35
📈 Medium-Term (15–30 days)
• Based on the bullish projection sketched:
• A rally could push XRP toward $3.80–$4.20.
• Likely stair-step pattern: higher highs & higher lows (as drawn).
• If volume increases, a breakout above $4 could attract momentum traders.
🚀 Long-Term (30–50 days)
• Strong bullish case: After a 20 percent pullback to previous resistance of $3.35 it will wave towards $5.
🐻 Bearish case - none of this will happen if the $2.70 support zone is broken downwards.

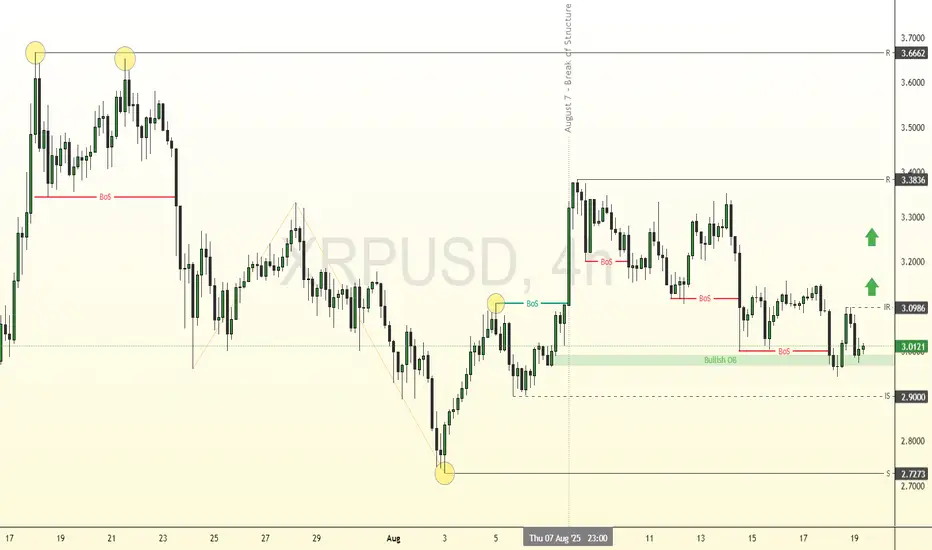
XRP: Key Support at $2.72 Holds Bullish OutlookFenzoFx—XRP (Ripple) broke its bearish structure with a strong engulfing pattern on August 7 and is now consolidating near $3.00. This level is supported by a bullish order block, with immediate support at $2.90.
The 4-hour chart shows equal highs at $3.66, marking a liquidity target. Immediate resistance lies at $3.09, and a close above this level could resume the uptrend.
Xrp 4 hr Have a look at the RSI, I have noticed a correlation between price movement and time frame.
What do you think?

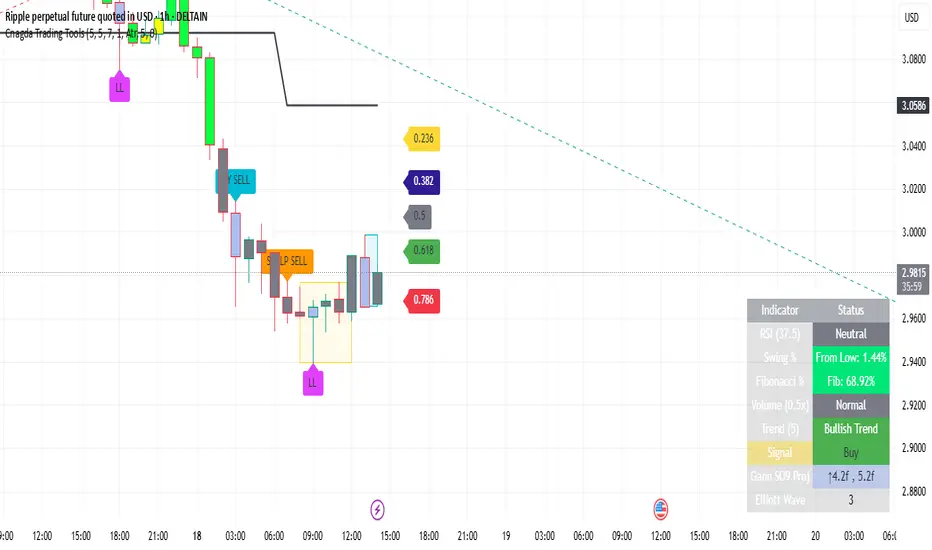
Xrp on Retracement ZoneThe price is currently under the retracement zone in 1 hour time frame, a bullish movement can come from here, the price is around 2.97 and from here our first target will be 3.04 and after that we will trail.
Apart from this, the support zone of 7 August is also here and POC is also present here, so we are getting double confirmation that we can predict long from here
And also if we look at the Elliot wave indicator of cnagda trading tool, then it is also showing phase 3, so definitely a bullish movement should come from here
Our Sl will be 2.95 and risk:reward = 1:4
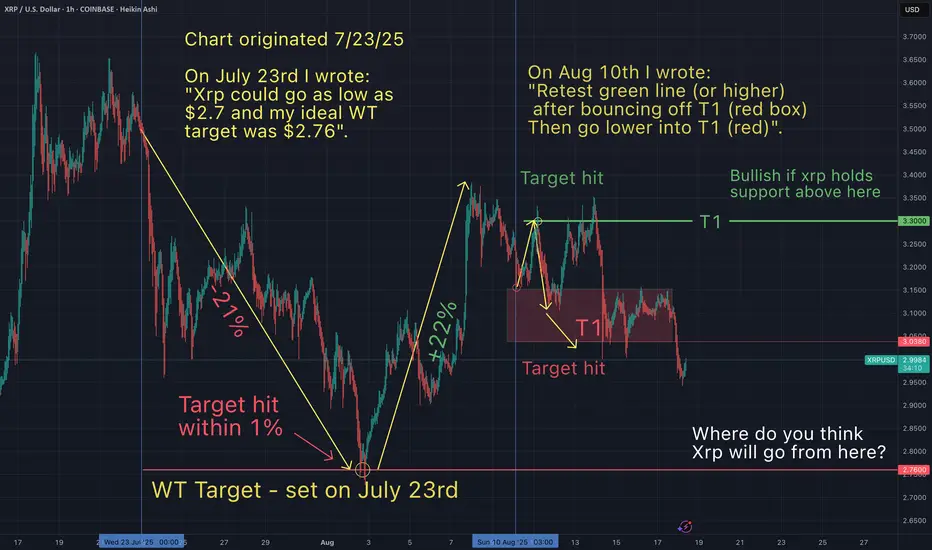
You continue to ask "how did he know Xrp would do that"?I like to keep stats on my predictions, and so should you. How else can you tell if someone is worth following? So, here's a recap since my first Xrp post ever, made on July 23rd 2025.
July 23rd- I suggested Xrp could go as low as $2.7 (a -25% dump from that day).
July 28th- As Xrp approached $2.7 I refined my predicition to a WT target of $2.76
Aug 2nd- My $2.76 WT target was hit (within 1%). See below
Aug 7th- I expected a big bounce from my WT target (20+%) and I followed up with a post, as we started to get close to that next top.
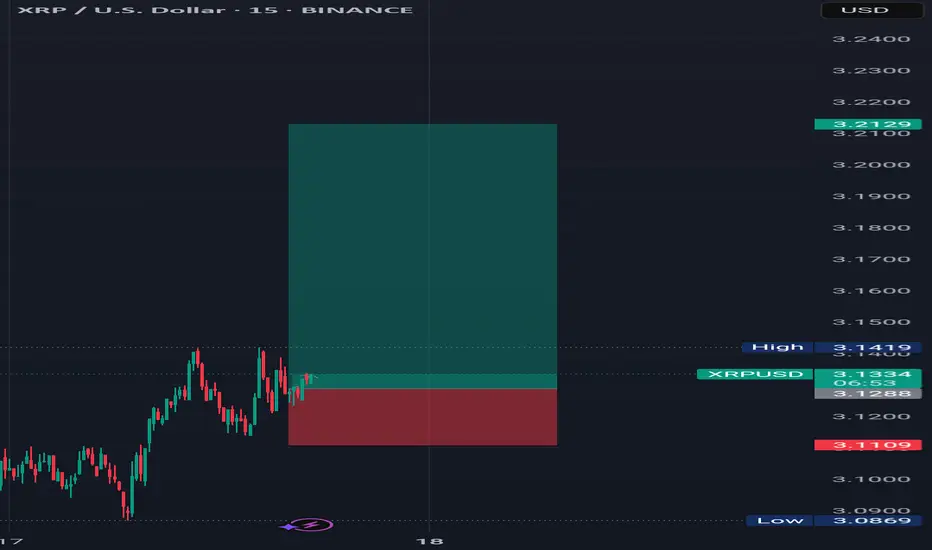
Aug 10- I called "the top was in", and I suggested that Xrp would drop to my support range of $3.03-$3.15 within 1-3 days. That target was hit 1.5 days later. I also suggested Xrp would bounce from my red T1 box and retrace up to my T1 green line...and then go lower into my red box. My calls on direction and target for each of these 3 moves were confirmed. See below.
Aug 11th- Xrp went lower into my red box as anticipated.
Notice in all of my charts, I do not simply offer support and resistance zones (as some influencers do). I anticipate the direction the asset will take as it travels through these zones. Simply identifying support and resistance is not enough to execute profitable trades. I hope that my accuracy in determining directionality and precise targets has been of benefit to you. I would like to see us all succeed.
Please note, I'm not sure how much longer I will continue to chart at this pace, being that it takes a lot of time & effort to bring you these free gold nuggets. Let me know if you want me to show you how I draw these maps to the gold mine.

XRP Weekly ChartPrice starting to move down, see if it breaks out of this range as clean traffic below.

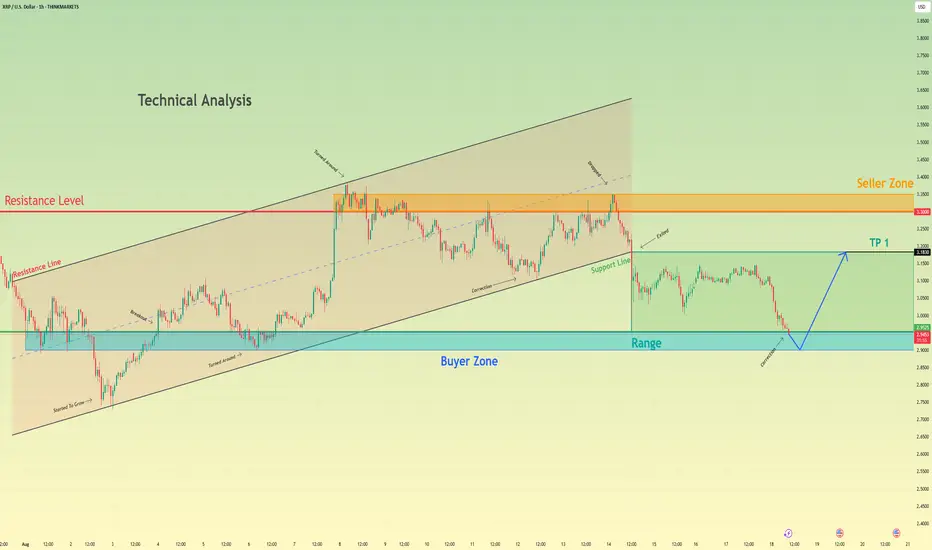
Ripple may bounce up from buyer zone to top part of rangeHello traders, I want share with you my opinion about Ripple. The market for Ripple has undergone a significant structural shift, with the prior upward channel giving way to a new phase of horizontal consolidation following a decisive breakdown. This event signaled a pause in the strong bullish momentum and established a new trading range, with the major buyer zone around the 2.9525 support level now acting as the foundational floor for the price. After the initial drop, the price has been trading within this new, more contained range, undergoing a series of corrective movements. Currently, the asset is in another downward leg, heading towards the critical buyer zone for what could be a decisive test of this support. The primary working hypothesis is a long scenario, based on the expectation that demand will overcome supply within this 2.9525 - 2.9000 area. A confirmed and strong rebound from this key support would indicate that the corrective phase is over and that buyers are ready to initiate a new rotation to the upside. Therefore, the TP for this range-based play is logically set at the 3.1830 level. This target corresponds with the top of the current consolidation range and represents the most probable objective for a bullish swing originating from the established support base. Please share this idea with your friends and click Boost 🚀
Disclaimer: As part of ThinkMarkets’ Influencer Program, I am sponsored to share and publish their charts in my analysis.
Classic Masonic Symbol setup on XRP /sJust trolling... But noticed a Masonic symbol in the XRP chart. Thought it was weird and should share for all the tinfoil hat types... haha

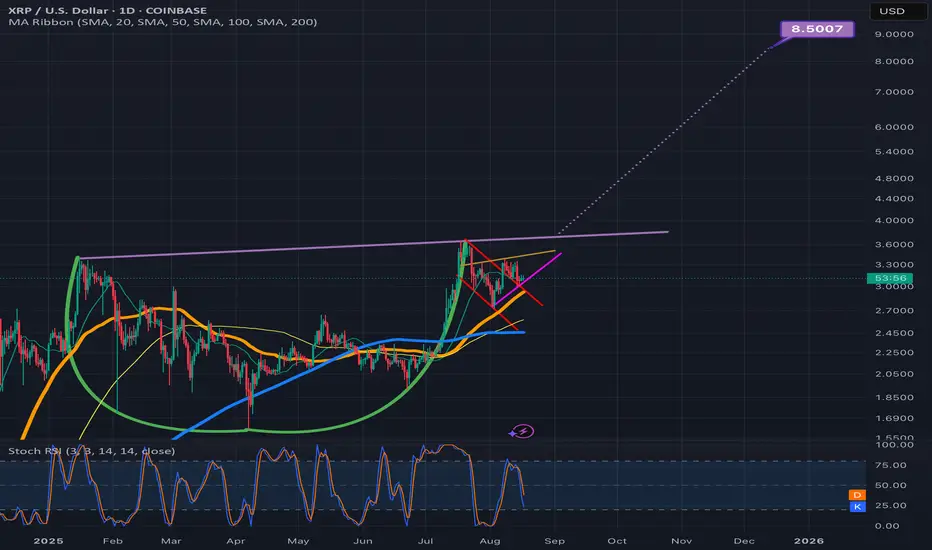
Log chart c&h patternThis one has an $8.50 target. This is the daily time frame, logarithmic scale. *not financial advice*
XRP Target Is 120$Ripple's target is $120 to $120 based on the middle of the triangle and the second leg.

XRP getting rdythere is not much to say.... its just pattern the same I saw many yrs ago somewhere .... XRP is preparing for blow yr minds just only

XRPUSD : Wave 4 possibly not yet completed.As of today, I see a new price pattern in XRPUSD.
The counting that is completed as of now seems like wave (A) and wave (B).
The price probably will go to wave (C) in 5 waves if it's going to be a flat pattern (3-3-5).
The other possibilities of wave 4 in the blue circle could be a triangle (ABCDE) or a double zigzag (complex).
I may be wrong. Please make your own analysis prior to placing any trade.

Minimum risk Maximum profit on XRP this weekI am anticipating a rapid growth in XRP in the next 30days. I enter low risk and keep going risk-free if the trade plays out well.
entry : 3.1
Sl : 3.03
Tp : 3.5, 4.0, 5.0 ath
my strategy is BE at every trigger.
Goodluck

XRP?
Hi
3.14 seems to be strong resistance.
So far its doing it,,, resist
What if it breaks?
Shall we see higher prints...
That pattern; some call H&Shoulders, some call jumanji, starwars,, etc etc
:)
The point is it name doesn't matter. As long the pattern prints higher prices and follow it's path.
If not, we ll call it smthg else
All the best.
Not a guru

$XRPUSD: Limits of Expansion🏛️ Research Notes
Documenting interconnections where historic area and coordinates of formations are used to express geometry of ongoing cycle.
If we scale out the chart back starting from roughly 2016, we can see more pretext like how the price was wired before decisive breakout from triangle.
Integrating fib channel to the angle of growth phase of the previous super-cycle, so that frequency of reversals match structural narrative.

XRP?
Hi,
Did some adjustment.
1st didn't work as smooth.
Will monitor & trade accordingly.
Out of range 3.18
Cautiously watching BTC, didn't expect it trade below bullish levels. 118200 (my2c)
When it broke 120k (bye bye 120).. I thought 130k will be smooth.
Anyways. We'll see how
Progress in crypto space.
All the best
Not a guru

buy I will take entry after the breakout of small time frame trendline ,In my analyses market have to go on up

XRP 4hr ChartHave a look at the lines I have drawn on the Chart, RSI and the Momentum indicator.
Looks like a W pattern on all levels. I'm not guarenting that Price hit's another ATH but, I wouldn't be Bearish on Xrp right now. This is the second wave down to retest $3.
Look on the brownish line on the price chart to see where price was the last time Momentum, Rsi relative to price. $1.90 V. $3 today Aug 15th
