XRP - IH&SLike I said in my last post, xrp was to hit 2.80. Nailed it. Right on the money!
Now, it seems like we're printing an IH&S. No other real patters are matching up l well. We finally have some liquidity in the market to chart some rough patterns.
I'm seeing a little push up off the bottom BB - to 3.12 ish? But rejection back down to the daily pivot for the right shoulder. And acuminate there prior to any news from the SEC. And then were primed and strapped to a rocket!
But honestly, who really knows what these MM have in store. So stay light on your feet in this area.
Roll them bones for it!
RIPPLE trade ideas

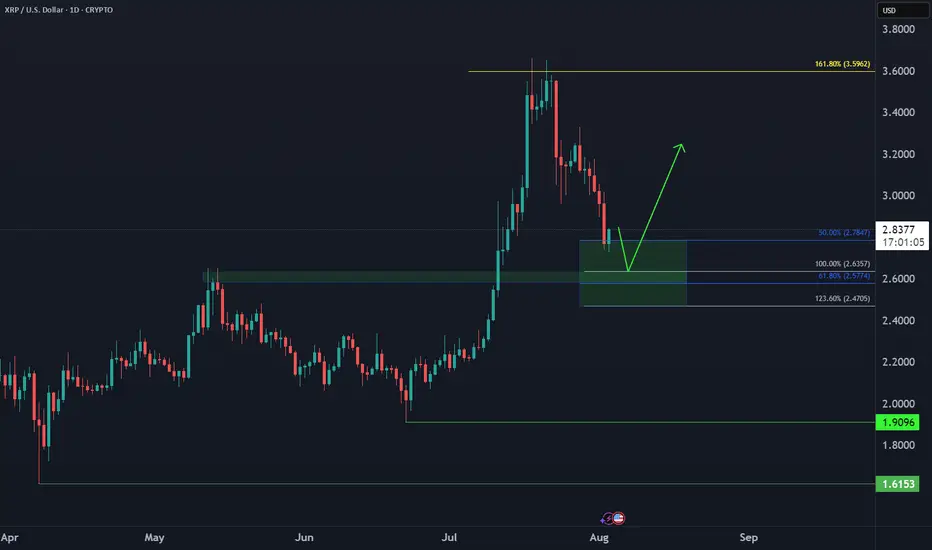
Ripple XRP Bullish Reversal📈 CRYPTO:XRPUSD dropped in 3 swings vs June low, now in buy zone $2.78–$2.47. Marginal lows still possible, but bounce expected next week from this extreme area.
XRPUSD Is Heading Up, The Best Case Above 3.66Possibility for xrpusd as well to go up. As we have complete h4 expanding flat.
The stop could be below the low of the latest low of bullish engilfing candle. The best case we can go all the way up above the high of July 2025, 3.66.
Dont risk more than 1 % for this trade.


$XRP ENJOYERRRs see ya at $1.04-$1.20If we look at the chart of XRP, you can see that since the move in fall of 2024, we've had a massive lack of balance on the chart.
We ran up quickly without testing any levels as support.
That makes me think we're going to see the lack of balance get corrected and the same move is now going to happen in the opposite direction.
The $1.04-1.20 region looks like a good area of support to me.

XRP/USD Breakout Watch: $3.22 Target in SightA key blue trendline on the XRP/USD chart that reflects market sentiment. If price breaks above it with strong volume, we could see a rally toward $3.22.
Support zone: $0.55–$0.60
Bullish case: Improved sentiment, easing tariffs, and regulatory cooling
Strategy: Wait for breakout confirmation before entering
Share your thoughts — are you preparing for a breakout?

XRP VS AI ?Hi,
This is fun, come on XRP $4.95
Average Speed (Points/Day) 0.053
Retracement Amount (Points) 0.80
Retracement % 51.28%
Probability of Retracement % 5-10%
Projected Next Move Size (Points) 2.09
Next Projected High Price 4.95
Estimated Duration to Next Target 39.4 days
Projected End Date 2025-09-10
All the best
Not a guru

XRPUSD 4 Hour BottomXRP has broken out of the weekly wedge leaving a long weekly candle stick close. Price has pulled back indicating it it ready for the next leg higher. Daily candle closed bullish and 4 hour time from has double bottom.

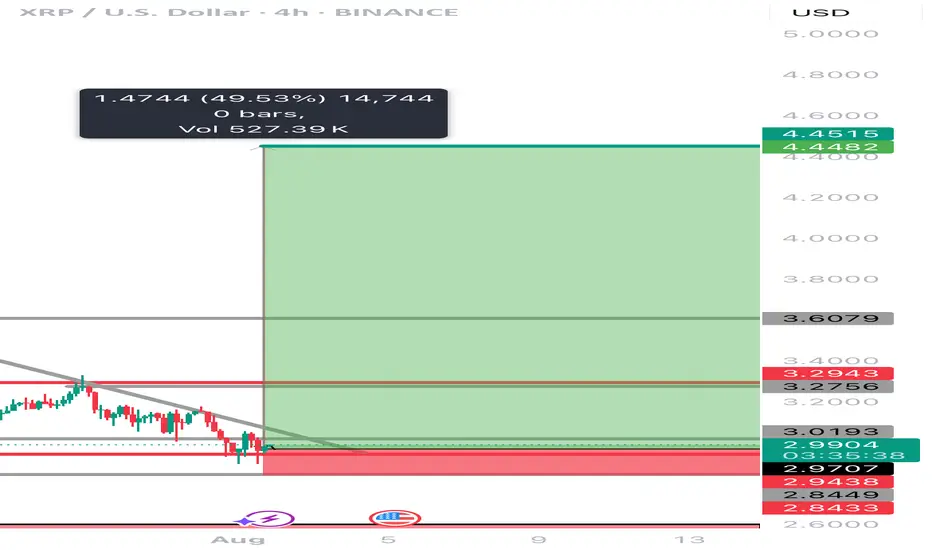
Can XRP obtain a 50% increase in the next few weeks XRP has recently been under a lot of manipulation lately! Is it time for the bulls to finally step in and move the price point on this digital asset to a 50 percent increase to another ATH at $4.45………? The world will see with the next few weeks! And why is #Bradgarlinghouse X account always following 589………..? It’s it a signal or is he just trolling
Xrp - The final bullish breakout!💰Xrp ( CRYPTO:XRPUSD ) will create new all time highs:
🔎Analysis summary:
After a consolidation of an incredible seven years, Xrp is finally about to create new all time highs. With this monthly candle of +40%, bulls are totally taking over control, which means that an altcoin season is likely to happen. And the major winner will simply be our lovely coin of Xrp.
📝Levels to watch:
$3.0
🙏🏻#LONGTERMVISION
SwingTraderPhil

XRP Path to 200XRP is so bullish.
Based on FIBS and Camarillas, this is a realistic path for the next 6 months to a year.
Gl hf.

XRP at $2.93? They Forgot What’s Coming?XRP isn’t just another coin. With clarity coming from major rulings, its return to previous highs isn’t just possible it’s probable. I like this level. Watching price and fundamentals line up.
I’m not just looking at the chart — I’m looking at the bigger picture.

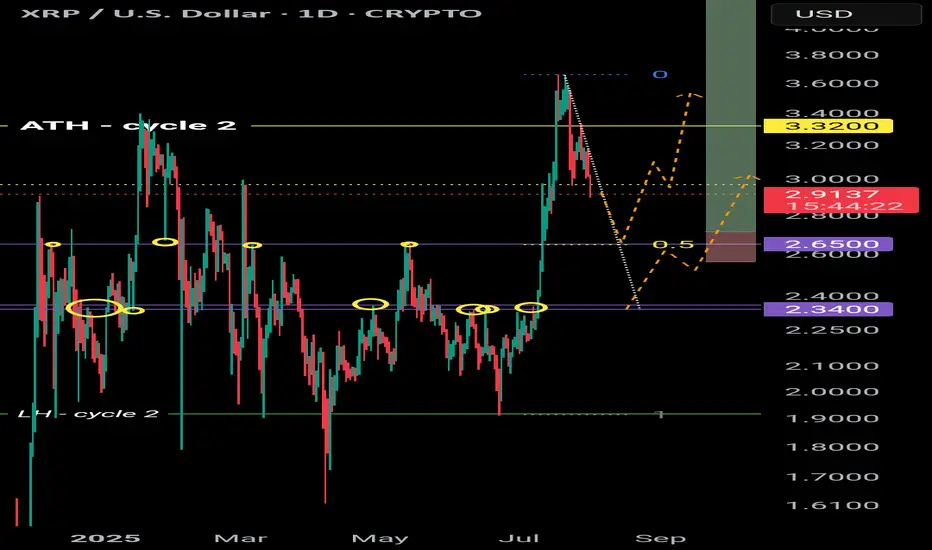
XRP retracement levelsWhere is XRP next likely to head next?
$2.65 is the next price level down with 4 points of contact. This level was also a weekly high as well as the 0.5 fibbonachi.
Next level down is $2.34 with 6 points of contact.
There is a downtrend forming so a breakout of this trend could be bullish for XRP 📈
XRPUSD downside target 2.656On the daily chart, XRPUSD has retreated from its highs, with short-term bears dominating. Currently, the price is in a downward trend, so shorting near the downtrend line resistance is recommended, with a target around 2.656.

#XRPUSD 1st Aug Looking for one more move higherBINANCE:XRPUSD Looking for one more push to higher, and bullish as far as IV is intact. Any rally should find buyers in 3-7 swings and reach one more high minium.

HEAD & SHOULDER DAILY TIME FRAME! (DOUBLE WHAMMY!!!!)The market has previously created a left shoulder. Now, it has broken out of the top of the Resistance and broken back into the support and resistance, about to form the right shoulder.
Wait for retest of the resistance then sell to the support, AND THEN BUY IT BACK TTHE RESISTANCE!! DOUBLE WHAMMMY!!

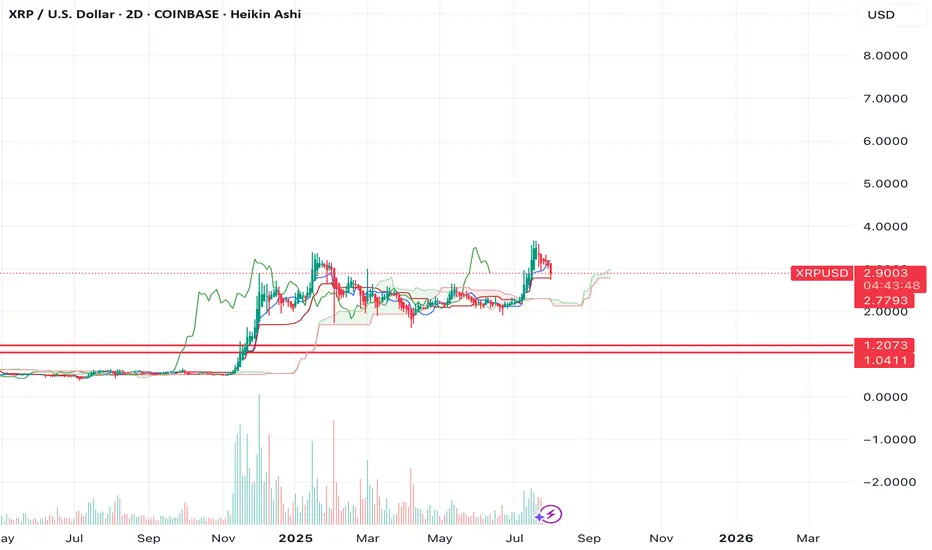
Super bullish!! (I am not a XRP fan, but still) XRP is one of those cryptocurrencies that attract cult-like followers. I am not one of them.
Fundamentally I have no idea about the long term potential of XRP. HOWEVER, purely based on technicaly analysis, it looks very bullish to me.
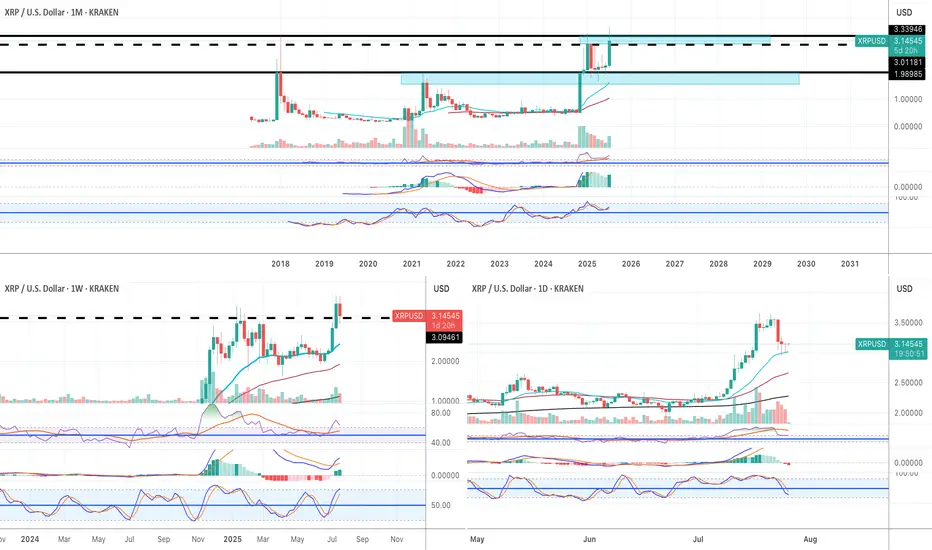
Monthly:
1) the price finally broke above the 2018 historical ATH.
2) All momentum indicators in the bull zone.
3) Both RSI and MACD are in the overbought territory but they can remain in the OB territory for weeks and weeks when the macro bull trend begins.
4) Stochastic lines have crossed to the upside in the bull zone.
Weekly:
1) all momentum indicators are in the bull zone.
2) The price broke above the historical ATH. It is going through pull back now, but, there is a strong buying pressure around $3.15.
Daily:
1) all momentum indicators have reached the overbought territory. The lines are now rolled to the downside, however, it is likely to be a corrective move.
2) the price is hovering above EMA21 where the recent price breakout happened on Thurs 17th July. I have been monitoring price action in lower time frames such as 5 and 15 minutes, and it looks like the price does not want to go below the previous historical high at this stage.
I am not very familiar with XRP, but purely based on the current price action, it looks very bullish. For the very first time as a trader/investor, I deployed my capital to buy XRP last Wed (just under $3.00).
I have already took some profit when it hit $3.60. But I am planning to sell 90% of my XRP when it reaches $4.50 and $5.00, and let the rest run just in case it goes to the moon😅.
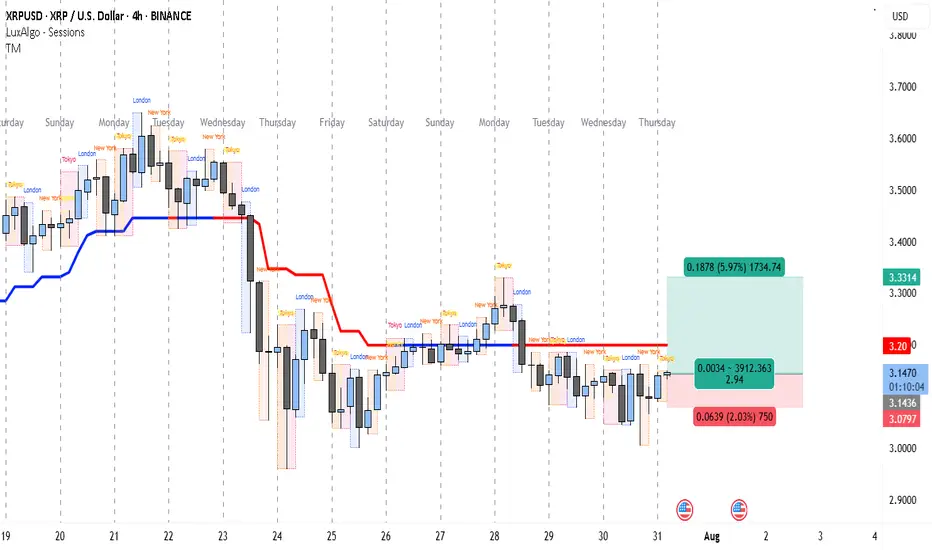
XRP’s 1:3 R:R Setup Could Pay Off FastThe 4-hour chart for XRP/USD indicates a market that has been under selling pressure since the sharp drop around July 23rd, where price broke down from the 3.40+ range. Since then, XRP has been struggling to reclaim higher levels, with the red trend indicator line (likely a moving average or trend-follow tool) acting as a persistent dynamic resistance.
After bottoming near the 3.05 zone on July 25th, the price moved into a sideways consolidation, repeatedly testing both the lower range (around 3.08) and upper range (around 3.20). This tight range suggests accumulation or distribution ahead of a bigger move.
Currently, the chart shows a potential long setup triggered around 3.1450, with a stop loss just below 3.0797 and a take profit target at 3.3314. This setup aims to capture a breakout from the consolidation zone toward the previous resistance area just below 3.35. The risk-to-reward ratio is favorable (close to 1:3), making it an attractive trade for short-term swing traders.
The target level aligns with the price area before the breakdown on July 23rd, where sellers previously gained control. Breaking through that level could signal a short-term trend reversal. However, the price still needs to clear the 3.20 resistance with a strong candle close to confirm bullish momentum.
Trade Setup
• Entry: 3.1450 (current level, inside consolidation support)
• Stop Loss: 3.0797 (below recent swing low)
• Take Profit: 3.3314 (prior resistance zone)
• Risk-to-Reward Ratio: ~1:2.94
• Trade Bias: Short-term long aiming for breakout from consolidation
XRP Long!The setup looks solid! On the Daily timeframe, we’re likely seeing the formation of the final leg up. If this structure holds, we could be eyeing new all-time highs in the coming days to weeks. All indicators are aligned for a strong move ahead. Stay tuned for potential breakouts!
my analysis is not based on this i was just bored but moreso its based fundamentally on EMAS, and potential shifts I am anticipating.

XRP UpdateJust simple analysis, base on breakout line. Hope it will retrace to the blue arrow.
Anyways, do you own analysis and research as well.
☺️

$XRP Historical Golden Ratio - Weekly Timeframe The Historical Golden Ratio (HGR) is the Fibonacci-based market analysis methodology that I created in 2020 (but really discovered). It identifies critical price inflection points by applying Fibonacci in a very unique and fundamental way. It may appear complex from the outside to new and even experienced technical analysis, but under the hood is a very simple and logically built engine that only has two critical parts really. However, it reveals an underlying structure within markets that appears to be fractal-based and dictated by the Golden Ratio. For the experienced market participant, time behind the wheel will reveal that the driving force behind markets has been in plain sight all along; M = φ * H(t) * e^(k * I(t))

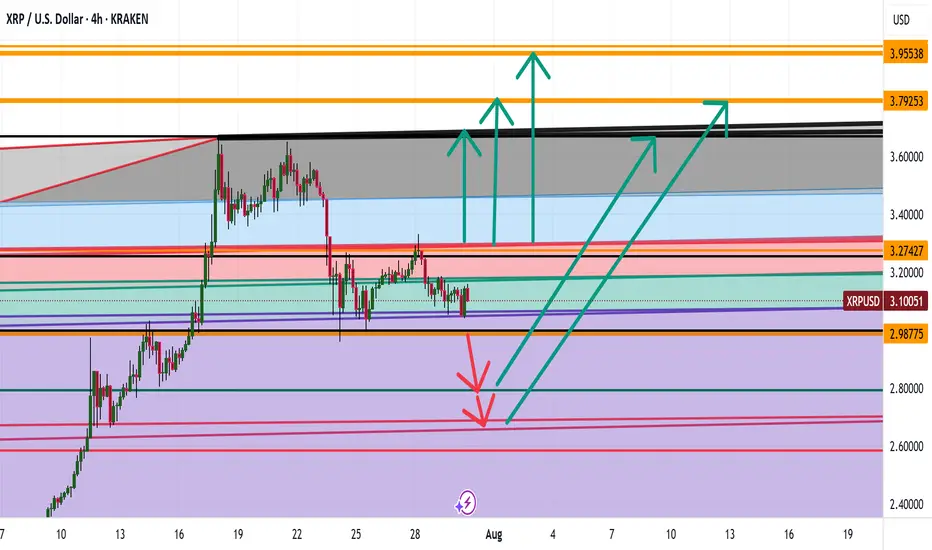
XRP WHERE ARE WE HEADED ? LEVELS TO LOOKOUT FORHey trading fam
So XRP is a fun one but based on BTC correcting and what we are seeing there are a couple thesis's that we currently have for it
Thesis 1: We break south from 2.98 lows: Levels to look out for:
2.80
2.70
2.68
Thesis 2: We break the highs of 3.29: Levels to look out for:
3.65
3.79
3.99
Trade Smarter Live Better
Kris