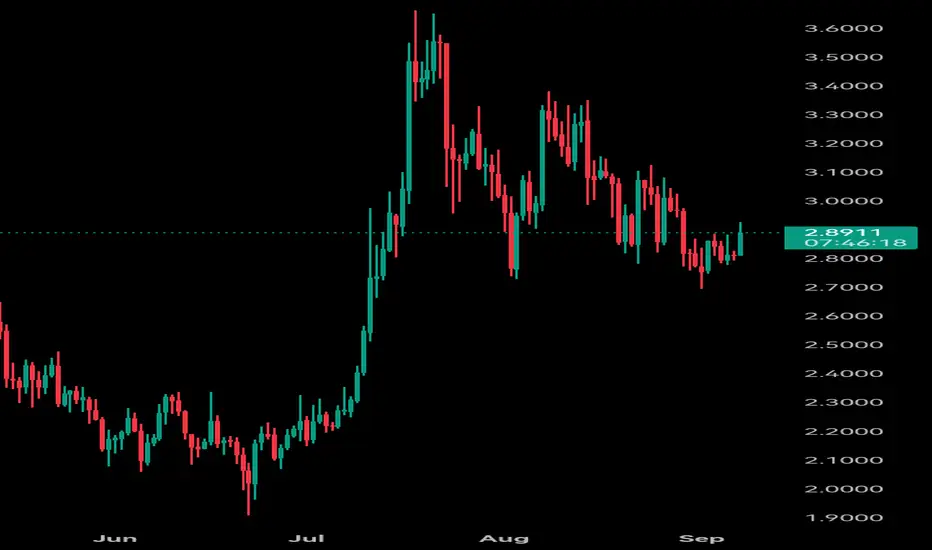
Will XRP Break $5 in Q4? Analysts Spot Bullish SetupXRP is trading near an important support zone, with traders watching for signs of direction. Analysts are weighing two key scenarios: either a continued rebound or a deeper pullback in early September. Market structure, on-chain activity, and regional demand are all being considered as the final quarter of the year approaches.
RIPPLE trade ideas

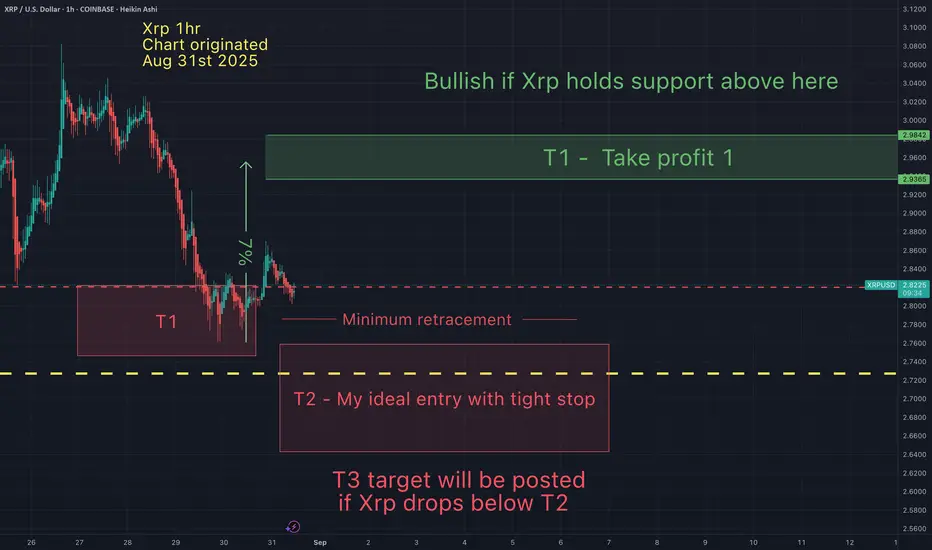
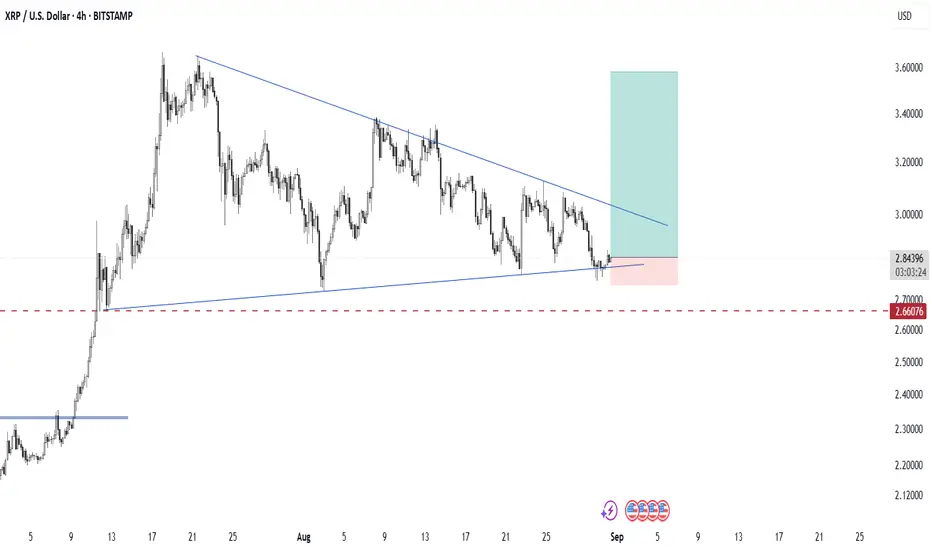
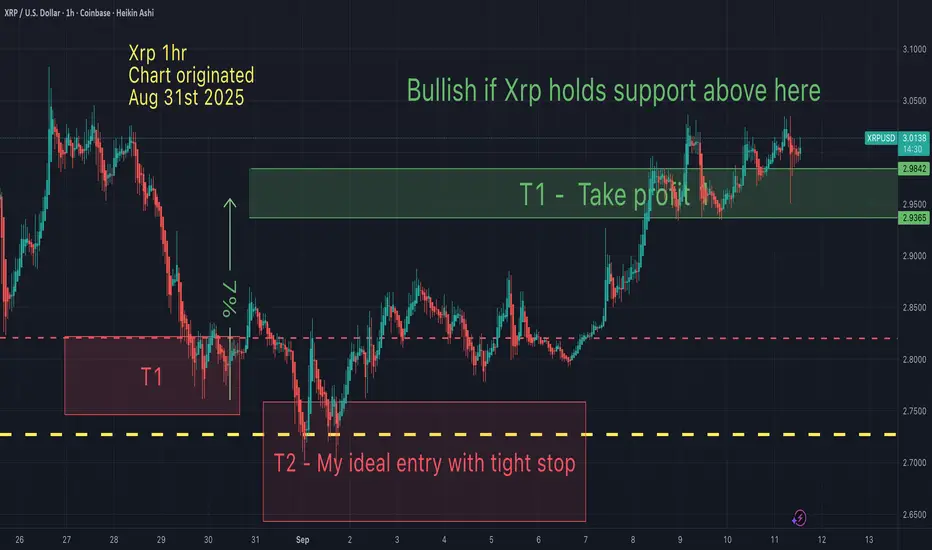
Xrp - Support and resistance & my take profitsThese are my Xrp support and resistance & my take profits. I've been patiently waiting for price to come to me. Now that my T1 has been hit, I'm hoping for a swipe of those lows for my ideal entry. I am cautiously bullish, because there is a chance Xrp goes one leg lower. For now I will chance a long from T1 and T2 (with tight stops) and take profit at my green T1 box.
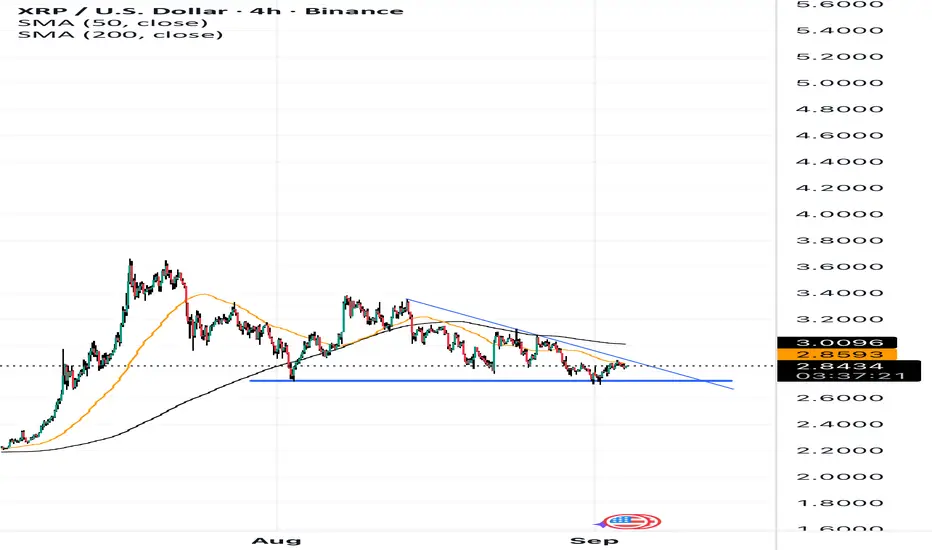
XRP/USD 1D Chart ReviewFormation
The chart shows a narrowing symmetrical triangle (orange lines).
The price is now in the lower part of the triangle, with support around $2.80–2.79.
If the price breaks out of this consolidation, we could see a larger trend move.
Supports
$2.80–2.79 – local support (lower line of the triangle).
$2.63 – strong horizontal support, reinforced by the earlier rebound.
$2.46 (SMA200) – key intermediate-term level.
Resistances
$3.00–3.08 (SMA50) – first major resistance.
$3.17 – next barrier.
$3.42 – strong resistance from July.
Indicators
MACD: below the 0 line, negative histogram → bearish signal, but no strong downward momentum yet.
RSI (41): close to the oversold zone, but still neutral-weak – no clear divergence.
SMA50 (red) is falling and is above the price → selling pressure.
SMA200 (blue) is rising and acting as medium-term support.
Scenarios
Bullish – a rebound from the lower boundary of the triangle (2.80) and an attack on $3.00–3.08. A breakout from the upper boundary of the formation will open the way to $3.42.
Bearish – a breakout below the $2.80–2.79 zone → a test of $2.63 and deeper into $2.46 (SMA200).
Summary
The market is at a critical juncture – price is squeezed within the triangle, indicators are neutral-weak, and volume is decreasing. A breakout from this consolidation (most likely in early September) will set the course for the next move.
👉 If you're trading short term, maintaining the $2.80 level is key.
👉 If you're trading medium/long term, only a break above $3.08–3.17 will provide a strong bullish signal.

WHEN NOTHING FEELS RIGHT XRP⚡ Hey hey, hope things have been well. Here with a quick and short idea for you guys, been juggling a lot lately but wanted to take the opportunity to get a quick idea out while I had the chance so thanks for stopping by.
⚡ We sit here at a time where nothing seems to feel right in a few ways, at a time when we'd expect things to be pushing with all the hype we had going for us from the crypto legislation and the break above that $3 resistance showing the strength behind the market and XRP.
⚡ That being said we've still got our rules and channels which will continue to apply regardless of sentiments and news. Can see how the last month or so we've been pulled down thanks to these two major descending channels with our second one forming after we broke out and broke away from $2.7 before we again slowly descending back to the $2.7 range where we currently stand.
⚡ Technically speaking we're at a support point, we've bounced back up from here before so it'll be a good reference point for active traders on whether or not we'll be headed for another possible breakout or if we'll continue to trend further down within the descending channel until we regain that 200 EMA.
⚡ Next few days should be pretty eventful, especially once memorial day weekend wraps up I'm sure traders will want to get active and make a move but that brings us to my next highlight.
⚡ Historically speaking September is the weakest performing month for the market, it's the month we see stocks and indexes usually stumble a bit before they recover as the new year then approaches so that should be kept in mind. I'd love to see a breakout but if not this would also be a great time to accumulate given that within the next year or two we'll more than likely be trading above that $5 and $6 range.
⚡ Have to go for now but wanted to get a quick idea out and give some reference points with these descending channels. They will either help us get a breakout or push us further if we can't break out of them so keep that in mind along with Septembers historical performance. Much as we love the present looking on the past helps identify and note many key and potential plays.
⚡ As always, thank you so much for the support and all the best till next.
Best regards,
~ Rock'

Bloody sempsI just made a research on crypto moves in Septembers and found that most septs are bloody then in Octobers market revives and jumps!
This is my opinion on xrp , price need a brief and complete retracement to mentioned area, I will all in there , I suggest you all to turn off your PCs and enjoy last summer moments

XRP BUllish FlagConsolidation triangle trap. It wants to break out but where?
With upcoming news of a weakening dollar it seems that a lot of stocks and crypto will begin to break out of the range for newer highs.
There will be a short window of a money grab when the highs are hit.
Just brace for a break out to the bullish side but it will be short lived.

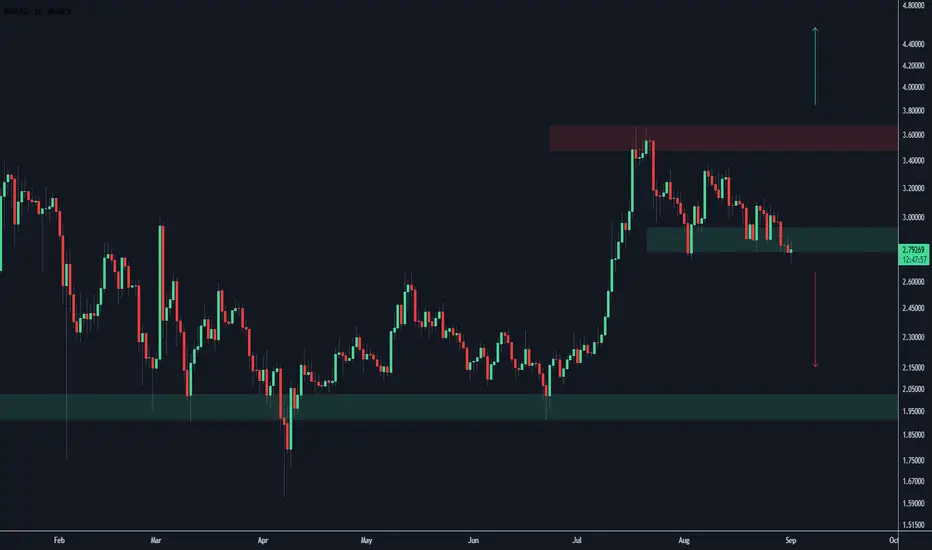
XRP Weekly ChartSee if it breaks out of this range, holding up for now.
Clean range below here back down to $2.
XRP reclaiming $3+1. Support Zone Holding
• Price is respecting the $2.80 – $2.85 support zone (highlighted in blue).
• Multiple bounces from this area show strong buyer defense, which increases the likelihood of a reversal if volume enters.
⸻
2. Descending Triangle Breakout Setup
• The chart shows a descending resistance line (blue diagonal).
• Price is pressing against this downtrend, and each bounce off support makes the resistance weaker.
• A breakout above $3.00 – $3.05 could trigger a bullish rally.
⸻
3. Moving Averages (MA)
• The 50 SMA (orange) is starting to flatten out below the 200 SMA (black).
• If price pushes above $3.05, we could see a bullish crossover on shorter timeframes, often a precursor to a breakout move.
⸻
4. RSI / Momentum (Assumed from Structure)
• Given the consolidation and higher low around $2.80, momentum is likely shifting bullish.
• If RSI breaks above midline (50+), expect increased buying pressure.
⸻
5. Bullish Targets
• Immediate resistance: $3.05 (key breakout zone).
• First target: $3.20 (previous swing high).
• Second target: $3.50 (strong resistance, psychological level).
• Extended target: $3.80–$4.00 if momentum accelerates.
⸻
✅ Bullish Scenario:
If XRP can hold above $2.80 and break $3.05 with volume, the structure favors a reversal rally toward $3.20–$3.50+.
XRP 4H PatternXRP is currently consolidating within a symmetrical triangle pattern, with price action forming lower highs and higher lows. This indicates a period of compression where volatility is decreasing, and a potential breakout could be approaching.
At the moment, the price is testing the lower boundary of the triangle, showing signs of support. As long as XRP holds above the $2.66 support level (highlighted by the dashed red line), the bullish scenario remains valid.
Pattern: Symmetrical Triangle (continuation/neutral pattern)
Entry Zone: Current support trendline near $2.18–$2.20
Stop Loss: Below $2.66 support zone
Target Zone: $3.40 – $3.60 (upper projection of the triangle)
📌 A confirmed breakout above the descending trendline could trigger strong bullish momentum, while a breakdown below $2.66 would invalidate this setup and open the door for deeper correction.
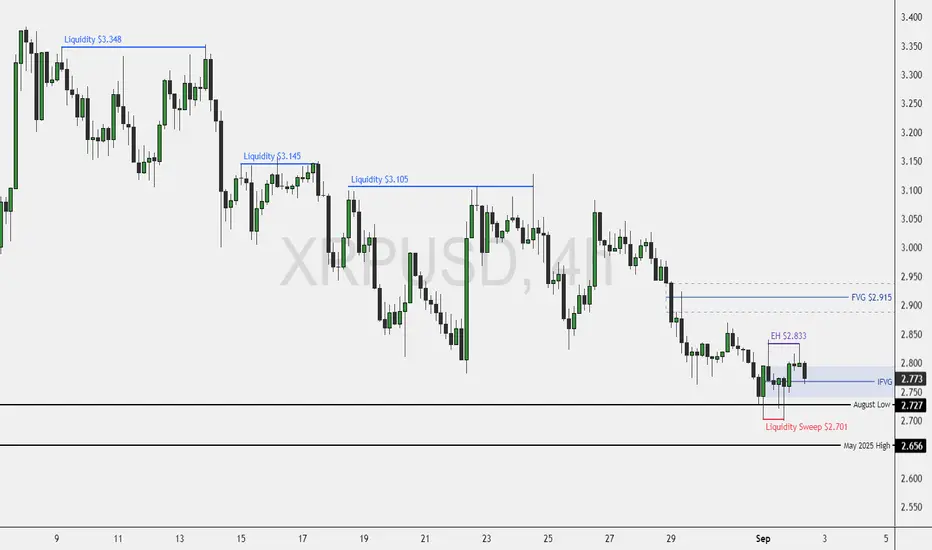
XRP: Bullish Setup Forms Above $2.833FenzoFx—XRP extended its downtrend to the August low of $2.727, briefly sweeping below. On the 4-hour chart, three equal highs at $3.105, $3.145, and $3.348 suggest a bullish setup. Immediate resistance sits at $2.833.
A bullish wave may emerge if this level is engulfed with a fair value gap, targeting $2.915. A strong exit above $2.195 could push toward $3.105 and $3.145.
Ripple ( $XRP ) is literally the reflection of 2017The current wave movements of XRP appear to be a reflection of the period from 2013 to 2017. We are in a re-accumulation phase before the next major upward wave.

XRP/USD: Potential Bullish BreakoutXRP/USD is currently in a consolidation phase, holding strong above the support level at $2.75. We have also observed a positive divergence on the RSI, which is holding within a similar consolidation pattern. This suggests a potential shift in momentum.
Trade Plan:
Support: $2.75
Target: $3.80
Entry Options:
Aggressive Entry: A buy entry can be considered around $2.80.
Safe Entry: For a more conservative trade, wait for a confirmed breakout and retest above $3.01.
This is not financial advice. Always do your own research before trading.

XRP Outlook Heading Into Labor Day WeekendMacro and Market Sentiment
As markets head into the Labor Day weekend, overall risk sentiment remains cautious. Macro uncertainty around inflation, rate policy, and global growth continues to weigh on broader assets, but crypto has shown relative resilience. While Bitcoin remains the primary driver of sentiment, XRP has attracted attention due to its technical positioning at a critical demand zone. Traders appear to be watching closely for whether this level can act as a base for a potential rebound.
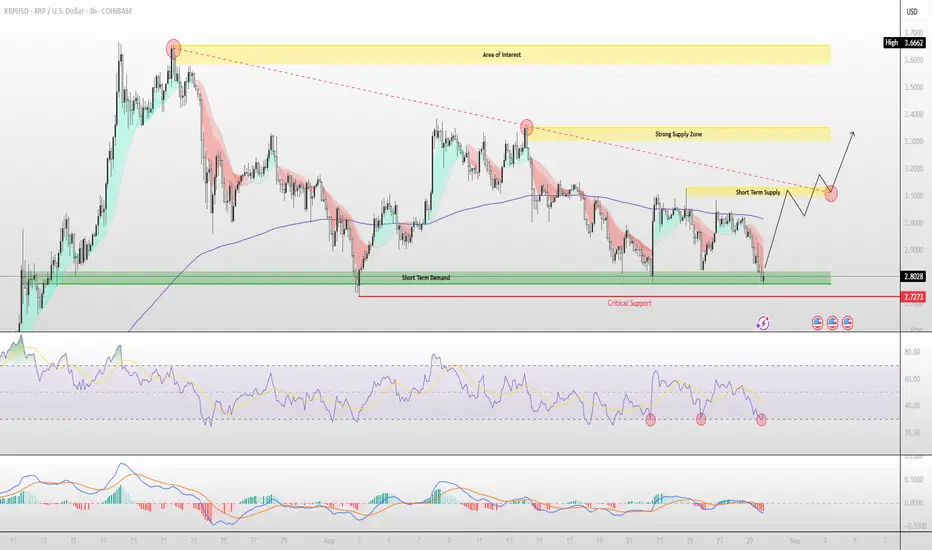
Technical Landscape
On the 3H chart, XRP is currently trading around the $2.79-$2.80 zone , sitting directly on top of a well-defined short-term demand area. Below lies a critical support level at $2.72 , which, if lost, could open the door to further downside toward $2.66. On the upside, supply zones remain layered—first around $3.05-$3.10 , then again at $3.30-$3.40 , with a broader area of interest near $3.60-$3.70 .
Indicators and Momentum
RSI is showing signs of bottoming within oversold territory, while MACD momentum suggests selling pressure is slowing. This aligns with prior instances where XRP has built bases before staging a recovery rally. However, the descending trendline resistance continues to cap upside momentum, meaning any rebound will need to reclaim the short-term supply zone to confirm strength.
Outlook and Scenarios
Bullish Case: Holding above $2.72 could set the stage for a move back toward $3.10, followed by potential extension into $3.30-$3.40. A breakout through this zone could re-ignite momentum toward the high $3.60s.
Bearish Case: A decisive break below $2.72 would invalidate near-term demand and expose XRP to a retest of $2.66 or lower, with sentiment turning defensive.
Conclusion
Heading into a holiday weekend, XRP sits at a make-or-break level. A rebound from current demand zones would favor bullish continuation into September, while a loss of support could lead to a deeper retracement. Traders should monitor price action closely around $2.72 as the key pivot level shaping near-term direction.
Happy Labor Day weekend everybody!
- STACK$
tripple correction for xrplet's see how this play's out it looks that we are in the final correction swing abc impuls move to the downside for completing the tripple correction in label z.

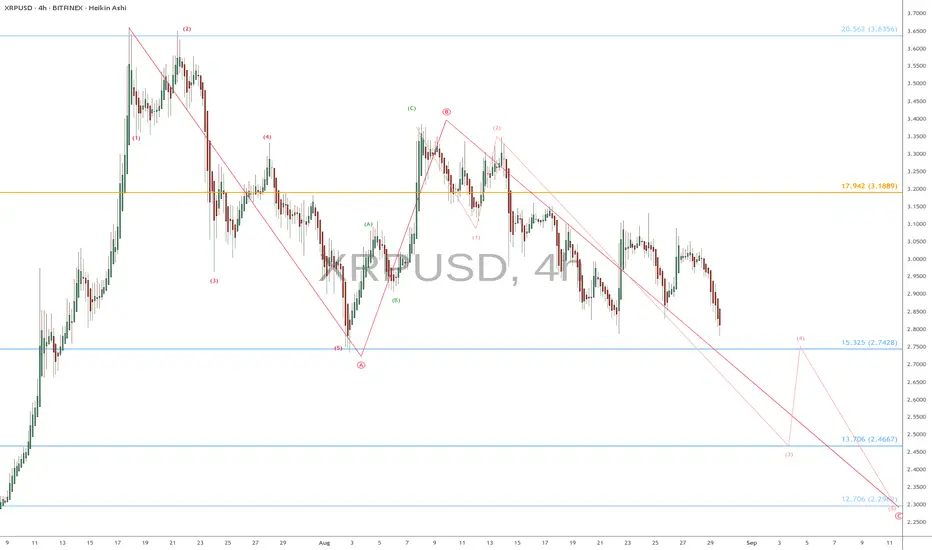
XRP h4 with EW: paints the clearest example of a Market-Wide TOPMany assets classes are showing topping patterns again.
XRP is perhaps the clearest example amongst the cryptos.
EW wise: 5wave (A), 3wave (B), with 5wave (C) to come?
$ 3.1889 Golden fib is the invalidation level
$ 2.4667 should be a fast drop before bounce.
$ 2.2962 is the minimum expected length of (c)
$ 2.0206 sister Golden fib that is always a target.
Of course, this could be totally wrong given the clear FOMO.
Markets have already killed a series of topping patterns.
But IF there is a top anywhere near here, then THIS is it.
.
Other assets at possible tops are below:
ETH
NVDA
META
Gold (XAU.usd)
Hit BOOST and FOLLOW for more such PRECISE and TIMELY charts
========================================================
.
XRP LABOR DAY SALEXRP HIT A CRITICAL SUPPORT ZONE BETWEEN $2.80-$2.76
Xrp can head back towards $3 to test resistance. If xrp breaks $3 it can head to $3.50 and breakout towards $5 on the weekly charting
This is not financial advice. Good luck!
-R2C


EDU-Series 101 | Candles & Ranges contwhere price is in relation to the range will determine what type of label we will name the levels in that range.
When price is below a distribution range, we call the first candle a Break Level. When price reaches this break level it will be acting as resistance holding price down. When Price breaks over it, the distribution cycle has ended and Accumulation ranges will need to created, otherwise, price will fail its accumulation trend and distribute more.
Price below distribution range:
1st candle = distribution cycle start, break level.
last candle = Shield. Price needs to get above this candle if it wants to try to test the break level. If price gains this level, it shields it from distribution further.... since price gains this level and gets above it... we need to re-label it.
Price above distribution range:
1st candle = this is the Back-side of the range, Backside Hold level, (BS for short)
last candle = This is the front-side of the range, Frontside hold level, (FS for short)
The same is true for accumulation ranges but we add the label "inverted" to it since its the same as distribution but inverted...

XRPPossible trade setup opportunity in XRP based on:
1-Price action
2-Volumen action
3-Moving averages and momentum
4-General market conditions

XRP - Take profit targets On Aug 31st I suggested that Xrp would drop lower (to T2) then bounce to my 1st take profit. That played out perfectly. Now the question remains, what next?
Taking some profits at this level is not a bad idea, although I do have 2 other targets slightly higher where I anticipate taking all profits. Until the 3 week down rule plays out, I continue to remain cautious.
I will post these 2 other targets in a chart to follow soon.
May the trends be with you.
XRP/USD – Capped at $3.04🔴 SHORT below $3.04 – target $2.99
XRP trades at $3.01, rejected from $3.04 resistance. SMA200 sits at $2.98, acting as support. RSI dropped from 59 → 52, showing weakening momentum. Bears favored unless $3.04 breaks.
📖 Keywords: #XRPUSD #Ripple #CryptoReversal #BearishSetup #AltcoinWatch

XRP/USD – Sharp Breakout🟢 LONG above $2.92 – target $2.95
XRP trades at $2.93, surging above SMA200 ($2.84). Resistance: $2.94–$2.95, support: $2.79. RSI climbing at 68, just under overbought. Strong momentum suggests bulls can squeeze higher unless rejected hard at $2.95.
📊 Keywords: #XRPUSD #Ripple #CryptoBreakout #MomentumTrade #AltcoinWatch

**XRP Technical Analysis** XRP is currently testing the **$0.**XRP Technical Analysis**
XRP is currently testing the **$0.47** support level, a critical zone that has repeatedly acted as both psychological and technical support since early 2024. The price remains under bearish pressure, trading below key moving averages (50-day at **$0.52**, 200-day at **$0.55**), reflecting persistent selling interest. Volume has been subdued during recent declines, indicating a lack of strong buying momentum.
The daily RSI hovers near **38**, approaching oversold conditions but not yet signaling a reversal. The MACD remains below its signal line, though the histogram shows slight convergence, suggesting potential weakening of downward momentum. Immediate resistance lies at **$0.52** (50-day MA), with stronger resistance at **$0.55**.
Fundamentally, XRP continues to face regulatory uncertainty despite partial legal clarity, limiting bullish catalysts. A break below **$0.47** could trigger a decline toward **$0.44**, while a reclaim of **$0.52** with volume could indicate short-term stabilization. Monitor Bitcoin’s movement for broader market cues.