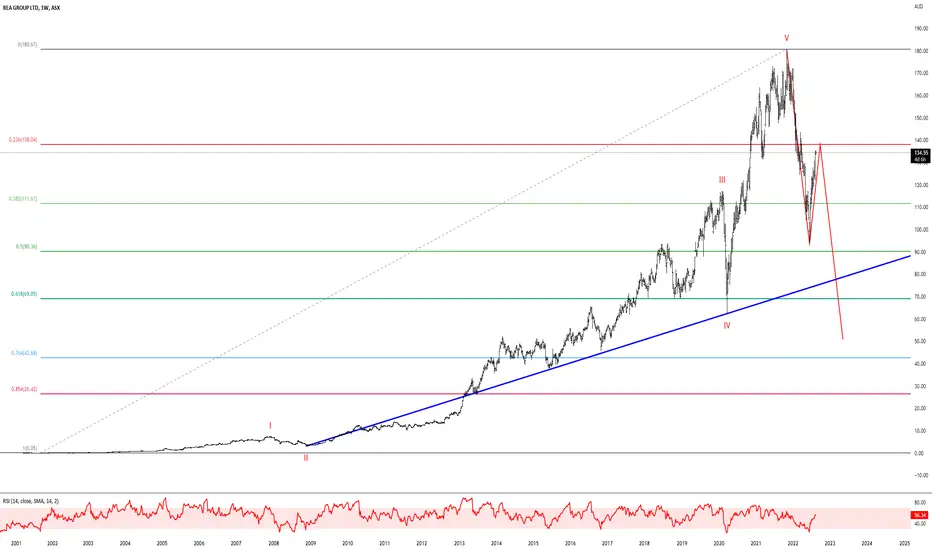
ASX:REA - 13 AUG, 2025 - ELLIOTT WAVE ANALYSISConclusion: Wave 4)-blue needs more time to complete, then wave 5)-blue can move higher.
Key points: Wave 4))-purple has finished at 62.05 and wave 5))-purple is moving higher. It is subdividing into wave 1)blue to wave 4)blue. Basically wave 4)blue is not completed, because there is not enough con
REA Group Ltd
No trades
0.70 USD
439.03 M USD
1.23 B USD
About REA Group Ltd
Sector
Industry
CEO
Cameron Lloyd McIntyre
Website
Headquarters
Richmond
Founded
1995
IPO date
Dec 1, 1999
Identifiers
3
ISIN US74945L1061
REA Group Ltd. engages in the provision of property and property-related services on websites and mobile apps across Australia and Asia. It operates through the Property & Online Advertising and Financial Services segments. The Property & Online Advertising segment derives revenue from Australia, Asia and North America operations. The Financial Services segment consists of commissions earned from mortgage broking and home financing solutions offered to consumers. The company was founded in 1995 and is headquartered in Richmond, Australia.
Related stocks

Classic long Guppy GMMA and ADX #ASX #REAAnother beautiful sight to behold - the intersection of Guppy's GMMAs and ADX uniting into classic long indicators.
#ASX #REA
#MarketMonkey
#long

REA.ASX: 20 AUG, 2024© Master of Elliott Waves: Hua (Shane) Cuong, CEWA-M.
(1D) Details: Wave ((iii))-navy is unfolding to push higher. It is subdividing into wave (i)-orange, which will essentially continue to push higher. Any subsequent large decline would suggest that wave (ii)-orange is unfolding to push lower. Eve

REA.ASX: 09 JULY, 2024AUSTRALIAN STOCK: REA.ASX - 09 JULY, 2024
© Master of Elliott Wave Analysis: Hua (Shane) Cuong, CEWA-M (Master's Designation).
Forecast: Bullish
Wave (iii)-orange appears to be unfolding to push higher, while price must stay above 189.80 to sustain this outlook.
Invalidation point: 189.80

ASX - REA: 30 APR, 2024© Master of Elliott Wave Analysis: Hua (Shane) Cuong, CEWA-M
Details: The short-term outlook suggests that the 2-red wave appears to have recently completed as a Double Zigzag correction, and the 3-red wave may be ready to push higher. Further upward movement would confirm this outlook.
Invalidati


Bull Trap.Market is in the process of a large bull trap I believe - if timelines end up being correct expect a bottom early next year.
Nailing Bottoms On The Daily.tad more downside expected here - should bottom around $100~ @ centreline or next would be bottom of channel - break of channel to the upside would confirm the correction is over.


REA - Cup and Handle PatternKey Technicals - High probability trade here with the REA chart showing a Cup & handle pattern. Looking to buy on breakout (top of cup) with above average volume or on the breakout retest as resistance becomes support.
Key Fundamentals - Governments likely make sure housing recovery keeps on keepin

See all ideas
Summarizing what the indicators are suggesting.
Oscillators
Neutral
SellBuy
Strong sellStrong buy
Strong sellSellNeutralBuyStrong buy
Oscillators
Neutral
SellBuy
Strong sellStrong buy
Strong sellSellNeutralBuyStrong buy
Summary
Neutral
SellBuy
Strong sellStrong buy
Strong sellSellNeutralBuyStrong buy
Summary
Neutral
SellBuy
Strong sellStrong buy
Strong sellSellNeutralBuyStrong buy
Summary
Neutral
SellBuy
Strong sellStrong buy
Strong sellSellNeutralBuyStrong buy
Moving Averages
Neutral
SellBuy
Strong sellStrong buy
Strong sellSellNeutralBuyStrong buy
Moving Averages
Neutral
SellBuy
Strong sellStrong buy
Strong sellSellNeutralBuyStrong buy
Displays a symbol's price movements over previous years to identify recurring trends.