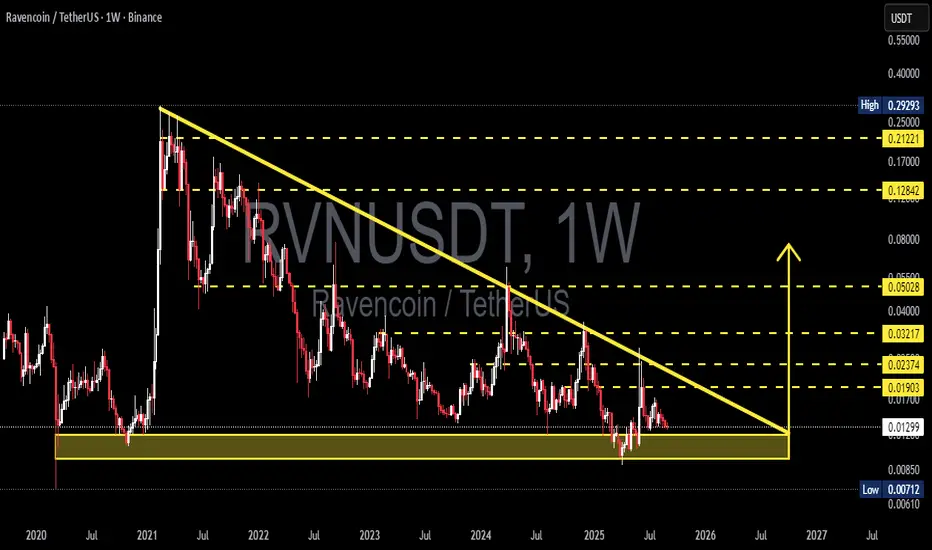
RVN/USDT — Descending Triangle: Breakout or Breakdown?Ravencoin (RVN) is now standing at one of its most critical levels since 2021. On the weekly chart, we clearly see a Descending Triangle pattern:
Lower Highs pressing the price down for years.
Strong demand zone around 0.00712 – 0.0130 USDT still holding as the last defense for buyers.
Price is
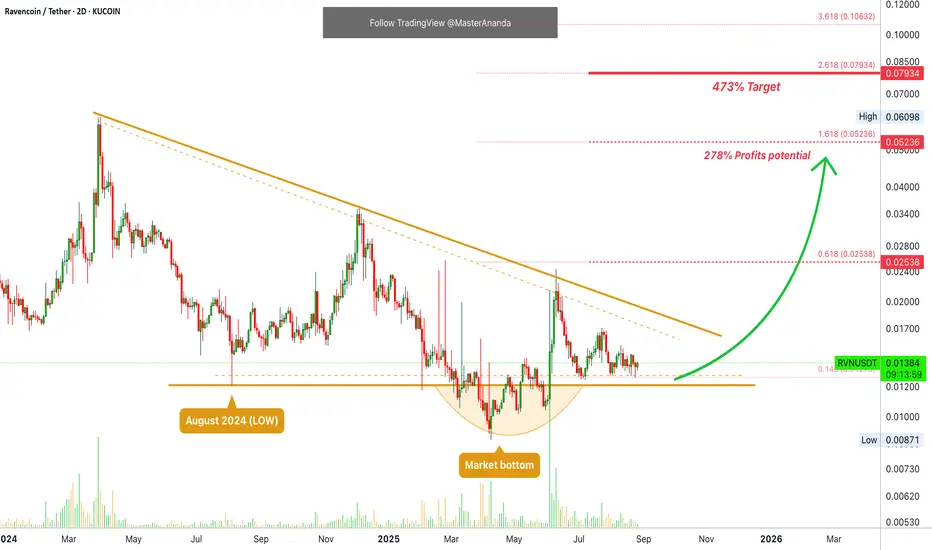
Ravencoin · Bullish Altcoins & Futures Trading Trade-NumbersRemember Ravencoin? At one point this project worked as a very strong signal and confirmation in support of our late 2025 altcoins market bull market thesis. The strong bullish jump and high volume in early June reveals a bottom, and a bottom reveals the end of a bearish period, and the end of a bea
Ravencoin ( RVN)RVN usdt Daily analysis
Time frame 4hours
Risk rewards ratio >1.5
Target = 0.01133
Short position for short time


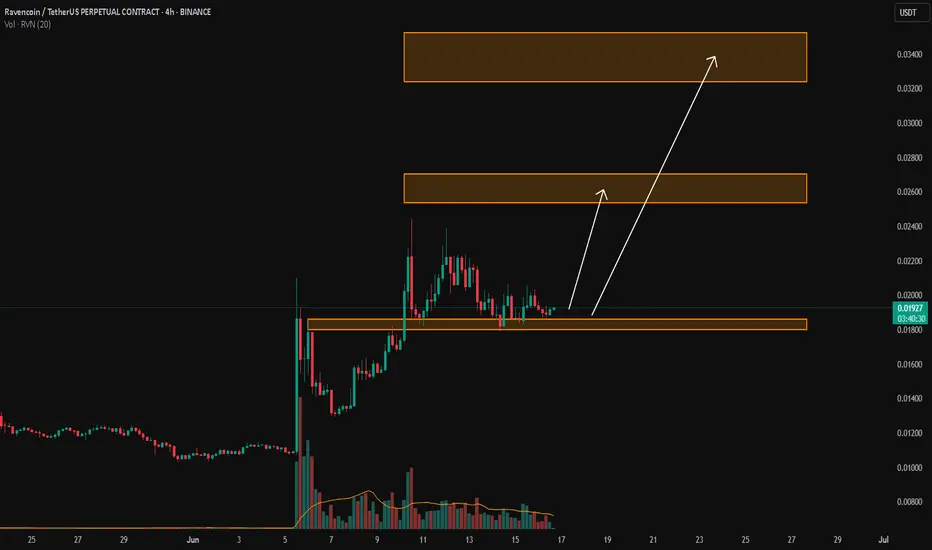
#RVN RavencoinThere are two targets showns above:
1st one correction 0.5 Fibo retracement
2d one -0.618 Fibo retracement!
RVNUSDT Massive Breakout Loading? After 2 Years of Compression!
📈 Weekly Technical Analysis: Ravencoin (RVN/USDT)
🧠 Main Pattern: Descending Triangle ⚠️
Ravencoin has been consolidating within a Descending Triangle since early 2021 — typically a bearish continuation pattern, but one that can lead to a massive trend reversal if the upper boundary is broken.
🟨

RVN/USDTKey Level Zone: 0.01550 - 0.01620
LMT v2.0 detected.
The setup looks promising—price previously trended upward with rising volume and momentum, then retested this zone cleanly. This presents an excellent reward-to-risk opportunity if momentum continues to align.
Introducing LMT (Levels & Momentum
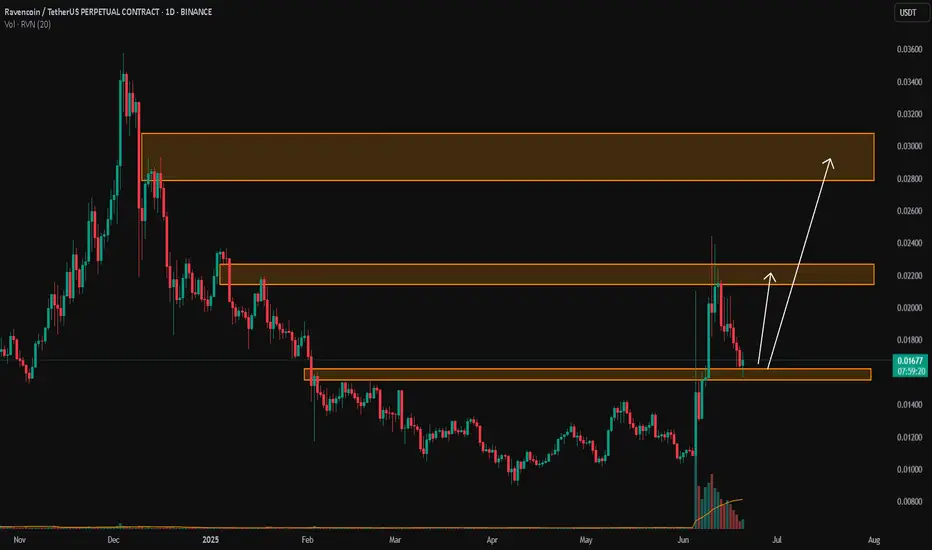
RVN/USDTKey Level Zone: 0.01800 - 0.01860
LMT v2.0 detected.
The setup looks promising—price previously trended upward with rising volume and momentum, then retested this zone cleanly. This presents an excellent reward-to-risk opportunity if momentum continues to align.
Introducing LMT (Levels & Momentum
Ravencoin Bullish Continuation, Altcoins Bull Market ConfirmedRavencoin produced a major bullish breakout, we've seen many of those. It happens that you get one of these breakouts but the following week bullish action is dead. That was all, end of story. This isn't the case here and this is truly great news.
First, Ravencoin produced some of the biggest volum

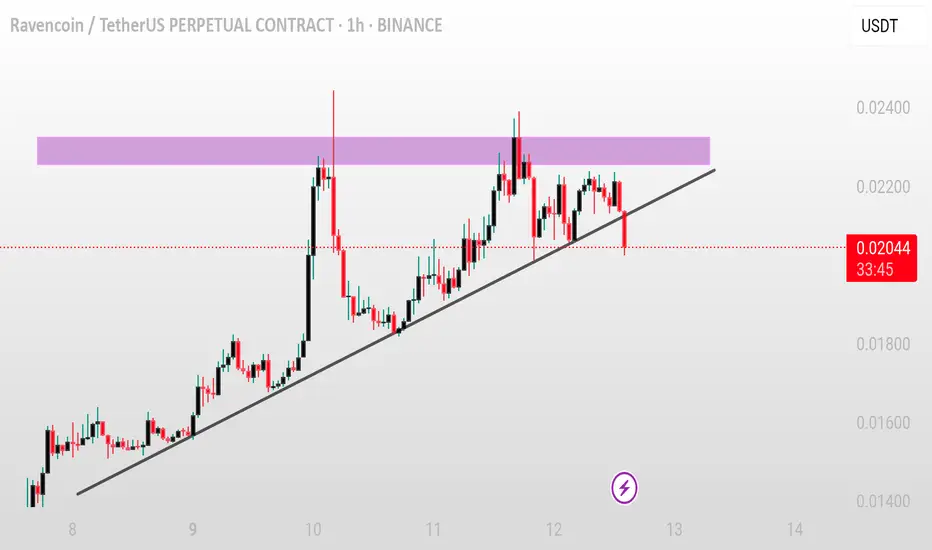
RVN/USDT – Ascending Trendline Breakdown in Play
**Pair:** RVN/USDT 💱
**Timeframe:** 1H ⏱️
**Pattern:** Ascending Trendline Breakdown Attempt ⚠️
RVN is currently attempting to break below a key ascending trendline near **0.0209**. This level has held several times, but selling pressure is increasing 📉.
**Bearish Scenario ❌**
A confirmed 1H clo
See all ideas
Summarizing what the indicators are suggesting.
Oscillators
Neutral
SellBuy
Strong sellStrong buy
Strong sellSellNeutralBuyStrong buy
Oscillators
Neutral
SellBuy
Strong sellStrong buy
Strong sellSellNeutralBuyStrong buy
Summary
Neutral
SellBuy
Strong sellStrong buy
Strong sellSellNeutralBuyStrong buy
Summary
Neutral
SellBuy
Strong sellStrong buy
Strong sellSellNeutralBuyStrong buy
Summary
Neutral
SellBuy
Strong sellStrong buy
Strong sellSellNeutralBuyStrong buy
Moving Averages
Neutral
SellBuy
Strong sellStrong buy
Strong sellSellNeutralBuyStrong buy
Moving Averages
Neutral
SellBuy
Strong sellStrong buy
Strong sellSellNeutralBuyStrong buy
Displays a symbol's price movements over previous years to identify recurring trends.